Try it on your own data
Every report in this article is in the free plan. One snippet for web and apps, up to 10 sites.
Start freeA content marketing dashboard should answer four questions on one page: which posts bring readers, which bring results, where readers come from and what to fix next. Eight panels cover it, led by sessions and conversion rate per post; in our sample, post E has 8.2% of sessions but 15.9% of sign-ups.
What you will learn
- Eight panels: top posts, conversions per post, search clicks and CTR, referrals, campaign traffic, engagement, page speed and a trend with publish dates
- Show sessions and conversion rate side by side: in the sample, post E converts at 3.00% against 1.54% overall
- Judge posts that start journeys by first-touch credit too: post D closes 31 sign-ups but starts 44
What a content marketing dashboard has to answer
A content marketing dashboard is a single page that tells you which posts bring readers, which readers turn into sign-ups or sales, and what to do on Monday. A general marketing dashboard covers every channel; this one covers only what your content does. If it does not change a decision, a panel does not belong on it.
Start from four questions and let each one decide the panels:
- Which posts bring readers? Sessions per post and search clicks per page.
- Which posts bring results? Conversions per post, not only traffic.
- Where do readers come from? Search, referral sites, newsletter links and social.
- What should we fix or promote next? Posts that rank but do not get clicked, posts that get clicks but do not convert, and posts that are slow.
The panels below answer these. Eight is a deliberate limit: more than that and nobody reads the page. For the deeper analysis behind these numbers, see content marketing analytics.
The 8 panels and how each metric is defined
| # | Panel | Question it answers | Metric and definition | Where the data comes from |
|---|---|---|---|---|
| 1 | Top posts | Which posts bring readers? | Sessions per page | Page analytics |
| 2 | Conversions per post | Which posts bring results? | Conversions ÷ sessions on that page | Goals plus pages |
| 3 | Search clicks and CTR | Do posts get found and clicked? | Clicks, impressions, CTR = clicks ÷ impressions, average position | Search Console |
| 4 | Referral sources | Who links to us? | Sessions by referring site | Source report |
| 5 | Campaign traffic | Did the newsletter or social post work? | Sessions by campaign tag | UTM parameters |
| 6 | Engagement | Do readers stay? | Bounce rate, average duration | Session data |
| 7 | Page speed | Is the page fast enough? | Largest Contentful Paint at the 75th percentile | Real-user performance |
| 8 | Trend with publish dates | Did publishing or refreshing move traffic? | Daily sessions with dated markers | Trend plus annotations |
Put 1, 2 and 3 at the top, because they are the three you act on. Put 4 to 8 below, as diagnosis.
| Panel | Question | Metric and definition | Source |
|---|---|---|---|
| Top posts | Which posts bring readers? | Sessions per page | Page analytics |
| Conversions per post | Which posts bring results? | Conversions ÷ sessions on that page | Goals plus pages |
| Search clicks and CTR | Do posts get found and clicked? | CTR = clicks ÷ impressions; average position | Search Console |
| Referral sources | Who links to us? | Sessions by referring site | Source report |
| Campaign traffic | Did the newsletter or social post work? | Sessions by campaign tag | UTM parameters |
| Engagement | Do readers stay? | Bounce rate, average duration | Session data |
| Page speed | Is the page fast enough? | LCP at the 75th percentile | Real-user performance |
| Trend with publish dates | Did publishing move traffic? | Daily sessions with dated markers | Trend plus annotations |
Put the first three panels at the top; they are the ones you act on.
Panel 1 and 2: top posts and conversions per post
Traffic alone is misleading, so show sessions and conversion rate side by side.
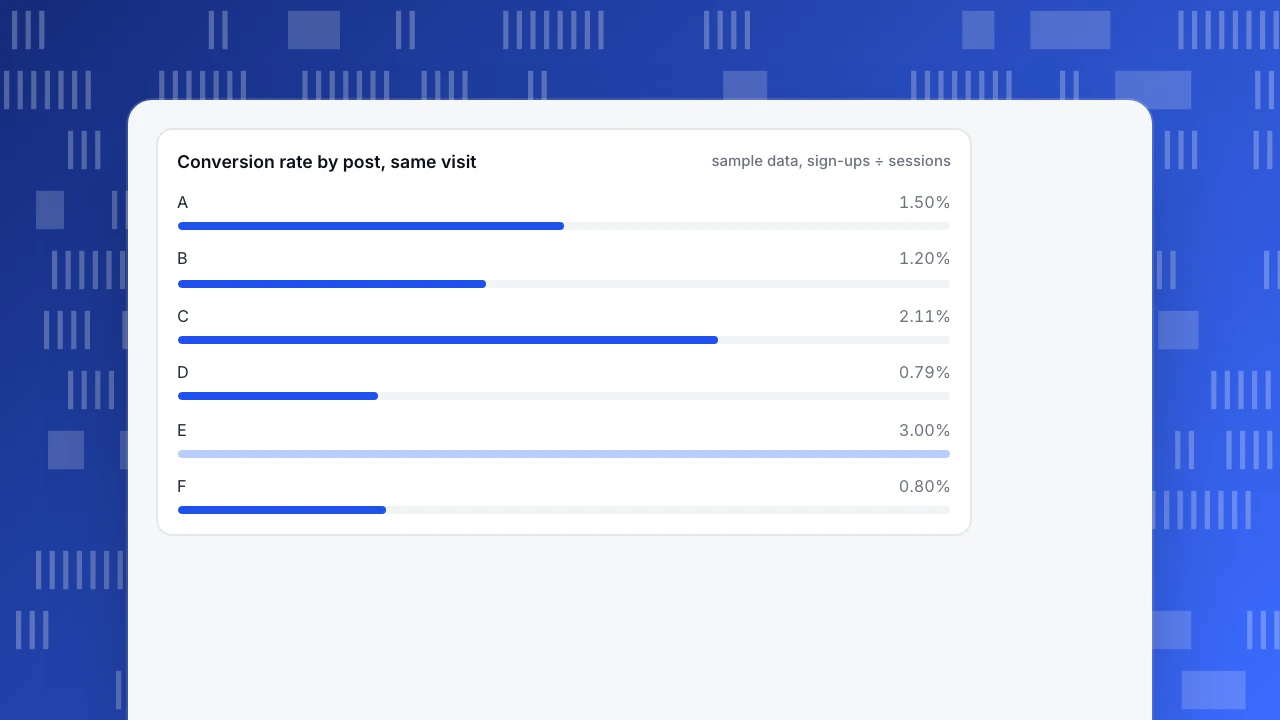
Sample data: one month, six posts, conversion measured as a sign-up in the same visit.
| Post | Sessions | Sign-ups | Conversion rate |
|---|---|---|---|
| A | 12,400 | 186 | 1.50% |
| B | 8,100 | 97 | 1.20% |
| C | 5,600 | 118 | 2.11% |
| D | 3,900 | 31 | 0.79% |
| E | 2,800 | 84 | 3.00% |
| F | 1,500 | 12 | 0.80% |
| All six | 34,300 | 528 | 1.54% |
The total row is the sum of sign-ups divided by the sum of sessions (528 ÷ 34,300), not the average of the six rates. Post E has 8.2% of the sessions and 15.9% of the sign-ups: it converts at about twice the average (3.00 ÷ 1.54 = 1.95). Post D has 3,900 sessions but converts at 0.79%, so it is the traffic that is worth least per visit.
Two rules for reading it:
- If sessions are high and conversion is below average, fix the call to action in the post, not the traffic.
- If sessions are low and conversion is above average, send more readers to it: link from your best-ranking posts, add it to the newsletter.
Conversion rate by post, same visit
sample data, sign-ups ÷ sessionsPanel 3: search clicks and click-through rate
For posts that bring readers from Google, Search Console reports clicks (visits from search results), impressions (how many times the page appeared in results), CTR (clicks divided by impressions) and average position (the position of the topmost result from your site).
Sample data:
| Page | Impressions | Clicks | CTR | Average position |
|---|---|---|---|---|
| 1 | 210,000 | 6,300 | 3.0% | 4.2 |
| 2 | 90,000 | 1,350 | 1.5% | 6.8 |
| 3 | 40,000 | 2,000 | 5.0% | 2.9 |
| 4 | 150,000 | 900 | 0.6% | 11.5 |
The median CTR here is 2.25%. Page 2 ranks in the top 10 but its CTR is below the median: it has plenty of exposure and loses the click. Rewriting its title and description is the cheapest fix. Page 4 sits at position 11.5, so the problem is ranking, not the snippet; no title change helps a page nobody sees.
Panels 4 and 5: referrals and campaign traffic
Referral sources show which sites send readers: list the top referring sites, with sessions and conversion rate for each. A site that sends 200 sessions and converts at 4% is worth a thank-you and a follow-up. A site that sends 2,000 sessions and converts at 0.1% is a different kind of audience.
Campaign traffic works only if your links carry campaign tags. Tag the newsletter, the social posts and the partner links with the same naming pattern, so "newsletter-nov" and "Newsletter_Nov" do not become two rows.
Panels 6 and 7: engagement and page speed
Engagement means bounce rate and average duration. Use them to compare posts with each other, not with a "good" number from somewhere else; a short answer post and a long guide are supposed to differ.
Page speed matters for content because most readers arrive on one page. Google's web.dev defines good Largest Contentful Paint as 2.5 seconds or less, "needs improvement" up to 4.0 seconds and poor above that, measured at the 75th percentile of page loads. Add a threshold rule: show any post whose 75th percentile is above 2.5 seconds, and fix the largest image first.
Panel 8: a trend line that remembers what you did
A line of daily sessions is more useful with dated markers for each publish, update or promotion. Without them you will look at a bump two weeks later and not remember why.
Rule: after any refresh of an old post, compare the 28 days before with the 28 days after. If sessions rose and conversion did not fall, keep refreshing similar posts. If neither moved after 4 weeks, the refresh did not help.
Which posts start the journey
A post that readers see first and convert later never looks good in a same-visit conversion table. Attribution by landing page shows it.
Sample data: the same 528 sign-ups, credited by the first landing page in a 30-day window and by the last.
| Post | Last-touch credit | First-touch credit | First ÷ last |
|---|---|---|---|
| A | 186 | 204 | 1.10 |
| B | 97 | 120 | 1.24 |
| C | 118 | 96 | 0.81 |
| D | 31 | 44 | 1.42 |
| E | 84 | 58 | 0.69 |
| F | 12 | 6 | 0.50 |
Both columns add up to 528. Post D looks weak when judged by closing, but it starts 44 journeys against the 31 it closes (1.42 times): it introduces people who convert elsewhere. Post E closes more than it starts (0.69): it is a post that people reach late, after they have decided. Cut D on same-visit conversion and you cut the start of journeys that convert on E.
A Monday routine: which panel triggers which action
A dashboard that nobody acts on is decoration. Give each panel a rule that says what to do when it fires, and write the rules next to the panels.
| If you see | Then do this | Check after |
|---|---|---|
| A post with sessions above the median and conversion below the 1.54% overall rate | Rewrite the call to action and move it higher in the post | 28 days |
| A page ranking in the top 10 with CTR below the median | Rewrite the title and meta description | 28 days |
| A post with conversion above the overall rate and few sessions | Link to it from your three best-ranking posts and the newsletter | 28 days |
| A post whose 75th-percentile LCP is above 2.5 seconds | Compress or resize the largest image, then re-measure | 14 days |
| A referring site with good conversion | Contact the site and offer an update or a quote | Next month |
| A post that starts more journeys than it closes | Keep it, and add a clear next step to a related post | 28 days |
Limit the Monday list to three actions. Pick the ones with the most sessions behind them, since a fix on a post with 12,400 sessions is worth more than the same fix on one with 1,500. Write the date next to each action, so the trend panel's markers line up with the work.
How to build this dashboard in TapCub
Build it from your own question, not from a template.
- Open Web analytics › Pages for panels 1 and 2. Set a goal in Web analytics › Goals (a sign-up event or a page) so conversions can be counted per page.
- Connect Google Search Console. In Monitoring › Search performance, TapCub shows clicks, impressions, CTR and average position by page and query; pages that rank in the top 10 with a CTR below the median are flagged. Data arrives 1 to 3 days late. Baidu has no click or impression data.
- Use Web analytics › Sources for referrals and campaigns, with UTM-tagged links for panel 5.
- Add publish dates in Configuration › Annotations, so each publish or refresh appears as a marker on the trend.
- For first-touch credit by post, open All-platform analytics › Behavior › Behavior analysis, choose the landing page as the touch, keep the 30-day lookback and select first and last touch to get one column each.
- Share the result as a read-only link with Configuration › Settings › Public sharing, or subscribe a weekly report by email if your plan includes subscription reports. Automated crawlers are counted apart from visitors, so they do not inflate the top-posts panel.
TapCub does not write or schedule content and does not run your newsletter; it measures what happens after the content is published.
FAQ
What should a content marketing dashboard include?
Sessions per post, conversions per post, search clicks and CTR, referral sources, campaign traffic, engagement, page speed and a trend with dated markers. Eight panels cover the questions of reach, results and repair.
Which metrics matter most for content marketing?
Conversions per post and the conversion rate matter most, because sessions alone reward traffic that does nothing. Search clicks and CTR come next, because they show whether the content is found and clicked.
How often should I review it?
Weekly for the top three panels, monthly for the rest. Any refresh of a post should be reviewed after 28 days.
How do I track conversions per blog post?
Define a goal event for the action you want, then divide conversions by sessions on each page. For posts that start journeys, add first-touch credit by landing page.
Can I put this dashboard in a spreadsheet?
You can, but the numbers will go stale. Prefer a dashboard that reads from your analytics directly, and share it as a link.
Sources
- Search Console Help. Performance report (Search results): clicks, impressions, CTR as clicks ÷ impressions, average position. Checked 2026-11-21.
- web.dev. Largest Contentful Paint: good is 2.5 seconds or less, poor above 4.0 seconds, at the 75th percentile. Checked 2026-11-21.
Was this article helpful?
We use your answers to fix and expand this page.
Couldn’t send. Please try again in a minute.
Thanks for the feedback. We’ll use it to improve this page.You’ve already sent feedback on this page. Thanks.

Product Experience Specialist
Writes about product experience, practical workflows, and growth, turning complex processes into clear steps for everyday decisions.