Try it on your own data
Every report in this article is in the free plan. One snippet for web and apps, up to 10 sites.
Start freeThe CPA formula is total cost divided by the number of acquisitions: $2,000 spent for 80 purchases is a $25 CPA. CPA is not CAC, which divides all sales and marketing cost by new customers only ($90 in the sample month). Report channel CPA beside blended CPA, check marginal CPA before raising a budget, and compare with a break-even CPA.
What you will learn
- CPA = cost ÷ acquisitions, or CPC ÷ conversion rate; define the acquisition event and the cost once and keep both fixed
- Blended CPA ($25) hides channel CPA ($20 to $33.33) and marginal CPA ($33.33 on the extra $2,000 of search)
- Break-even CPA = average order value × gross margin ($80 × 40% = $32); set the target below it and compare channels against it
The CPA formula
CPA = total cost ÷ number of acquisitions
Cost per acquisition (CPA) is what you spend to get one defined conversion, such as a purchase, a lead or a signup. Sample data: $2,000 of ad spend produces 80 purchases, so CPA = 2,000 ÷ 80 = $25.
Two decisions sit inside that division and change the answer. First, what counts as an acquisition: one event, written down before you calculate (for example "order confirmed"), not every action the tool labels a conversion. Second, which costs go in the numerator: media spend only, or media plus agency fees and creative. Pick one and keep it for every period, or your CPA will move for reasons that have nothing to do with performance.
The definition page for cost per acquisition covers the term; this article is about calculating it and deciding what to do with it.
The same number from clicks and conversion rate
CPA can also be built from two numbers you often see first:
CPA = cost per click (CPC) ÷ conversion rate
Sample data: CPC is $1.20 and 4% of clicks convert. CPA = 1.20 ÷ 0.04 = $30. Check by the long route: $2,000 buys 2,000 ÷ 1.20 = 1,667 clicks; 4% of 1,667 is 66.7 conversions; 2,000 ÷ 66.7 = $30. Both routes agree.
This form is useful because it shows the two levers. Halving CPC and doubling the conversion rate have the same effect on CPA, and the second is often cheaper to achieve: a better landing page lowers CPA for every click you already pay for.
CPA is not CAC
The two are often mixed up. CPA divides a campaign's cost by a defined action, including actions by existing customers. Customer acquisition cost (CAC) divides all the sales and marketing cost of winning customers by the number of new customers only.
Sample data for one month:
| Item | Amount |
|---|---|
| Ad spend | $20,000 |
| Marketing salaries and tools | $15,000 |
| Sales team cost | $10,000 |
| Purchases (conversions) | 800 |
| Of which new customers | 500 |
- CPA = 20,000 ÷ 800 = $25
- CAC = (20,000 + 15,000 + 10,000) ÷ 500 = $90
Different numerator, different denominator, and a gap of $65 on the same month. Neither is wrong. CPA tells you whether a campaign is efficient; CAC tells you whether the business can afford to grow. Use CPA to compare channels and CAC with lifetime value to judge the model. The how to calculate CAC article covers the second.
Channel CPA and blended CPA
A blended CPA divides all spend by all acquisitions. It is the right number for a budget conversation and a poor one for a channel decision.
Sample data, same month:
| Channel | Spend | Acquisitions | CPA |
|---|---|---|---|
| Search | $8,000 | 400 | $20.00 |
| Social | $7,000 | 250 | $28.00 |
| Display | $5,000 | 150 | $33.33 |
| Blended | $20,000 | 800 | $25.00 |
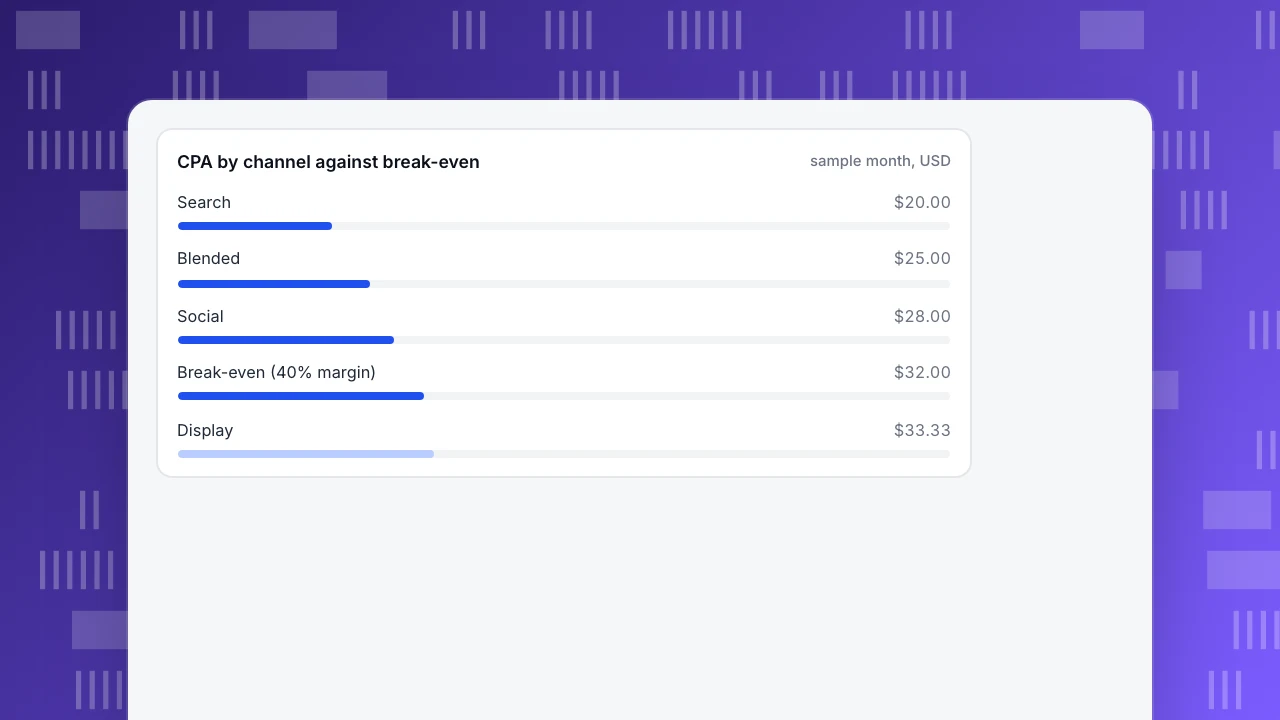
The blended $25 hides a $13.33 gap between search and display. Report channel CPA next to the blended figure, always.
CPA by channel against break-even
sample month, USDAverage CPA hides marginal CPA
Average CPA looks backwards at all the money spent. The decision you face is about the next dollar. Sample data: search spend rises from $8,000 to $10,000 and acquisitions rise from 400 to 460.
- Average CPA after the increase: 10,000 ÷ 460 = $21.74
- Marginal CPA: (10,000 − 8,000) ÷ (460 − 400) = 2,000 ÷ 60 = $33.33
Average CPA barely moved ($20.00 to $21.74) while the extra $2,000 bought conversions at $33.33 each. Compare that with the break-even CPA in the next section: if marginal CPA is above it, the extra spend loses money even though the channel looks healthy on average.
Break-even CPA
Break-even CPA is the most you can pay for an acquisition without losing money on it.
Break-even CPA = average order value × gross margin
Sample data: average order value $80 and gross margin 40% gives a gross profit of $32 per first order, so break-even CPA = $32. The table shows break-even CPA by margin, and the highest CPC you can afford at each conversion rate (maximum CPC = break-even CPA × conversion rate).
| Gross margin | Break-even CPA | Max CPC at 2% | Max CPC at 3% | Max CPC at 4% |
|---|---|---|---|---|
| 30% | $24.00 | $0.48 | $0.72 | $0.96 |
| 40% | $32.00 | $0.64 | $0.96 | $1.28 |
| 50% | $40.00 | $0.80 | $1.20 | $1.60 |
Do not set a target equal to break-even. Leave a margin of safety: a target 20% below break-even is $25.60 at a 40% margin. If you also expect repeat purchases, replace the first order's gross profit with the gross profit per customer over a period you trust, and say so in the report.
Apply it to the channels above at break-even $32:
| Channel | CPA | Profit per acquisition | Acquisitions | Total |
|---|---|---|---|---|
| Search | $20.00 | $12.00 | 400 | +$4,800 |
| Social | $28.00 | $4.00 | 250 | +$1,000 |
| Display | $33.33 | −$1.33 | 150 | −$200 |
| Total | $25.00 | $7.00 | 800 | +$5,600 |
Display loses $200 on first orders. The marginal search spend from the previous section also loses: 60 acquisitions × $32 − $2,000 = −$80. Those two lines are where to look first.
| Gross margin | Break-even CPA | Max CPC at 2% | Max CPC at 3% | Max CPC at 4% |
|---|---|---|---|---|
| 30% | $24.00 | $0.48 | $0.72 | $0.96 |
| 40% | $32.00 | $0.64 | $0.96 | $1.28 |
| 50% | $40.00 | $0.80 | $1.20 | $1.60 |
Sample data: $80 average order value. Maximum CPC = break-even CPA × conversion rate.
Conversion lag and timing
A CPA calculated too soon is too high, because some of this week's spend has not yet produced its conversions. Google Ads recommends a target CPA based on the last 30 days of data, adjusted for conversion delays, and suggests evaluating performance over the last 30 days with at least 30 conversions. Its guidance also says a target CPA is an average, not a cap: some conversions cost more than the target and some less. For its Target ROAS strategy the same help centre cites at least 15 conversions in the last 30 days for Search and Shopping, which is a useful reminder that tiny samples make unstable numbers.
Apply the same discipline to your reports. Compare CPA over windows that are long enough for most conversions to land, mark recent days as incomplete, and do not change a budget on three days of data.
Refunds and quality
CPA counts purchases, not profitable purchases. If 10% of the month's 800 orders are refunded, net acquisitions are 720 and CPA = 20,000 ÷ 720 = $27.78 rather than $25.00. Report both when refunds are material. Likewise, a cheap CPA from low-quality leads is worth little: pair CPA with the share of leads that become customers.
From CPA to a budget
CPA turns directly into a budget in both directions. Spend you can plan = acquisitions wanted × target CPA; acquisitions you can expect = spend ÷ CPA. At the $25.60 target above, a $20,000 budget buys 20,000 ÷ 25.60 = 781 acquisitions, and 1,000 acquisitions need 1,000 × 25.60 = $25,600. If the plan needs 1,000 acquisitions from a $20,000 budget, the required CPA is 20,000 ÷ 1,000 = $20.00, which only search reached last month. That tells you the plan, not the channels, needs revisiting.
Lead CPA versus customer CPA
When the acquisition is a lead, CPA stops at the form. Sample data: a lead costs $12, and 20% of leads become customers. The cost per customer is 12 ÷ 0.20 = $60. Compare that figure, not the lead CPA, with the gross profit per customer. A channel with a $9 lead CPA and a 10% close rate costs $90 per customer, which is worse than the $12 channel. Always carry the funnel one step further than the form.
Mistakes that distort CPA
- Counting every conversion. If 120 newsletter signups are counted next to 80 purchases, CPA drops from 2,000 ÷ 80 = $25 to 2,000 ÷ 200 = $10, which flatters the campaign and says nothing about sales.
- Double counting across platforms. When two ad platforms each claim the same 50 purchases, the claimed total is 50 higher than the real total and every CPA looks lower than it is. Reconcile with your order system.
- Mixing periods. Spend from this month divided by conversions that landed last month is not a CPA.
- Ignoring brand searches. A branded search click comes from someone who already knew you; leave it out when judging a prospecting campaign, or report it on its own row.
A short checklist before you trust a CPA
- One acquisition event, defined in writing.
- One cost definition, unchanged between periods.
- Same window for spend and conversions, with lag allowed for.
- Channel CPA next to blended CPA.
- Marginal CPA checked before you raise a budget.
- Break-even CPA calculated and compared.
- Bots filtered from the clicks and sessions behind it.
In TapCub
Use the sample month above in TapCub.
- Mark the acquisition as a conversion in Web analytics › Goals; for revenue and order figures, use All-platform analytics › Business › Commerce & revenue.
- Import spend in All-platform analytics › Business › Channel ROI: by day, channel, source and campaign, as a CSV or entry by entry.
- Read the page: cost per click is spend ÷ sessions, cost per acquisition is spend ÷ purchases counted in orders, and return on ad spend is also shown, grouped by channel, source or campaign. Compare the rows with the table above.
- Recognised bots are counted separately, so they do not inflate the sessions behind cost per click.
TapCub does not run ad campaigns or set bids; it measures what comes after the click. Its cost per acquisition counts purchases in orders, so a form lead needs a goal and your own calculation.
FAQ
What is the CPA formula?
CPA = total cost ÷ number of acquisitions. For example, $2,000 spent for 80 purchases is $25. You can also write it as cost per click ÷ conversion rate: $1.20 ÷ 4% = $30.
What is the difference between CPA and CAC?
CPA divides a campaign's cost by a defined action; CAC divides all sales and marketing cost by new customers only. In the sample month CPA is $25 and CAC is $90.
How do I calculate a target CPA?
Start from break-even CPA, which is average order value × gross margin ($80 × 40% = $32), then leave a margin of safety. A target 20% below break-even is $25.60.
What is a good CPA?
One below your break-even CPA, with marginal CPA also below it. A number copied from another business means little because margins and order values differ.
Why is my CPA different in different tools?
The tools may count different events as conversions, use different attribution windows or include different costs. Fix the definition first, then compare.
Sources
- Google Ads Help, About Target CPA bidding (an average rather than a cap; recommended targets from the last 30 days; evaluate with at least 30 conversions). Checked 2026-11-21.
- Google Ads Help, About Target ROAS bidding (conversion data thresholds, such as 15 conversions in 30 days). Checked 2026-11-21.
Was this article helpful?
We use your answers to fix and expand this page.
Couldn’t send. Please try again in a minute.
Thanks for the feedback. We’ll use it to improve this page.You’ve already sent feedback on this page. Thanks.

Product Analyst
Focuses on event analysis, conversion funnels, and retention, using clear metric definitions and structured analysis to explain product performance.