Try it on your own data
Every report in this article is in the free plan. One snippet for web and apps, up to 10 sites.
Start freeCRO analytics is using your behavior data to find where visitors are lost, form a reason and decide whether it deserves a test. Split the funnel by device to find the step and group, use clicks, replays, errors and speed to explain it, then write a hypothesis with evidence, a group and a number.
What you will learn
- A hypothesis is only as good as the evidence attached: a step, a group and a reason you can point to
- In the sample, mobile converts at 1.4% against 4.2% on desktop; matching desktop at cart-to-checkout alone is worth +40 orders
- Rank tests by months to a verdict: the same +25% lift takes 0.7 months to detect on the product page and 4.1 months at checkout
What is CRO analytics, and where does it stop?
CRO analytics is the part of conversion rate optimization that happens before anything is built or tested: using your own behavior data to find where visitors are lost, form a reason for it and decide whether that reason is worth an experiment. It ends where the experiment begins. The conversion rate optimization guide covers the whole discipline and the CRO audit covers a one-off review; this article covers the data-to-hypothesis steps in the middle.
The workflow has five steps, and each one needs a different kind of data:
| Step | Question | Data you need |
|---|---|---|
| 1. Define | What counts as a conversion, and out of whom? | One conversion event and one denominator |
| 2. Locate | Where do visitors drop out, and for whom? | Funnel by step, split by device and source |
| 3. Explain | Why do they drop out there? | Clicks, scrolls, replays, form events, errors, speed |
| 4. Hypothesize | What change should fix that reason? | A written hypothesis tied to the evidence |
| 5. Size | Can we detect the effect with our traffic? | Baseline rate and sample size |
The point of the order is that a hypothesis is only as good as the evidence you can attach to it. "Make the button bigger" is an idea; "mobile visitors reach the cart but 60% never start checkout, and they tap the shipping text, not the button" is a hypothesis. Most ideas fail even when well made: a Bing team reported that less than a third of the ideas it tested moved the metrics they were designed to improve. Evidence and sizing are how you spend your few test slots on the ideas most likely to win.
Which numbers should you fix before you analyse anything?
Three decisions change every later number, so write them down once:
- One conversion event. Purchase, trial started or lead submitted. Pick the one the business is paid for.
- One denominator. Sessions, visitors or people. A visitor-based rate is higher than a session-based one for the same traffic, because a returning visitor counts once.
- A real-people filter. Crawlers and AI bots visit pages and never convert. If they sit in the denominator, your conversion rate is lower than it is and your pages look worse than they are.
Keep these fixed for the whole analysis. If you change the denominator halfway through, any before-and-after comparison measures the definition, not the site.
How do you find the leak? Split the funnel by device
A site-wide funnel hides the most useful fact: the leak usually belongs to one group. Split the same funnel by device and compare step by step.
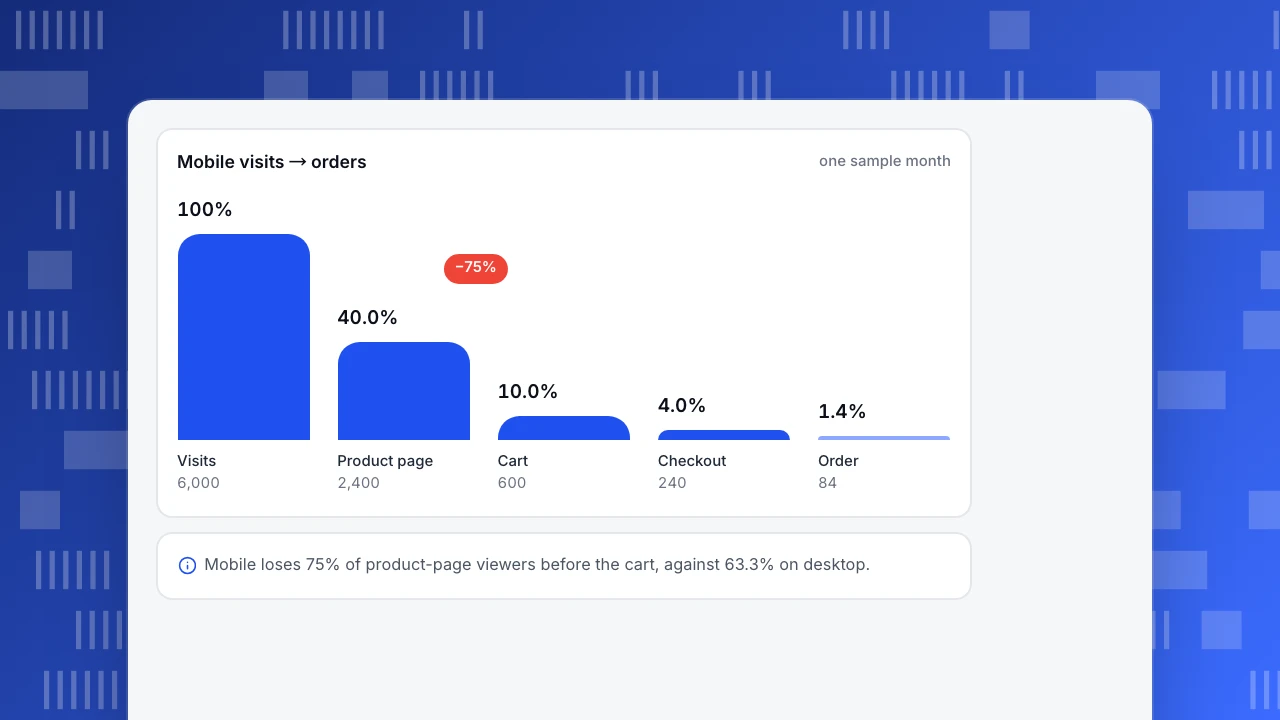
Sample data: 10,000 visits in a month, with 6,000 on mobile and 4,000 on desktop.
| Step | Mobile | Rate from previous step | Desktop | Rate from previous step |
|---|---|---|---|---|
| Visits | 6,000 | — | 4,000 | — |
| Product page | 2,400 | 40.0% | 1,800 | 45.0% |
| Cart | 600 | 25.0% | 660 | 36.7% |
| Checkout | 240 | 40.0% | 390 | 59.1% |
| Order | 84 | 35.0% | 168 | 43.1% |
| Overall conversion | 1.4% | 4.2% |
Overall, the site converts 252 orders from 10,000 visits, 2.5%. That number hides a threefold gap: mobile converts at 1.4% and desktop at 4.2%. Mobile has 60% of the traffic and a third of the orders (84 of 252).
To pick the step to work on, ask how many orders you would gain if mobile matched desktop at that one step, with the other steps unchanged:
- Product page to cart (25.0% → 36.7%): 6,000 × 40% × 36.7% × 40% × 35% = 123.2 orders, +39.2.
- Cart to checkout (40.0% → 59.1%): 6,000 × 40% × 25% × 59.1% × 35% = 124.1 orders, +40.1.
- Checkout to order (35.0% → 43.1%): 6,000 × 40% × 25% × 40% × 43.1% = 103.4 orders, +19.4.
The first two are worth about the same, and the third is half as much. Data from the funnel alone cannot say why, which is the next step.
Mobile visits → orders
one sample monthVisits
6,000
Product page
2,400
Cart
600
Checkout
240
Order
84
Which data explains why people leave?
A funnel says where; other data says why. Match the question to the evidence before you pick one:
| If the funnel shows… | Look at | What would confirm a cause |
|---|---|---|
| A big loss on one page | Click and scroll maps for that page | Clicks on text that is not a link; most visitors never scroll to the button |
| People rage-clicking or repeating a tap | Rage clicks, then session replays of those sessions | A button that looks active but does nothing, or a layer covering it on small screens |
| A loss on a form step | Form submission counts and time on the step | Many starts, few submits, long time on one step |
| A drop right after payment or submit | Error reports for those pages | A spike in errors on the same pages and devices |
| Mobile much lower than desktop | Page speed on mobile | Large Contentful Paint over 2.5 seconds, Interaction to Next Paint over 200 ms or layout shift over 0.1 at the 75th percentile |
| People who stop to ask | Questions in live chat or support on that page | The same question repeated (shipping time, returns, price) |
For the speed row, the thresholds are Google's Core Web Vitals: a page passes when its Largest Contentful Paint happens within 2.5 seconds, Interaction to Next Paint is 200 milliseconds or less and Cumulative Layout Shift is 0.1 or less, each measured at the 75th percentile of page loads and split by mobile and desktop. A mobile-only drop with failing mobile vitals points to speed before design.
How do you turn the data into a hypothesis?
Write each hypothesis in one sentence with four parts:
Because [evidence], we believe [change] will [move this metric] for [this group]. We will know when [result and window].
Using the sample, suppose the heatmap shows mobile visitors tapping the delivery text on the product page and the replays show them scrolling back up to look for the delivery date. The hypothesis reads:
Because 61% of mobile product-page sessions that reach the cart tap the delivery text first (sample), we believe showing the delivery date next to the price will raise the mobile product-to-cart rate from 25.0% to 31.3% for mobile visitors. We will know after 810 visitors per variant.
The parts that matter are the evidence you can point to, the single group and the number you will check. A hypothesis without a group or a number cannot be proven wrong, which means it cannot teach you anything either. Keep a log of hypotheses and results so you do not retest ideas that already failed.
Is the idea worth testing with your traffic?
A test needs enough people to tell a real change from noise. For a conversion rate, the usual two-sided calculation at 5% significance and 80% power is:
n per variant = (1.96 + 0.84)² × [p₁(1 − p₁) + p₂(1 − p₂)] ÷ (p₂ − p₁)²
Sample data: a target of +25% relative improvement at each mobile step, run on a 50/50 split.
| Step | Baseline → target | People per variant | People per month at this step | Months to a verdict | Orders gained if it wins |
|---|---|---|---|---|---|
| Product page to cart | 25.0% → 31.3% | 808 | 2,400 | 0.7 | +21 |
| Cart to checkout | 40.0% → 50.0% | 385 | 600 | 1.3 | +21 |
| Checkout to order | 35.0% → 43.8% | 486 | 240 | 4.1 | +21 |
All three would add 21 orders if the 25% lift is real, because a 25% lift on any step multiplies the final 84 by 1.25. They differ in how soon you would know. The product-page test gives a verdict in about three weeks; the checkout test needs four months of mobile traffic. So test the product page first, work on the cart step next and handle checkout by fixing the evident problems (errors, speed) rather than by experiment. If the months-to-verdict is longer than the time you are willing to wait, either aim at a bigger change or skip the test and make the fix.
| Step | Baseline → target | People per variant | Months to verdict |
|---|---|---|---|
| Product page to cart | 25.0% → 31.3% | 808 | 0.7 |
| Cart to checkout | 40.0% → 50.0% | 385 | 1.3 |
| Checkout to order | 35.0% → 43.8% | 486 | 4.1 |
Sample data: mobile traffic, +25% relative lift, 5% significance, 80% power, 50/50 split.
How do you check that the change worked?
Run the experiment in your testing tool and read the result there; then use analytics for the guardrails around it.
- Check the primary metric at the planned size. Do not stop early because the line looks good on day 4; stopping on a peek inflates false wins.
- Check a guardrail. The step after the one you changed, order value and refund or complaint rate. A change that lifts product-to-cart while the later steps fall can be net negative.
- Look at the same segment. The hypothesis was about mobile visitors, so judge mobile, not the site total, which dilutes the effect by the 40% of traffic that was not touched.
- Mark the release date. Annotate the date on your charts so later readers know what changed and when, and compare the same weekdays before and after, because weekday mix changes conversion.
How do you run this workflow in TapCub?
Take the mobile numbers above. TapCub measures the funnel and the behavior behind it; it does not run A/B tests or split traffic, so the experiment itself runs in your own testing tool or release process.
- Build the funnel. In All-platform analytics › Behavior › Behavior analysis, create a funnel from the product-page view to the cart, checkout and order events. Each step shows the count, the rate versus the previous step, the drop-off and the median time from the previous step, with the largest drop marked. Break it down by device to reproduce the table above.
- Open the page behind the biggest drop. In All-platform analytics › Behavior › Heatmaps, pick the page and the device. The Clicks, Rage clicks, Scroll reach and Elements tabs show where people tap, where they repeat taps and how far they scroll. Heatmaps need autocapture, which needs the Pro plan.
- Watch a few sessions. Session replay is off by default; once you turn it on, open sessions from the dropping segment in All-platform analytics › Behavior › Session replay.
- Check errors and speed. Monitoring › Errors lists error groups with affected sessions and Monitoring › Performance shows real-user Core Web Vitals, so you can rule technical causes in or out.
- Mark the change and compare. Add the release on the chart under Configuration › Annotations, then compare the same weekdays before and after in All-platform analytics › Behavior › Event analysis, whose compare option can align weekdays (the funnel itself has no compare period). If a chat widget is on, read the conversations that start on that page for repeated questions.
FAQ
What is CRO analytics?
CRO analytics is using behavior data to find where visitors fail to convert, form a reason and decide which hypothesis deserves a test. It covers the funnel, device and source splits, clicks, scrolls, replays, forms, errors and speed, and ends where the experiment starts.
Which analytics reports matter most for CRO?
Start with a funnel split by device and source to find the step and the group, then use heatmaps, replays, form events, errors and page speed to explain it. Other reports matter only if they change which hypothesis you pick.
How do you build a CRO hypothesis from data?
Write one sentence: because of this evidence, we believe this change will move this metric for this group, and we will know by this result. Evidence, group and number are the parts that make the hypothesis testable.
How much traffic do you need for a CRO test?
It depends on the baseline and the lift you want to detect. At 5% significance and 80% power, raising 40% to 50% needs about 385 people per variant, while raising 25% to 31.3% needs about 808. Compute it before you start.
Should you test every idea?
No. Test only the ideas whose months to a verdict fit your patience and whose win would matter. For clear faults, such as errors or very slow mobile pages, fix them and monitor the funnel afterwards instead.
Sources
- web.dev, Web Vitals — the Core Web Vitals thresholds and the 75th percentile rule. Checked 2026-11-21.
- Bing Blogs, Large Scale Experimentation at Bing (2013) — less than a third of ideas move the metrics they were designed to improve. Checked 2026-11-21.
- NIST/SEMATECH e-Handbook of Statistical Methods, 7.3.3 Do two processes produce the same proportion of defectives? — the two-proportion test behind the sample-size formula. Checked 2026-11-21.
Was this article helpful?
We use your answers to fix and expand this page.
Couldn’t send. Please try again in a minute.
Thanks for the feedback. We’ll use it to improve this page.You’ve already sent feedback on this page. Thanks.

Product Experience Specialist
Writes about product experience, practical workflows, and growth, turning complex processes into clear steps for everyday decisions.