Try it on your own data
Every report in this article is in the free plan. One snippet for web and apps, up to 10 sites.
Start freeCRO best practices are hypotheses, not rules: only about one third of tested ideas improve the metric they target. This guide ranks seven practices with an impact, confidence and ease score, gives the reported evidence and the metric for each, and shows how many visitors you need to detect a lift. At a 3.0% baseline, confirming a 10% lift takes 53,211 visitors per version.
What you will learn
- Rank practices by impact × confidence × ease, with confidence taken from evidence
- Pair each practice with a metric and a guardrail so a win is a real one
- Check sample size first: a 10% lift at 3.0% needs 53,211 visitors per version, so test bigger changes on small sites
Are CRO best practices rules or hypotheses?
Treat every "best practice" as a hypothesis with a cost and a way to check it. The base rate says why: of the ideas tested at Microsoft, only about one third improved the metric they were built to improve, and the rest were neutral or harmful (Kohavi et al., KDD 2013). A practice that worked on someone else's site has the same odds of working on yours as any other idea, which is to say not high until you have measured it.
That changes how to read a best-practice list. Instead of asking "which of these should we do?", ask three questions of each item: how big could the effect be (evidence), how will we know (a metric and a guardrail) and how hard is it (effort). This article ranks seven practices that way, with numbers, and shows how many visitors you need to detect a lift. It is the practice-level view; for the full programme see the conversion rate optimization guide, and for how to run experiments see CRO testing.
Which practices come first, and how do you rank them?
Score each candidate on three 1–10 scales: Impact (how much it could move the metric), Confidence (how strong the evidence is) and Ease (how cheap and fast to ship). Multiply them. The scores below are sample judgments for an online store, informed by the evidence in the next sections; yours will differ.
| Practice | Impact | Confidence | Ease | Score (I × C × E) | Rank |
|---|---|---|---|---|---|
| Show the total cost earlier | 9 | 7 | 8 | 504 | 1 |
| Compress the hero image to fix LCP | 6 | 9 | 9 | 486 | 2 |
| Offer guest checkout | 8 | 8 | 6 | 384 | 3 |
| Rewrite the pricing page headline | 5 | 6 | 9 | 270 | 4 |
| Add trust badges | 4 | 5 | 9 | 180 | 5 |
| Redesign the navigation | 5 | 3 | 3 | 45 | 6 |
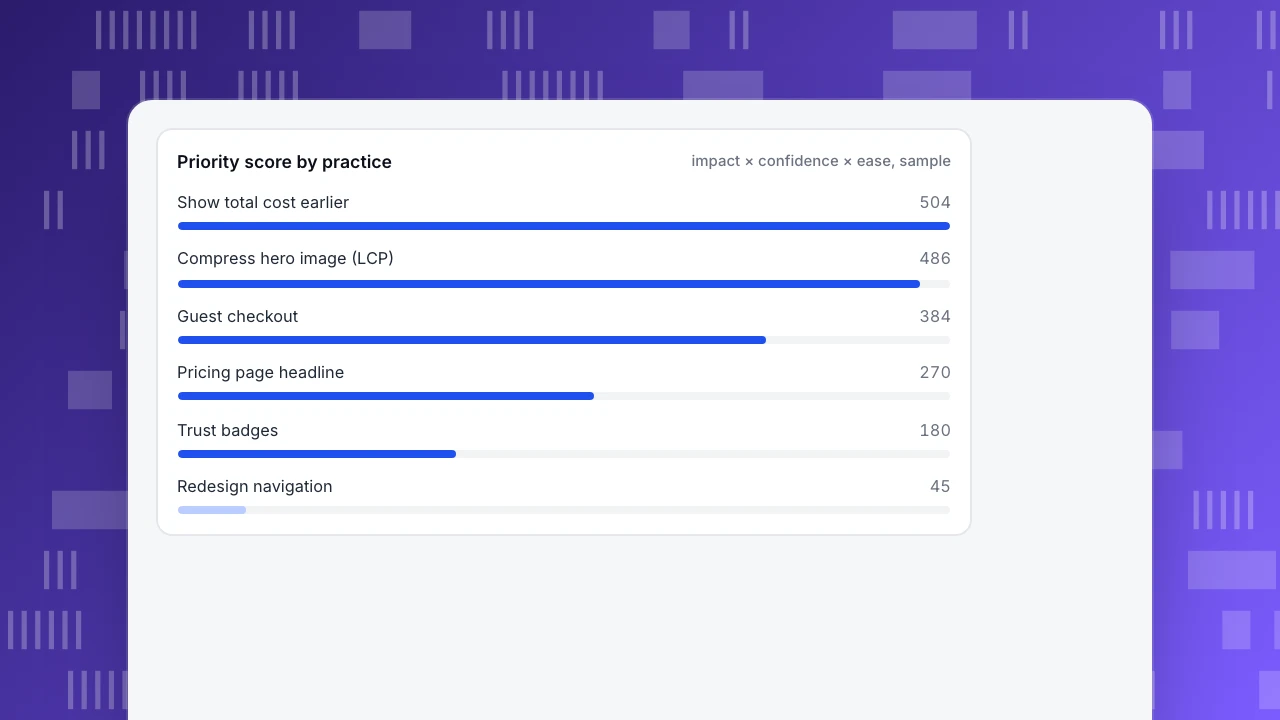
Recompute the top row: 9 × 7 × 8 = 504. The ranking puts cheap, evidence-backed changes above a navigation redesign, which scores 5 × 3 × 3 = 45 because the evidence is thin and the work is large. The scale is relative; what matters is that the order forces a conversation about confidence, not enthusiasm.
Priority score by practice
impact × confidence × ease, sampleWhat does the evidence say about each practice?
| Practice | What reported evidence says | Metric to move | Guardrail metric |
|---|---|---|---|
| Faster pages | 0.1 s faster mobile load went with 8.4% higher retail conversion (37 brands, 30 million sessions) | Conversion by page, LCP at P75 | Bounce rate, error rate |
| Show total cost early | 40% of abandoners cited extra costs, the top reason | Cart to shipping step | Average order value |
| Guest checkout | 18% of abandoners cited forced account creation | Checkout start to order | Repeat-customer rate |
| Simpler checkout | 17% cited a long or complicated checkout | Step conversion | Payment failures |
| Trust signals | 19% did not trust the site with card details | Payment step conversion | Refund and dispute rate |
| Source-matched pages | No outside figure used; compare your own conversion by source before and after | Conversion by source | Cost per order |
| Mobile fixes | No outside figure used; split your own conversion by device | Mobile conversion | Desktop conversion |
Sources for the reported figures: the speed number is from a study on web.dev (mobile load times monitored hourly for 30 days at the end of 2019), and the checkout reasons are from the Baymard Institute review of 50 studies, which puts the average cart abandonment rate at 70.22%. Baymard also estimates that fixing solvable checkout usability issues could raise conversion for the average large e-commerce site by 35.26%; that is its own estimate from its testing, so read it as an upper bound for sites with many problems, not an expectation.
One more number sets the scale for speed. In a Bing slowdown experiment, every 100 milliseconds of improvement raised revenue by 0.6% (Kohavi et al.). A lift of 0.6% is real money at scale and invisible in a small test, which leads to the next question.
| Practice | Metric to move | Guardrail metric |
|---|---|---|
| Faster pages | Conversion by page; LCP at P75 | Bounce rate, error rate |
| Show total cost early | Cart to shipping step | Average order value |
| Guest checkout | Checkout start to order | Repeat-customer rate |
| Simpler checkout | Step conversion | Payment failures |
| Trust signals | Payment step conversion | Refund and dispute rate |
The metric shows the effect; the guardrail catches a win that is really a loss elsewhere.
How many visitors do you need to detect a lift?
Small lifts need large samples, and many sites cannot test them. For a baseline conversion of 3.0%, at 5% significance and 80% power, the visitors needed in each version are:
| Lift to detect | New rate | Visitors per version | Total | Months at 20,000 visits a month |
|---|---|---|---|---|
| +10% relative | 3.3% | 53,211 | 106,422 | 5.3 |
| +20% relative | 3.6% | 13,914 | 27,828 | 1.4 |
| +50% relative | 4.5% | 2,518 | 5,036 | 0.3 |
The formula is n = (1.96 × √(2p̄(1−p̄)) + 0.8416 × √(p₁(1−p₁) + p₂(1−p₂)))² ÷ (p₂ − p₁)², where p̄ is the average of the two rates. For the first row, p₁ = 0.030, p₂ = 0.033, p̄ = 0.0315, and the result is 53,211 per version.
A third lever is the metric you test on. A step with a higher baseline needs far fewer visitors: detecting the same 10% relative lift from a 12.0% add-to-cart rate to 13.2% takes 12,004 visitors per version, about 1.2 months at 20,000 visits a month, against 5.3 months at a 3.0% baseline. Testing an earlier funnel step is quicker, but only valid if that step is what the change is meant to improve.
Two consequences. If a site gets 20,000 visits a month, a 10% lift takes more than five months to confirm, so test big changes (fix the checkout, remove a step) rather than button colours. And when you cannot run a split, a before-and-after comparison with annotated dates and the same weekdays is weaker, but it is the honest alternative.
How do you apply each practice?
- Faster pages. Measure the 75th percentile of Largest Contentful Paint per landing page; "good" is 2.5 seconds or less (web.dev). Fix the heaviest element first, usually the hero image. Check conversion on those pages for 14 days before and after.
- Show the total cost early. Add estimated shipping and tax to the cart page, before the shipping step. Watch the step from cart to shipping: in a sample funnel where 60% of 5,000 carts reach shipping and 80% then 79.2% survive the later steps, moving that first step to 66% gives 2,090 orders instead of 1,900, a 10.0% gain.
- Guest checkout. Offer it as the default and invite account creation after the order. Watch checkout completion and, as a guardrail, the share of repeat customers over the next 90 days.
- Simpler checkout. Remove fields that are not needed to fulfil the order. Count fields before and after; treat the step conversion as the metric.
- Trust signals. Place real signals (return policy, payment methods, contact route) next to the payment step. Only use claims you can substantiate.
- Source-matched pages. If a campaign promises "free shipping over $50", the landing page must say so above the fold. Compare conversion by UTM campaign before and after.
- Mobile first. Split every conversion number by device. A blended rate hides a weak mobile experience, as in data insight examples, where overall conversion falls while each device improves.
Which CRO mistakes waste the most time?
- Testing tiny changes on low traffic. The table above shows a 10% lift needs more than five months at 20,000 visits.
- Ranking by enthusiasm. Score confidence from evidence, not from how much the team likes the idea.
- Stopping early on a good-looking number. Decide sample size and duration beforehand and wait for it.
- No guardrail. Raising conversion by discounting is a result, but a bad one. Track average order value and refunds.
- Counting bots. Automated traffic dilutes conversion rates. Use human visitors only.
- Changing several things at once. You learn that something worked, not what.
- Skipping the write-up. About two in three ideas will not help, so the record of what failed is most of the value.
How do you measure CRO work in TapCub?
TapCub does not run A/B tests or split traffic, and it does not change your site; it measures what happened, so you can check each practice above against the evidence:
- Source and campaign. In Web analytics › Sources, break conversion down by source and UTM campaign to find where visitors and orders differ, and to check source-matched pages.
- Funnels and goals. Define the conversion in Web analytics › Goals, then build the checkout funnel in All-platform analytics › Behavior › Behavior analysis and read the step conversion, such as cart to shipping.
- Speed. In Monitoring › Performance read LCP at P75 per page and find the slowest pages, which are listed by P75 LCP.
- Why people leave a step. Use Heatmaps for clicks and scroll depth and, if you turn session replay on (it is off by default), watch sessions that stopped at the step losing the most people.
- Before and after. Mark each change in Configuration › Annotations and compare date ranges. Recognised bots are counted separately, so conversion rates use human visitors.
- If you need a real split. Run it in your own testing tool and bring the outcome into TapCub as events and goals.
FAQ
What are the best CRO practices?
The ones with evidence behind them and a way to measure: faster pages, showing the total cost early, guest checkout, a simpler checkout and source-matched pages. Rank candidates by impact, confidence and ease, and treat each as a hypothesis to check.
How do you prioritise CRO tests?
Score each idea on impact, confidence and ease (1–10 each), multiply, and test the highest first. In the sample, showing the total cost earlier scored 504 and a navigation redesign 45.
How much can CRO improve conversion?
It depends on how many problems you have. Reported figures include 8.4% higher retail conversion for a 0.1-second faster mobile load and a 35.26% estimate for fixing solvable checkout issues on large sites; treat both as ranges, not promises.
How long should a CRO test run?
Until it reaches the sample size you set in advance, and in whole weeks. At a 3.0% baseline, detecting a 10% relative lift needs 53,211 visitors per version.
Do CRO best practices work on every site?
No. Only about one third of tested ideas improve their target metric, so a practice is a starting hypothesis. Measure it on your own traffic before rolling it out widely.
Sources
- Baymard Institute: cart abandonment rate statistics, checked 2026-11-21
- web.dev: Milliseconds make millions (Deloitte study), checked 2026-11-21
- web.dev: Web Vitals, checked 2026-11-21
- Kohavi et al., Online Controlled Experiments at Large Scale (KDD 2013), checked 2026-11-21
Was this article helpful?
We use your answers to fix and expand this page.
Couldn’t send. Please try again in a minute.
Thanks for the feedback. We’ll use it to improve this page.You’ve already sent feedback on this page. Thanks.

Product Adoption Consultant
Explores customer onboarding, live conversations, and self-service, turning common usage questions into practical guidance and improvements.