Try it on your own data
Every report in this article is in the free plan. One snippet for web and apps, up to 10 sites.
Start freeGood CRO tips name the metric that should move and how to check it. Show costs early (check the cost-step rate), cut form fields, offer guest checkout, speed up pages and fix errors. At a 2.0% rate, a 25% lift needs about 13,800 visits per group to detect and a 10% lift about 80,700, so small sites should make bigger changes.
What you will learn
- Every tip needs a metric you can read before and after the change
- At a 2.0% rate, detecting +25% needs about 13,800 visits per group; +10% needs about 80,700
- Rank tips by share of conversions affected × expected lift, not by how easy they sound
A CRO tip is only worth following if you can verify it
Most CRO tip lists give you the idea and stop. A usable tip names the metric that should move, where to read it, and how much change counts as proof. Without that, you cannot tell whether the change worked, and a conversion rate that goes up for a week after a redesign is as likely to be noise or seasonality as a result. This article gives eight tips in that form, plus the arithmetic for how much traffic you need before you can see a result. The wider process is in the conversion rate optimization guide, and running experiments is in CRO testing.
Eight tips, each with its metric and how to check it
| # | Tip | Metric to verify | Check it by |
|---|---|---|---|
| 1 | Show total cost (shipping, tax, fees) before checkout | Step rate at the step where costs first appear | Compare that step's rate for 4 weeks before and after |
| 2 | Cut form fields to what you need | Form completion rate; time to complete | Count started vs submitted forms; look at the last field people touch |
| 3 | Offer guest checkout or sign-up later | Step rate at the contact or account step | Clicks on sign-in and forgot-password before vs after |
| 4 | Make pages load faster | Largest contentful paint at the 75th percentile; step rates | LCP at 2.5 s or less, then step rate by page speed band |
| 5 | Match landing page to the ad or link | Signup or purchase rate by source and campaign | Split by campaign: does the page repeat what the ad promised? |
| 6 | One primary call to action per page | Click share of the primary button | Primary clicks ÷ all clicks on the page |
| 7 | Answer objections where people hesitate | Exit rate and chat starts on the pricing or checkout page | Questions asked in chat on that page |
| 8 | Fix errors on forms and payment | Error rate on conversion pages | Errors ÷ pageviews on those pages |
Read down the last column: every check is a number you can pull before the change and after it. If a tip has no such number for your site, either start tracking it or skip the tip.
| Tip | Metric to verify |
|---|---|
| Show total cost early | Step rate where costs appear |
| Cut form fields | Form completion rate |
| Guest checkout | Contact-step rate |
| Faster pages | LCP at p75; step rates |
| Match page to ad | Rate by campaign |
| One primary call to action | Primary click share |
| Answer objections | Exit rate and chat starts |
| Fix errors | Error rate on conversion pages |
Each metric can be read before and after the change.
What the published numbers say, and what they do not
Two sourced figures are worth knowing, and neither is a promise for your site.
- Baymard Institute lists reasons shoppers gave for abandoning at checkout (excluding "just browsing"): extra costs too high 40%, site wanted an account 18%, checkout too long or complicated 17%, website errors or crashes 17%. Its checkout review found an average of 23.48 form elements shown by default in US checkouts, against an ideal of 12–14. These are the evidence behind tips 1, 2, 3 and 8.
- A study commissioned by Google and run with Deloitte across 37 brand sites and over 30 million sessions found that a 0.1-second improvement in mobile site speed was associated with 8.4% more conversions for retail sites. That is the evidence behind tip 4, and it is for retail, measured at one point in time.
We do not list "typical uplift ranges" per tip. Published uplifts come from specific sites with specific problems, and the biggest ones come from fixing the worst problem; the same change on a site without that problem does nothing. Your own baseline is the only range that counts.
How much change counts as proof: the sample-size arithmetic
Sample data: a site gets 20,000 visits a month and 400 conversions, a 2.0% rate. To tell a real change from chance with the usual settings (5% significance, 80% power), the sample needed per group is roughly:
n = 7.85 × [p₁(1 − p₁) + p₂(1 − p₂)] ÷ (p₁ − p₂)²
| Lift you want to detect | New rate | Visits needed per group | Months at 20,000 visits (two groups) |
|---|---|---|---|
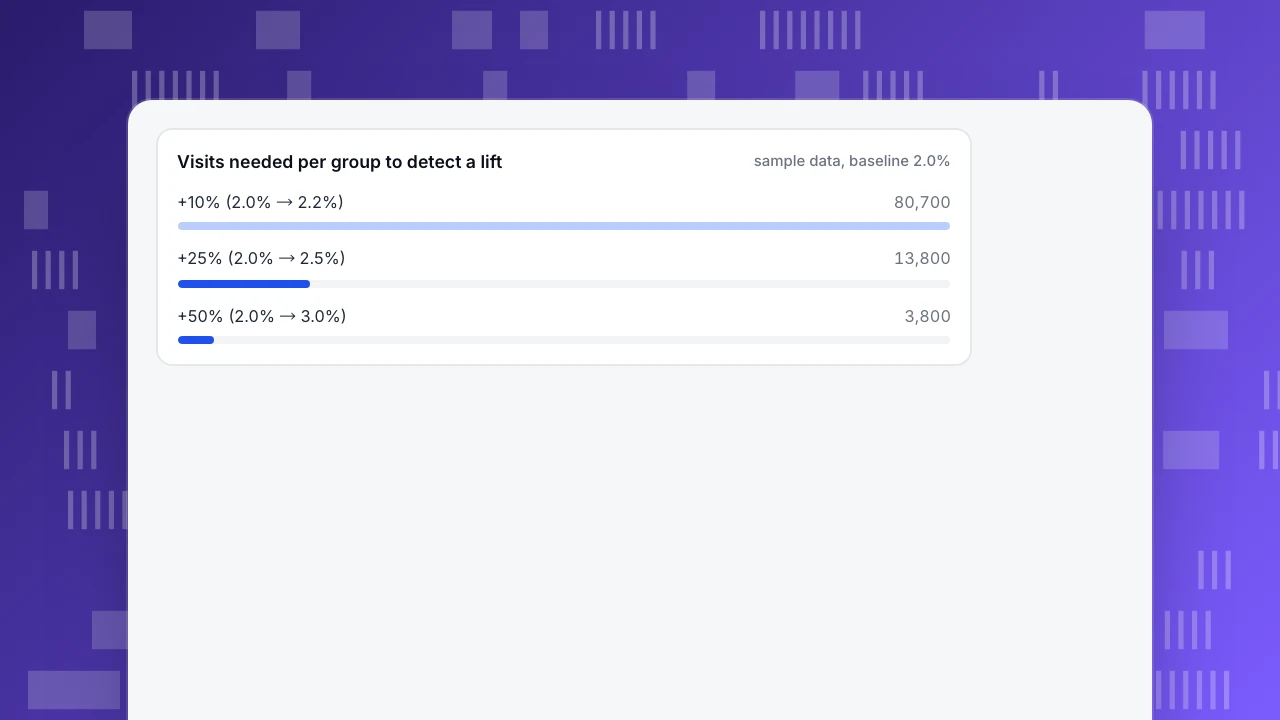
| +10% (2.0% → 2.2%) | 2.2% | about 80,700 | about 8.1 |
| +25% (2.0% → 2.5%) | 2.5% | about 13,800 | about 1.4 |
| +50% (2.0% → 3.0%) | 3.0% | about 3,800 | about 0.4 |
For example, the +25% row: 7.85 × (0.02 × 0.98 + 0.025 × 0.975) ÷ 0.005² = 13,806 per group, so 27,612 visits in total, or 1.4 months of traffic.
What this means: a small site cannot see a 10% improvement in any reasonable time. Make bigger changes (fix the worst problem rather than polish the best page), compare the same weeks before and after, and treat the result as direction, not proof. The two-proportion test used here is described in the NIST engineering statistics handbook.
Visits needed per group to detect a lift
sample data, baseline 2.0%What each tip looks like in practice
A tip becomes a change request when you write the before and after:
- Show costs early. Before: shipping appears on step 3 of checkout. After: "Delivery from 4.90, free over 50" under the price on the product page, and an estimated total in the cart. Verify: the step-3 rate and the share of sessions that visit the shipping-policy page.
- Cut form fields. Before: 14 fields including company size and phone. After: email and password only, with the rest asked after signup. Verify: started-to-submitted rate, and the field where most people stop.
- Guest checkout. Before: account required before payment. After: "Continue as guest" as the primary button, with an option to save details after paying. Verify: contact-step rate and sign-in clicks.
- Faster pages. Before: hero video loads first. After: compress the largest image and delay the video. Verify: LCP at the 75th percentile against the 2.5-second line.
- Match page to source. Before: every ad goes to the home page. After: each campaign goes to a page that repeats its promise in the headline. Verify: signup rate by campaign.
- One primary call to action. Before: three equal buttons. After: one filled button and two text links. Verify: primary click share.
- Answer objections. Before: pricing page has no answers to "can I cancel?" After: a three-line answer next to the plans. Verify: chat questions about cancelling on that page.
- Fix errors. Before: payment form shows a generic error for some cards. After: a clear message and a retry. Verify: error rate and orders after payment errors.
Change one thing at a time when traffic allows it. When it does not (see the sample-size table), batch related changes and say so in your notes, so the later reading is honest about what moved. A batch of three changes that lifts the rate by 15% cannot be split into three separate 5% effects.
Which tip first: expected extra conversions
Rank tips by a rough expected gain: baseline conversions × share of conversions that pass through the change × lift you expect. The lifts below are assumptions for illustration; replace them with your own estimates.
Sample data: 400 conversions a month.
| Tip | Share of conversions affected | Assumed relative lift | Expected extra conversions |
|---|---|---|---|
| Show costs early | 100% | 5% | 20.0 |
| Cut form fields | 100% | 4% | 16.0 |
| Guest checkout | 100% | 3% | 12.0 |
| Match page to ad (paid traffic is 25% of conversions) | 25% | 8% | 8.0 |
| Faster pages (mobile is 60% of conversions) | 60% | 3% | 7.2 |
| Single primary call to action | 60% | 2% | 4.8 |
The top three affect everyone at checkout. Ordering by reach times lift is what makes the list useful; a tip with a high lift on a small share of traffic can lose to a small lift on everyone.
How to check a change worked
- Write the claim first: "Showing shipping on the product page will raise the cost-step rate from 70% to 74% within 4 weeks."
- Use the same weekdays before and after, and mark the change date on your charts.
- Check a second metric that should not move (for example traffic from the same sources), to rule out a change in who visited.
- Look at segments: desktop and mobile, new and returning. A gain on one with a loss on the other averages out to nothing.
- Decide the stopping rule beforehand: a fixed number of weeks or visits. Stopping when the number looks good is how false wins happen.
How to do it in TapCub
Take tip 1 (show costs early) and verify it in TapCub:
- Build the funnel. In All-platform analytics › Behavior › Behavior analysis, create cart → shipping step → payment → order. Each step shows the rate against the previous step and the median time; the largest drop is marked.
- Compare before and after. Add an annotation in Configuration › Annotations on the change date, then read the funnel for the four weeks either side.
- Break down by device or source. Use breakdown to see whether mobile and desktop moved the same way, and Web analytics › Sources to see rates by campaign for tip 5.
- Check speed and errors. Monitoring › Performance shows page performance from real users (Core Web Vitals) and Monitoring › Errors shows the error rate and affected sessions for tip 8.
- See what people ask. For tip 7, Live chat › Inbox shows the page each conversation started on, and Live chat › Reports › Conversion attribution lists the pages chats start on.
TapCub does not run A/B tests or split traffic, so use your own experiment tool or a before-and-after comparison and read the result here.
FAQ
What are the best CRO tips?
The ones that fix a measured problem. Start with the biggest drop in your funnel: costs shown late, long forms, forced accounts, slow pages or errors. Each has a metric you can check before and after.
How long should a CRO test run?
Until it reaches the sample you planned. At a 2.0% rate, detecting a 25% lift takes about 13,800 visits per group; a 10% lift takes about 80,700.
Do faster pages increase conversions?
A Google and Deloitte study found a 0.1-second mobile speed gain was associated with 8.4% more retail conversions. It is a retail finding; check your own step rates by page speed.
How many form fields should a checkout have?
Baymard's review found an average of 23.48 form elements by default in US checkouts and suggests 12–14 as ideal. Remove fields you do not need.
Can I do CRO without A/B testing?
Yes: use before-and-after comparisons on matched weeks, but treat the result as direction, not proof, and make large changes.
Sources
- Baymard Institute, Cart Abandonment Rate Statistics (abandonment reasons; 23.48 average form elements, 12–14 ideal).
- Google and Deloitte, Milliseconds make millions (37 brand sites, over 30 million sessions, +8.4% retail conversions per 0.1 s).
- NIST/SEMATECH e-Handbook of Statistical Methods, 7.3.3 Two-proportion test.
Was this article helpful?
We use your answers to fix and expand this page.
Couldn’t send. Please try again in a minute.
Thanks for the feedback. We’ll use it to improve this page.You’ve already sent feedback on this page. Thanks.

Product Adoption Consultant
Explores customer onboarding, live conversations, and self-service, turning common usage questions into practical guidance and improvements.