Try it on your own data
Every report in this article is in the free plan. One snippet for web and apps, up to 10 sites.
Start freeA custom metric is a number you define from your own events, and it is worth defining only if it changes a decision. Write the numerator, denominator, identity, window, filters and the action threshold, then divide totals once: averaging three daily rates gives 4.67% where the true rate is 2.40%.
What you will learn
- Name the decision and the value that triggers action before you build the metric
- Write seven fields: name, numerator, denominator, identity, window, filters, owner and decision
- Ratios: add the totals first and divide once; the average of daily rates is 4.67% against a true 2.40% in the sample
What makes a custom metric worth defining?
A custom metric is a number you define yourself from your own events, because the built-in ones (visitors, sessions, pageviews) do not answer your question. "Buyers per active person", "share of signups that reached the key action" and "revenue per visitor" are typical examples.
Defining one has a cost: someone has to maintain the definition, explain it and keep it consistent. So a metric earns its place only if it passes one test: name the decision it changes and the value at which you would act. "Activation rate below 35% means we fix onboarding before buying more traffic" is a metric. "Interesting engagement score" is not. For more on this test, see actionable metrics.
If you cannot name the decision, keep the number on a chart, not on the dashboard. Two quick applications of the test: "revenue per visitor" passes if you are choosing between paid channels, because a channel with cheap clicks but $0.05 per visitor loses to one with dearer clicks and $0.40; "total pageviews" usually fails, because no action follows from it going up 8%.
How do you go from a goal to a metric?
Google researchers Kerry Rodden, Hilary Hutchinson and Xin Fu described a way to do this in a CHI 2010 paper: the HEART framework (Happiness, Engagement, Adoption, Retention, Task success) and a process for mapping product goals to metrics. The practical version is three steps:
- Goal: what should be true if the product or page is working? ("New users get value in their first week.")
- Signal: what behavior would show it? ("They complete the key action within 7 days.")
- Metric: how do you count that signal? ("Users who did the key action within 7 days ÷ users who signed up.")
Write the three lines for each metric. If the signal does not follow from the goal, the metric will move without telling you anything.
What does a complete metric definition contain?
Most disagreements about a number are disagreements about an unwritten definition. Write these seven fields:
| Field | Question it answers | Example |
|---|---|---|
| Name | What do we call it? | Activation rate |
| Numerator | Which events, counted how? | Unique people who did key_action |
| Denominator | Which population? | Unique people who did signup |
| Identity | Count what: person, device or session? | Person |
| Window | Over which time, and how long can the action take? | Signups in the period; action within 7 days |
| Filters | What is excluded? | Internal traffic, bots |
| Owner and decision | Who answers for it, and what changes when it moves? | Growth lead; below 35% fix onboarding |
If two people on the team would fill any row differently, you have two metrics with one name.
Which formulas should you start with and what do they give on real counts?
Sample data: one month, 25,000 visitors, 40,000 sessions, 1,000 signups, 400 of whom reached the key action, 120 paid, and $6,000 of revenue.
| Metric | Formula | Result |
|---|---|---|
| Visitor-to-signup rate | signups ÷ visitors | 1,000 ÷ 25,000 = 4.0% |
| Activation rate | activated ÷ signups | 400 ÷ 1,000 = 40.0% |
| Signup-to-paid rate | paid ÷ signups | 120 ÷ 1,000 = 12.0% |
| Revenue per visitor | revenue ÷ visitors | $6,000 ÷ 25,000 = $0.24 |
| Revenue per session | revenue ÷ sessions | $6,000 ÷ 40,000 = $0.15 |
| Revenue per paying customer | revenue ÷ paid | $6,000 ÷ 120 = $50.00 |
| Sessions per visitor | sessions ÷ visitors | 40,000 ÷ 25,000 = 1.6 |
Three things to notice. Revenue per visitor ($0.24) and revenue per session ($0.15) differ by 60% for the same revenue, only because of the denominator. Activation measured against visitors (400 ÷ 25,000 = 1.6%) gives a number 25 times smaller than activation against signups (40.0%), and only one of them describes onboarding. And every rate hides its size, so always show the count next to it.
| Metric | Formula | Sample result |
|---|---|---|
| Visitor-to-signup rate | signups ÷ visitors | 4.0% |
| Activation rate | activated ÷ signups | 40.0% |
| Signup-to-paid rate | paid ÷ signups | 12.0% |
| Revenue per visitor | revenue ÷ visitors | $0.24 |
| Revenue per session | revenue ÷ sessions | $0.15 |
| Revenue per paying customer | revenue ÷ paid | $50.00 |
Sample data: one month with 25,000 visitors, 40,000 sessions, 1,000 signups, 400 activated, 120 paid and $6,000 of revenue.
Why does an average of rates give the wrong answer?
The most common formula mistake is averaging daily rates instead of dividing the totals.
Sample data: three days of one landing page.
| Day | Sessions | Signups | Daily rate |
|---|---|---|---|
| A | 100 | 10 | 10.0% |
| B | 1,000 | 20 | 2.0% |
| C | 900 | 18 | 2.0% |
| Total | 2,000 | 48 |
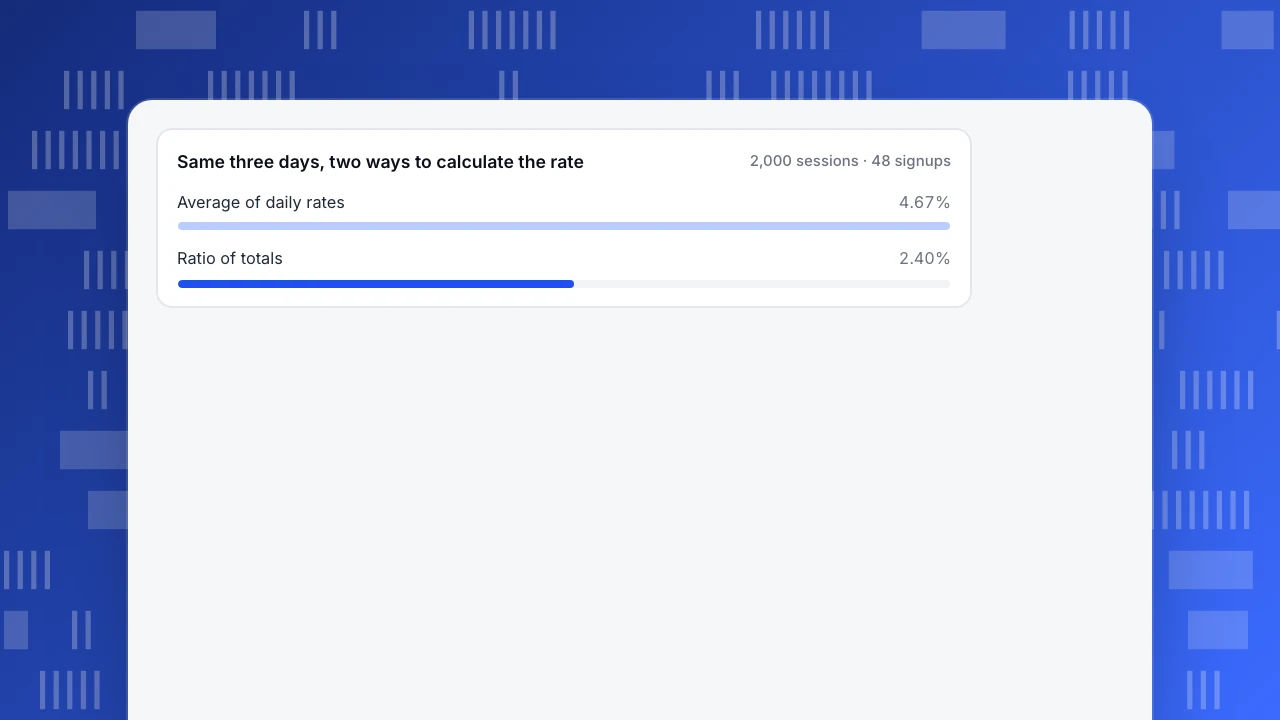
- Average of the daily rates: (10.0% + 2.0% + 2.0%) ÷ 3 = 4.67%
- Ratio of the totals: 48 ÷ 2,000 = 2.40%
The first number counts a quiet day with 100 sessions as much as a busy day with 1,000, so it is almost twice the real rate. When a metric is a ratio, add numerator and denominator over the whole period first and divide once.
Same three days, two ways to calculate the rate
2,000 sessions · 48 signupsWhat other pitfalls break a metric?
| Pitfall | Example | Fix |
|---|---|---|
| Mismatched denominators | Signups this month ÷ visitors last month: 1,000 ÷ 22,000 = 4.5% vs the correct 1,000 ÷ 25,000 = 4.0% | Use the same window and population on both sides |
| Mixed identities | Numerator counts people, denominator counts sessions | State the identity and use it on both sides |
| Cohort vs period confusion | "Signups who activated" counts activations that happen later | Define a window ("within 7 days") and wait until it closes |
| Small numbers | 3 of 10 and 300 of 1,000 are both 30% | Show the count and a minimum sample before acting |
| Gaming | Rewarding "tickets closed" makes people close tickets | Pair a volume metric with a quality metric, such as reopen rate |
| Too many metrics | 40 custom metrics, none checked | Keep a short list; retire a metric nobody has used in a quarter |
The mismatched-window case is easy to miss because the number looks plausible: 4.5% against 4.0% is a 0.5-point gap that could easily be mistaken for real growth.
How do you test a metric before you trust it?
Run five checks on the sample month before the metric goes on a dashboard:
- Hand check. Recompute the number from raw counts for one short period. If the metric says 40.0% and your count says 400 ÷ 1,000, it is right; if it says 38%, find out why before anyone else sees it.
- Zero denominator. Decide what the metric shows on a day with no signups: blank, not 0%. A 0% on a quiet day looks like a collapse.
- Parts add up. Split by channel or device and check that the numerators add up to the total. If revenue per visitor by channel does not reconcile with the overall figure, a filter or identity differs between the two.
- Direction test. Change one input in a spreadsheet (add 100 signups) and check the metric moves the way you expect.
- Name and owner. Put the formula in the metric's description so the next person does not have to guess, and name one owner.
A metric that passes all five is ready; one that fails any should stay out of weekly reviews until fixed.
What do tools limit about custom metrics?
Every tool has rules about what a formula can reference. Google Analytics 4, for example, lets you build calculated metrics from predefined and custom metrics, with +, −, ×, ÷ and parentheses, up to 1,024 characters, but you cannot reference another calculated metric, and a standard property can have 5. Those limits shape how you design: build the building blocks first, then combine them once.
Check before you design: can a formula reference another formula, how many metrics you can save, whether the metric is available through the API and whether a metric can carry its own filters.
How do you define a custom metric in TapCub?
Use the seven-field definition above and the sample month as a test.
- Open All-platform analytics › Behavior › Metrics & SQL. A metric is a built-in, an event plus an aggregation, or a formula. Event aggregations include total, uniques, average per subject, active percent, sessions, first time, and property sum, average, median, 90th percentile, distinct count, min and max.
- Build the building blocks: for example, uniques of
signupand uniques ofkey_action, each saved as a metric. A saved metric can carry its own filters and its own identity; leave identity empty and it follows the analysis that uses it. Choose the format: number, percent, duration or currency. - Add a formula. It is arithmetic and constants with
TOTALS,UNIQUES,AVERAGE,ACTIVE,PROPSUM,PROPAVG, or{id}for a saved metric. A formula can reference only saved metrics that are not formulas, so save the parts first, then divide: activation rate ={key_action_uniques} / {signup_uniques}. - Check the preview. The editor shows the last 28 days as a trend before you save. Compare it with your hand calculation on a short period; if they differ, check identity and filters first.
- Use it. An analysis holds at most 12 measurements and a saved metric takes one slot. If you delete a metric that analyses still use, TapCub asks for confirmation, because forcing it breaks them. To be told when it moves, create a monitor under All-platform analytics › Operations › Monitors; monitors can use a saved custom metric. For a cross-tab the built-in models do not give you, the SQL tab runs one
SELECTover the project's event, session and person views.
TapCub does not decide which metrics matter. The decision, the threshold and the owner stay on your side of the definition.
FAQ
What are custom metrics?
Custom metrics are measurements you define from your own events, either as an event plus an aggregation (for example, unique people who did signup) or as a formula that combines other metrics (activated ÷ signups). They exist because built-in metrics rarely match your questions.
How do you create a custom metric?
Write the definition first: numerator, denominator, identity, window, filters and the decision it supports. Then build it from saved parts and a formula, check the result against a hand calculation on a short period, and share it with one owner.
What is the difference between a custom metric and a KPI?
A custom metric is any number you define. A KPI is a metric you have chosen to run the business by, with a target and an owner. Most custom metrics should stay supporting numbers; only the few that change decisions become KPIs.
Why do my custom metric numbers not match another report?
Usually because of a different denominator, identity (people, devices or sessions), time window or filter, or because one report averages daily rates while the other divides totals. Compare each of the seven definition fields.
How many custom metrics should I have?
Fewer than you think. Keep the ones that each change a decision, show the count beside each rate, and retire a metric no one has opened in a quarter.
Sources
- Rodden, Hutchinson and Fu, Measuring the User Experience on a Large Scale: User-Centered Metrics for Web Applications, CHI 2010 (the HEART framework and a process for mapping goals to metrics). Checked 2026-11-21.
- Google, Create calculated metrics, Analytics Help: formula syntax, 1,024-character limit, 5 per standard property, no references to other calculated metrics. Checked 2026-11-21.
Was this article helpful?
We use your answers to fix and expand this page.
Couldn’t send. Please try again in a minute.
Thanks for the feedback. We’ll use it to improve this page.You’ve already sent feedback on this page. Thanks.

Product Experience Specialist
Writes about product experience, practical workflows, and growth, turning complex processes into clear steps for everyday decisions.