Try it on your own data
Every report in this article is in the free plan. One snippet for web and apps, up to 10 sites.
Start freeContent analytics measures how people find, read and act on your published content. This guide covers the metrics that show a piece works, how to keep bots and AI crawlers out of reader numbers, a 20-minute weekly review, a worked update-merge-retire example and how to catch decay.
What you will learn
- Judge content on engaged reach, source quality, returning readers and assisted conversions, not page views.
- Report bots separately so reach and rates reflect people; treat AI crawler reads and AI-referred visitors as different things.
- Review weekly in 20 minutes (pages, sources, search and decay, one close look) and decide to update, merge or retire from numbers.
What is content analytics?
Content analytics is the measurement of how people find, read and act on your published content: articles, guides, landing pages, help pages. It answers a different question from a traffic report. Traffic says how many visits arrived; content analytics says which pieces earn attention, which bring in the right readers, and which have quietly stopped working.
The term is used loosely. Parse.ly's glossary entry frames it as the measurement of visitor traffic and engagement with published content, and contrasts it with web analytics that only covers the site itself. It names pageviews, engaged time, conversions and acquisition sources as core metrics (a vendor definition, read 2026-11-21). In enterprise software the same words can also mean text mining of documents, which is not what this guide covers. Here it means the everyday work of a publisher, blog owner or marketing team: deciding what to write next, what to update, and what to retire.
Most of that work does not need a new tool. It needs better questions and a clean data set. This guide covers the metrics that actually separate content that works from content that merely gets opened, how to keep bots and AI crawlers out of your reader numbers, a 20-minute weekly review, a worked example with sample data, and how to spot decay early. For the per-article scorecard in more depth, see our guide to content performance metrics; this article is the wider routine around it.
Which content metrics tell you a piece works?
Page views are the weakest answer. A view records that a page loaded, not that anyone read it. Ask instead four questions in order: was it reached, was it read, did it lead anywhere, and does it keep working.
Engaged reach (was it read?). Scroll depth is the closest cheap proxy for reading. Nielsen Norman Group's 2018 eye-tracking study found that people spent 57% of their viewing time above the fold, 17% on the second screenful and the remaining 26% across everything below (NN/G). In their 2010 study the above-the-fold share was 80%, so people scroll more than they used to, but attention still falls steeply. Earlier NN/G analysis of 2005 browsing data estimated that visitors have time to read at most 28% of the words on an average page (NN/G, data published 2008). The practical reading: the share of visitors who reach 80% of a page is more telling than the average time on it. Average time is also fragile. Plausible's metric definitions note that time on page is sent when a visitor navigates away or switches tabs, and that bounced visits are included.
Entry and exit (where did it sit in the journey?). An entry page is where a session starts; an exit page is where it ends. A guide with many entries and a high exit rate is doing its job as a standalone answer if the reader got what they needed, and failing if the page should have led to a next step. Judge it against its purpose, not against a site-wide average.
Source quality (who sent them?). Compare content by the readers it attracts, not just the volume. Search readers, newsletter readers, social visitors and people sent by AI assistants behave differently. Split each article by channel before comparing conversion or scroll rates.
Returning readers. A piece that brings people back, or that returning readers choose, is building an audience. Compare new and returning visitors per piece rather than looking at the site total.
Assisted conversions (did it lead anywhere?). For a blog the sign-up rarely happens on the first page. Count sessions that read the piece and later hit a goal, such as a sign-up, a subscription or a contact request, and treat the piece as an assist, not only as a last click.
| Metric | What it tells you | Common trap |
|---|---|---|
| Reach to 80% of the page | Whether people read, not just open | Only meaningful with enough views and when the page length is similar |
| Bounce rate | Single-page visits | For articles, a satisfied one-page reader counts as a bounce |
| Engaged rate | Sessions with 10 seconds or 2 pages, or a key event | Thresholds differ between tools; read the definition first |
| Entry sessions | Which pages start journeys | Counts landing, not quality of the visit |
| Source mix | Which channel the readers came from | Averages hide that one channel carries the page |
| New vs returning | Whether the piece builds an audience | Needs a stable visitor ID, not strict daily rotation |
| Goal conversion per piece | Whether reading led to action | Credit goes to the last page unless you look at paths |
| Metric | What it tells you | Common trap |
|---|---|---|
| Reach to 80% of the page | Whether people read, not just open | Needs enough views and similar page length |
| Bounce rate | Single-page visits | For articles, a satisfied one-page reader counts as a bounce |
| Engaged rate | Sessions with 10 seconds or 2 pages, or a key event | Thresholds differ between tools; read the definition first |
| Entry sessions | Which pages start journeys | Counts landing, not quality of the visit |
| Source mix | Which channel the readers came from | Averages hide a page carried by one channel |
| New vs returning | Whether the piece builds an audience | Needs a stable visitor ID, not strict daily rotation |
| Goal conversion per piece | Whether reading led to action | Credit goes to the last page unless you look at paths |
Read every metric against what the piece is for, and on human readers only.
How do you keep bots and AI crawlers out of your content numbers?
Content is exactly what bots read. Search-engine crawlers, AI crawlers and scrapers all fetch articles, so a content report that mixes them with people overstates reach and understates every rate. Detection and reporting both matter here, and the bots and AI crawlers help guide covers the mechanics.
Keep two rules. First, report bots separately rather than deleting them: the crawl data is useful on its own, because it shows which pieces search engines and AI products fetch, and it lets you audit a wrong classification. Second, never mix up the two AI audiences. An AI crawler that reads your article is a bot. A person who clicks a link inside an AI assistant answer and lands on your article is a visitor, and that visit is a source worth tracking as its own channel. A piece can be crawled heavily and send nobody back; the reverse also happens.
The effect on content decisions can be large, which the worked example below shows.
What does a 20-minute weekly content review look like?
A review that happens every week beats a deep analysis that happens once a quarter. Keep it to three reports and one close look, in a fixed order, with the same date range each time (last full week against the previous one, plus a 28-day view for slow movers).
- Pages (5 minutes). Sort by pageviews and by period change. Note the three biggest risers and fallers. Check the entry-page tab for pieces that start sessions, and the 404 tab for broken links pointing at your content. Ignore anything with a tiny base: a page that moved from 4 to 12 views is noise.
- Sources (5 minutes). Look at channels for the same pieces. Did search drop while newsletter held? Did an AI assistant start sending visitors to one guide? New referrers are leads for distribution, not only for reporting.
- Search performance and decay (5 minutes). Open the search view for pages in the top ten positions whose click-through rate is below the median: a better title and description often pays back first. Then check the decay list for pieces that have fallen from their peak.
- One close look (5 minutes). Pick one piece from the above and open its click and scroll view. Where do readers stop? Which link do they click? Write one change for the week.
End by writing down two things: one piece to update this week, and one to leave alone. The discipline of leaving things alone prevents editing for the sake of editing. A saved note, a ticket, or a scheduled weekly report that lands in the team channel keeps the habit going.
How do you decide what to update, merge or retire?
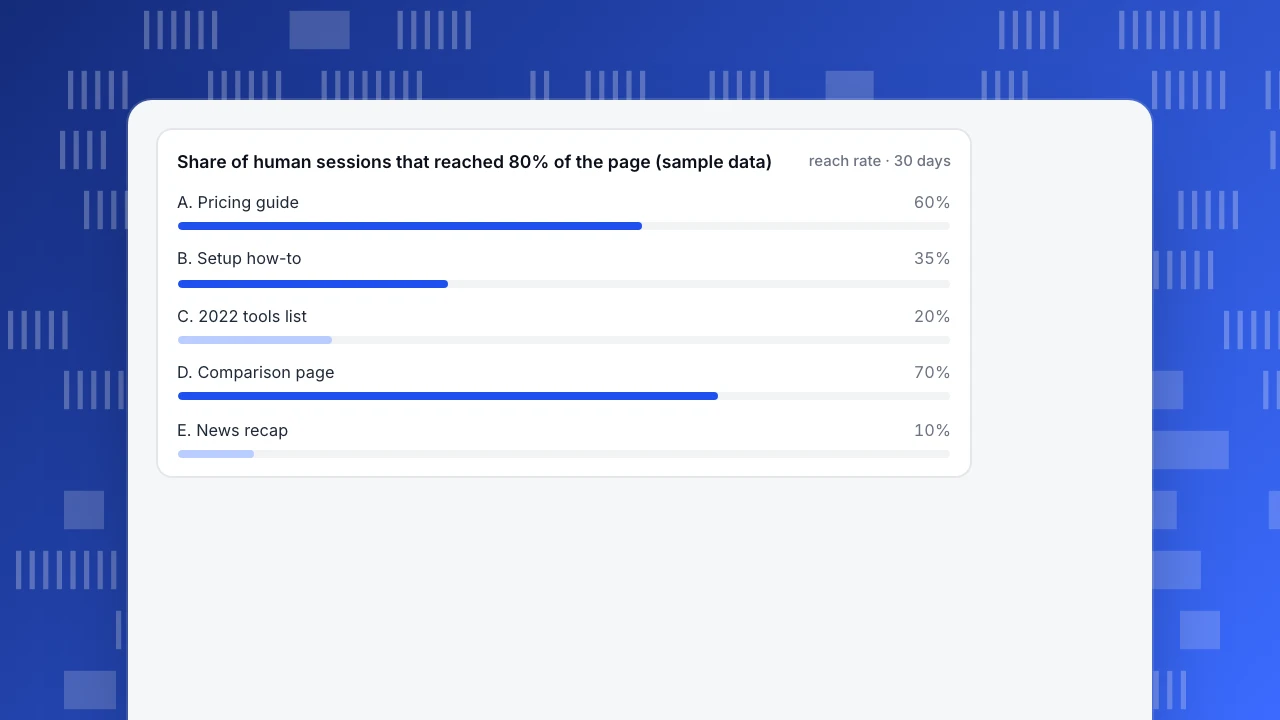
Here is a worked example with sample data, not a real site. A blog reviews five articles over 30 days. Each has human sessions (bots removed), the share of those sessions that reached 80% of the page, and sign-ups that followed a read of the piece.
| Article | Human sessions | Reached 80% | Reach rate | Sign-ups | Conversion |
|---|---|---|---|---|---|
| A. Pricing guide | 2,000 | 1,200 | 60% | 60 | 3.0% |
| B. Setup how-to | 4,000 | 1,400 | 35% | 40 | 1.0% |
| C. 2022 tools list | 3,000 | 600 | 20% | 15 | 0.5% |
| D. Comparison page | 800 | 560 | 70% | 48 | 6.0% |
| E. News recap | 1,200 | 120 | 10% | 0 | 0% |
| Total | 11,000 | 3,880 | 163 | 1.48% |
Recompute any row: 1,200 / 2,000 = 60%; 60 / 2,000 = 3.0%; 48 / 800 = 6.0%; across the table, 163 / 11,000 = 1.48%.
Now see what the unfiltered report said. It showed 12,500 sessions, because 1,500 extra sessions on article C were bots. On raw sessions, C looked like the biggest article at 4,500, ahead of B at 4,000, and its conversion read 15 / 4,500 = 0.33%. Once bots are separated, C has 3,000 human sessions, B is the largest piece, and C's conversion is 15 / 3,000 = 0.5%. The ranking changed, and with it the priorities.
Decisions from the sample, each tied to a number:
- D, comparison page: promote. Smallest traffic, best reach (70%) and conversion (6.0%). It is under-linked, not under-performing. Add internal links from A and B and make it easier to find from search.
- A, pricing guide: keep. Healthy on both counts. Check it for staleness on a schedule instead of editing it.
- B, setup how-to: update. The most human readers but only 35% reach 80% and 1.0% convert. The audience is there; the page loses people. Tighten the intro, check where the scroll drops, and move the sign-up prompt to where readers stop.
- C, 2022 tools list: merge. 20% reach and 0.5% conversion on a dated list. Fold the useful parts into B or A, redirect the old address, and stop treating it as a traffic asset.
- E, news recap: retire or redirect. 10% reach and no sign-ups. If it has no search or referral value, redirect it to the nearest evergreen piece.
One caution on retiring content. Google's guidance on helpful content says not to remove a lot of older content only because you believe it will help rankings, and not to change page dates to make content look fresh when it has not substantially changed. So merge and redirect on evidence, and update dates only when the piece actually changed.
Share of human sessions that reached 80% of the page (sample data)
reach rate · 30 daysHow do you spot content decay early?
Decay is a slow slide, so a week-on-week comparison misses it. Compare two windows of the same length from a longer history: the average of a page's best weeks against the average of its latest weeks. A page that now earns well under its peak, and has trended down the whole way, is decaying. Then check whether only one channel fell. A drop in search alone points to ranking or competition, a drop across every channel points to the page or topic itself.
Treat the result as a shortlist, not a verdict. Small pages produce wild percentages, so require a minimum number of visitors before a page is eligible. And when a page is on the list, ask whether the facts, screenshots or links are out of date before touching the headline.
How does TapCub support content analytics?
TapCub covers this routine inside its web analytics. All menu names below are from the product documentation, checked 2026-11-21.
- Pages (
Web analytics › Pages). Visited, entry, exit, hostname and 404 tabs, with average time, bounce rate, period change and downstream pageviews. Click a row to filter by path, then open the click map for that path. - Click and scroll maps (
All-platform analytics › Behavior › Heatmaps). Clicks, rage clicks and scroll depth per page; each scroll row is the share of visits that reached that depth or further. Scroll depth is switched on in autocapture, which needs the Pro plan or higher. - Sources (
Web analytics › Sources). Channels, referrers, search engines, UTM, search terms and an AI sources tab. AI sources counts human sessions that arrived from an AI product, separate from crawler reads. - Search performance (
Monitoring › Search performance). Clicks, impressions, click-through rate and average position by page, query and country, after you connect Google Search Console or Bing Webmaster. This is its own page, next to the reports above rather than on the same screen. Without a connected account it shows no clicks or impressions, which is not the same as zero traffic. - Content decay (
Monitoring › Content decay). Compares the mean of the peak four weeks with the latest four weeks inside a 13-week window. A latest mean under 70% of the peak with a downward slope is decaying; under 40% is severely decaying. The default channel is organic search, and you can switch to all channels or AI sources. - Bots (
Web analytics › Bots). Recognised bots are reported separately and, by default, do not inflate human visitors, sessions or pageviews. Detection is not perfect and misclassifications can be marked as human. The page script only sees bots that run JavaScript. - Sharing and scheduled reports. A read-only public link can expose overview, pages, sources, audience and bots, with optional password, so editors can see pages and sources without a login. A weekly scheduled report (Configuration › Settings › Notifications, on plans that include it) sends to email or team chat on Monday.
For publishers there is a content solution with completion, subscribe and bot views: see analytics for content and media. If you are starting from the basics, website traffic analysis, referral traffic and the web analytics report cover the underlying reports, and how to read a heatmap covers the click and scroll maps. The product overview is on the analytics page.
FAQ
What is content analytics?
Content analytics is the measurement of how people find, read and act on published content. It looks past page views to engaged reach, source quality, returning readers and what readers do afterwards, so a team can decide what to update, merge or retire.
What is the difference between content analytics and web analytics?
Web analytics reports on the whole site: visitors, sessions, sources. Content analytics uses the same data but groups it by piece, author or topic and judges each against its purpose. Parse.ly's definition also extends content analytics beyond the website to apps and other channels.
Which metrics matter most for blog analytics?
Scroll reach, source mix, returning readers and conversions per piece, read with a human-only audience. Bounce rate alone is misleading for blogs, because a reader who finds the answer on one page counts as a bounce.
How often should I review content performance?
Weekly for a short review of movers and sources, monthly for decay and update decisions. Use the same date range every time so changes are comparable.
How do I tell human readers from bots in content reports?
Use a tool that classifies bots and reports them separately, then check spikes against your campaigns. Verify claimed search crawlers with reverse DNS, and read AI crawler reads and AI-referred visitors as two different things.
Do I need a separate content analytics tool?
Not for most teams. A web analytics tool with page, source, scroll and search views covers the weekly routine. A dedicated tool helps when you have several editorial products, many authors or need content-level data from apps and podcasts.
See also: Bot Traffic: How to Detect, Filter and Report It; AI Referral Traffic: How to Spot and Measure It
Sources
- Parse.ly. Content analytics glossary — definition as measurement of traffic and engagement with published content, beyond the website itself; lists pageviews, engaged time, conversions and acquisition sources. Vendor page, no figures. Read 2026-11-21.
- Nielsen Norman Group (2018). Scrolling and attention — 57% of viewing time above the fold, 17% on the second screenful, 26% below; 80% above the fold in the 2010 study. Read 2026-11-21.
- Nielsen Norman Group. How little do users read? — estimate of at most 28% of words read on an average page, from 2005 data of 25 users published in 2008. Read 2026-11-21.
- Plausible Analytics. Metrics definitions — bounce, scroll depth as an average, and time on page sent when a visitor navigates or switches tabs. Read 2026-11-21.
- Google Search Central. Creating helpful, reliable, people-first content — do not remove older content only to help rankings; do not change dates to look fresh. Read 2026-11-21.
Was this article helpful?
We use your answers to fix and expand this page.
Couldn’t send. Please try again in a minute.
Thanks for the feedback. We’ll use it to improve this page.You’ve already sent feedback on this page. Thanks.

Product Experience Specialist
Explores usability, user journeys, and feature adoption through practical examples of onboarding and everyday product use.