Try it on your own data
Every report in this article is in the free plan. One snippet for web and apps, up to 10 sites.
Start freeCheckout funnel analysis finds the step where orders disappear, for which shoppers, and how many orders each gap is worth. List the steps as completed actions, calculate the rate and shoppers lost at each, split by device, test that the gap is real, then rank fixes by extra orders, not by how bad the chart looks.
What you will learn
- Count completed actions (shipping added, payment added), and write down the unit, window and exclusions first
- Split the weak step by device and entry, then check the gap with a z-test before acting (|z| above 1.96)
- Rank fixes by extra orders: in the sample, matching desktop at payment is worth +239 orders a month on mobile
What a checkout funnel analysis answers
A checkout funnel analysis answers one question: at which step, for which shoppers, do orders disappear, and how many orders is each gap worth? The chart is only the first half. The second half is a ranked list of gaps with a number of orders attached to each, so you know what to fix first.
It is narrower than a general funnel review. It starts when a shopper has a cart and stops at the order confirmation. Why shoppers leave (surprise costs, forced accounts, declined cards) is covered on how to reduce checkout abandonment; the tool comparison is on funnel analytics tools. This article is the procedure in between: five steps, one worked example, one significance check.
Define the steps and the counting rule
Write the steps as events that fire when the shopper completes something, not when a page loads. Google's GA4 ecommerce documentation recommends this sequence for a checkout: view_cart, begin_checkout, add_shipping_info, add_payment_info, purchase. The shipping event carries a shipping_tier (such as Ground or Next-day), the payment event carries a payment_type, and purchase carries a transaction_id. If your store already sends those names, reuse them; if it does not, page paths such as /checkout/shipping work as steps too.
Then fix four counting rules and write them down, because they change every number below:
- Unit. People or sessions. People over a window treats Monday's abandoned cart that is paid on Wednesday as a success; sessions counts Monday as a loss.
- Window. How long after the first step a purchase still counts. Seven days is a common default for retail; use the length of your real buying cycle.
- Order. Strict (nothing between steps), ordered (other events allowed between) or any order. Checkout steps are normally ordered.
- Exclusions. Remove test orders, internal traffic and known bots first, or the top of the funnel is inflated.
Calculate step conversion and orders lost
For each step you need three numbers: how many reached it, the rate from the previous step, and the orders lost at that step (previous count minus this count).
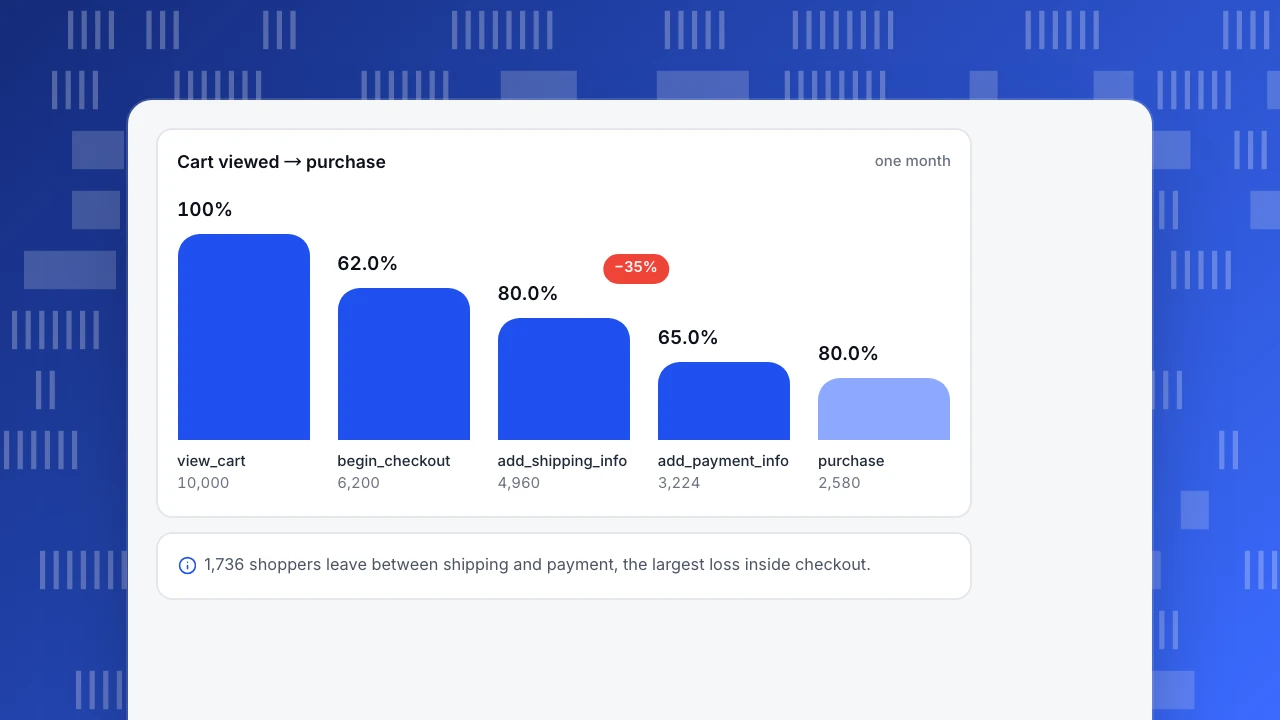
Sample data: 10,000 sessions viewed the cart in one month.
| Step | Reached | Rate from previous step | Lost at this step | Rate from the cart |
|---|---|---|---|---|
view_cart | 10,000 | — | — | 100% |
begin_checkout | 6,200 | 62.0% | 3,800 | 62.0% |
add_shipping_info | 4,960 | 80.0% | 1,240 | 49.6% |
add_payment_info | 3,224 | 65.0% | 1,736 | 32.2% |
purchase | 2,580 | 80.0% | 644 | 25.8% |
Recalculate one row to check the method: 3,224 ÷ 4,960 = 65.0%, and 4,960 − 3,224 = 1,736 shoppers lost. Cart-to-purchase is 2,580 ÷ 10,000 = 25.8%.
Two readings matter here:
- The biggest absolute loss, 3,800, is between the cart and checkout. That is cart behaviour (browsing, price checking), not checkout friction, so do not fold it into checkout work.
- Inside checkout, the step with the lowest rate is payment: only 65.0% of shoppers who entered shipping details went on to submit payment. That is 1,736 people, the largest loss after the cart.
An overall rate cannot tell you that. A single number, 25.8%, hides a payment step that is weaker than every other step.
Cart viewed → purchase
one monthview_cart
10,000
begin_checkout
6,200
add_shipping_info
4,960
add_payment_info
3,224
purchase
2,580
Split the funnel by device and entry before you fix anything
A weak step is a symptom. The next question is who is weak. Split the same funnel by the dimensions that change checkout behaviour: device, new vs returning customer, guest vs logged in, country, payment method.
Sample data: the same month split by device.
| Step | Mobile | Rate from previous | Desktop | Rate from previous |
|---|---|---|---|---|
begin_checkout | 3,720 | — | 2,480 | — |
add_shipping_info | 2,790 | 75.0% | 2,170 | 87.5% |
add_payment_info | 1,674 | 60.0% | 1,550 | 71.4% |
purchase | 1,256 | 75.0% | 1,324 | 85.4% |
The totals match the first table (3,720 + 2,480 = 6,200; 1,256 + 1,324 = 2,580), so the split is consistent. Mobile checkout converts 1,256 ÷ 3,720 = 33.8% of the way from begin_checkout to purchase; desktop converts 1,324 ÷ 2,480 = 53.4%. Mobile is worse at every step, and the widest gap is at payment (60.0% vs 71.4%).
Also split by entry: the channel or campaign that brought the shopper. A step that looks weak overall can be a single campaign sending people who were never going to buy.
| Step | Mobile rate from previous | Desktop rate from previous |
|---|---|---|
| Shipping info added | 75.0% | 87.5% |
| Payment info added | 60.0% | 71.4% |
| Purchase | 75.0% | 85.4% |
| Begin checkout → purchase | 33.8% | 53.4% |
Sample data: one month, 3,720 mobile and 2,480 desktop checkouts started.
Check that a gap is real before you act on it
Segments are smaller than the total, so some gaps are noise. Use a two-proportion z-test. The statistic is the difference between the two rates divided by its standard error, using the pooled rate (the NIST/SEMATECH e-Handbook gives the formula):
z = (p1 − p2) ÷ √( p × (1 − p) × (1/n1 + 1/n2) ), where p = (x1 + x2) ÷ (n1 + n2)
Sample data: payment step, mobile 1,674 of 2,790 (60.0%) against desktop 1,550 of 2,170 (71.4%).
- Pooled rate p = (1,674 + 1,550) ÷ (2,790 + 2,170) = 3,224 ÷ 4,960 = 65.0%
- Standard error = √(0.65 × 0.35 × (1/2,790 + 1/2,170)) = 0.0136
- z = (0.600 − 0.714) ÷ 0.0136 = −8.4
A |z| above 1.96 is significant at the usual 5% level, so this gap is real. If a segment had 40 shoppers, the same percentage gap would give a |z| well under 1.96 and you would wait for more data. The statistic itself is explained on the test statistic page.
Turn the gaps into a fix list measured in orders
Rank gaps by the orders you would gain if the weak segment matched the strong one at that step, with every other step unchanged. Using the mobile and desktop rates above:
| If mobile matched desktop at… | Calculation | Extra orders per month |
|---|---|---|
| Shipping step (87.5%) | 3,720 × 87.5% × 60.0% × 75.0% − 1,256 | +209 |
| Payment step (71.4%) | 2,790 × 71.4% × 75.0% − 1,256 | +239 |
| Final step (85.4%) | 1,674 × 85.4% − 1,256 | +174 |
| All three | 3,720 × 53.4% − 1,256 | +730 |
The three gains do not add to 730 (209 + 239 + 174 = 622) because the steps compound: fixing one raises the base the next step works on. Use the single-step numbers to rank, and the combined number as the ceiling.
The payment step comes first, at +239 orders. That is a number you can compare with the cost of the work: if one order is worth 60 in margin, 239 orders is about 14,340 a month. The last step (+174) is often a technical problem such as errors or declined cards, so check it for bugs before redesigning anything.
Check that the funnel is not lying
Before you ship a fix, rule out measurement problems that look like drop-off:
- Missing events. If
add_payment_infofires only for card payments, shoppers who pay with a wallet look like abandoners. Compare the funnel's purchases with your order system for the same dates; a gap above a few percent means an event is missing. - Duplicate purchases. A reloaded confirmation page can fire
purchasetwice. De-duplicate ontransaction_id. - Redirects to a payment provider. The session or referrer can break when shoppers leave your domain and return. Check that the return page carries the same visitor.
- Bots. Automated traffic enters the cart and never pays. Count real visitors only.
- Window too short. A 30-minute window turns a shopper who pays after lunch into an abandoner.
Run this analysis in TapCub
Take the mobile payment gap from the example and follow it through.
- Build the funnel. In All-platform analytics › Behavior › Behavior analysis, choose the funnel view and add steps as event names or page paths (2 to 20 steps). Set the window (default 7 days, up to 180) and keep counting on unique. Add up to five exclusion events, for example a cancel-order event.
- Read the result. Each step shows count, rate against step one, rate against the previous step, drop-off and median time from the previous step. The largest drop is marked. Click a step to open the people who dropped there.
- Split by device. Use the breakdown on the first layer (it keeps the 10 groups with the most entries). The funnel has no compare-period option, so run it twice with two date ranges to compare before and after a fix.
- Look for errors. Monitoring › Errors lists error groups with sessions affected. A monitor on
error_ratein All-platform analytics › Operations › Monitors tells you when it spikes; it only notifies. - Watch a few sessions. Session replay is off by default; when an admin turns it on, inputs are masked and the card-entry step should be on the excluded paths.
TapCub measures the funnel; it does not run A/B tests or change your checkout. Make the fix in your store, then run the same funnel for the next period.
FAQ
What is checkout funnel analysis?
It is the practice of charting each step from cart to confirmed order, finding where shoppers leave, splitting that loss by segment such as device, and estimating how many orders each gap is worth. The output is a ranked fix list, not just a chart.
What are the steps in a checkout funnel?
A common sequence is view cart, begin checkout, add shipping information, add payment information and purchase. Google's GA4 ecommerce documentation recommends events with those names. Add or remove steps to match your real checkout, but keep each step an action the shopper completes.
How do you calculate drop-off at a checkout step?
Drop-off is the previous step's count minus this step's count, and the step rate is this count divided by the previous one. In the example, 4,960 shoppers added shipping and 3,224 added payment: 3,224 ÷ 4,960 = 65.0%, so 1,736 were lost.
Why is my checkout drop-off higher on mobile?
It often is: in the sample, mobile completes 33.8% of checkouts against 53.4% on desktop. Typical causes are long forms, wallets not offered, keyboards covering fields and slow payment pages. Split the funnel by step on mobile to see which one it is, then check errors for the same segment.
Which checkout step should I fix first?
Fix the step with the most extra orders if the weak segment matched the strong one, after checking the gap is statistically real and the data is not missing events. In the example that is the payment step on mobile, worth about 239 orders a month.
Sources
- Google, Measure ecommerce (GA4 events): recommended checkout events and parameters. Checked 2026-11-21.
- NIST/SEMATECH e-Handbook of Statistical Methods, Comparing two proportions: pooled z-test statistic and decision rule. Checked 2026-11-21.
- Baymard Institute, Cart Abandonment Rate Statistics: 70.22% average cart abandonment across 50 studies; US checkout reasons. Checked 2026-11-21.
Was this article helpful?
We use your answers to fix and expand this page.
Couldn’t send. Please try again in a minute.
Thanks for the feedback. We’ll use it to improve this page.You’ve already sent feedback on this page. Thanks.

Customer Experience Consultant
Writes about live chat, visitor conversations, and self-service, sharing practical ways to make customer communication clearer and more effective.