Try it on your own data
Every report in this article is in the free plan. One snippet for web and apps, up to 10 sites.
Start freeTo calculate retention rate, divide the people you still have from the original group by the size of that group: (customers at end − new customers) ÷ customers at start for a period, or members active on day N ÷ cohort size for a cohort. The same users can score 19%, 31% or 45% depending on whether you count exact-day, rolling or any activity.
What you will learn
- Customer retention = (end − new) ÷ start; a result above 100% means new customers are still in the number
- Weight cohort tables by size: 37.9% for all three sample cohorts, not the 38.3% plain average
- One 800-install cohort scores 19.0%, 31.0% or 45.0% at day 7 depending on the definition, so state which you use
The two formulas people mean by "retention rate"
"Retention rate" is used for two different calculations, and mixing them is the most common reason two reports disagree.
Customer retention over a period (subscriptions, accounts, clients):
Retention rate = (customers at end − new customers acquired) ÷ customers at start × 100
Subtracting the new customers removes everyone who did not exist at the start, so only the original group is measured.
Cohort retention (users, installs, signups):
Retention rate on day N = cohort members active on day N ÷ cohort size × 100
Here the group is fixed on the day people first appear, and you measure the same people again later.
Sample data for the first formula: a subscription business starts the month with 1,200 customers, adds 260 and loses 84, all of them from the original 1,200. It ends with 1,200 + 260 − 84 = 1,376.
- Retention = (1,376 − 260) ÷ 1,200 = 93.0%
- Churn = 1 − 0.930 = 7.0% (84 ÷ 1,200)
- If you forget to subtract the new customers: 1,376 ÷ 1,200 = 114.7%, which is not a retention rate at all, because a retention rate cannot exceed 100%.
The result is a sanity check you can run on any dashboard: if the number goes above 100%, new customers are inside it.
How to calculate retention for a cohort
A cohort is a group of users who share a start moment, usually the day, week or month they first appeared. Google Analytics describes it the same way: its retention report builds cohorts from the day a user was acquired. Follow these steps.
- Pick the start event (first visit, signup, install, first purchase).
- Group people by the period they started in.
- Pick the return event. "Any activity" is the loosest; "opened the app" or "placed an order" is stricter.
- For each cohort, count how many of its members did the return event in week 1, week 2 and so on.
- Divide each count by the cohort size.
Sample data: three weekly signup cohorts and how many came back each week.
| Cohort | Size | Week 1 | Week 2 | Week 3 | Week 4 |
|---|---|---|---|---|---|
| Jan 6 | 1,000 | 380 (38.0%) | 270 (27.0%) | 215 (21.5%) | 190 (19.0%) |
| Jan 13 | 800 | 336 (42.0%) | 232 (29.0%) | 184 (23.0%) | 152 (19.0%) |
| Jan 20 | 1,200 | 420 (35.0%) | 300 (25.0%) | 228 (19.0%) | 192 (16.0%) |
| All cohorts | 3,000 | 1,136 (37.9%) | 802 (26.7%) | 627 (20.9%) | 534 (17.8%) |
The bottom row is weighted by cohort size: 1,136 ÷ 3,000, not the average of 38.0%, 42.0% and 35.0% (which would be 38.3%). The unweighted average over-counts small cohorts.
Read the table in two directions. Down a column you see whether newer cohorts do better or worse at the same age: the Jan 20 cohort is 7 points below Jan 13 at week 1, which is the first thing to investigate (a new traffic source, a changed onboarding step). Across a row you see the shape of the curve: this product loses most people in the first week and then flattens, so the week-1 fix matters most.
Exact-day or rolling or any-activity retention give different numbers
Apple's App Store Connect defines retention as the percentage of devices that installed on a given day and opened the app a set number of days later, which is an exact-day measure. Google Analytics shows Day 1, Day 7 and Day 30 lines in its retention overview, and a retention chart covering the first 42 days. Both are valid; they just answer different questions.
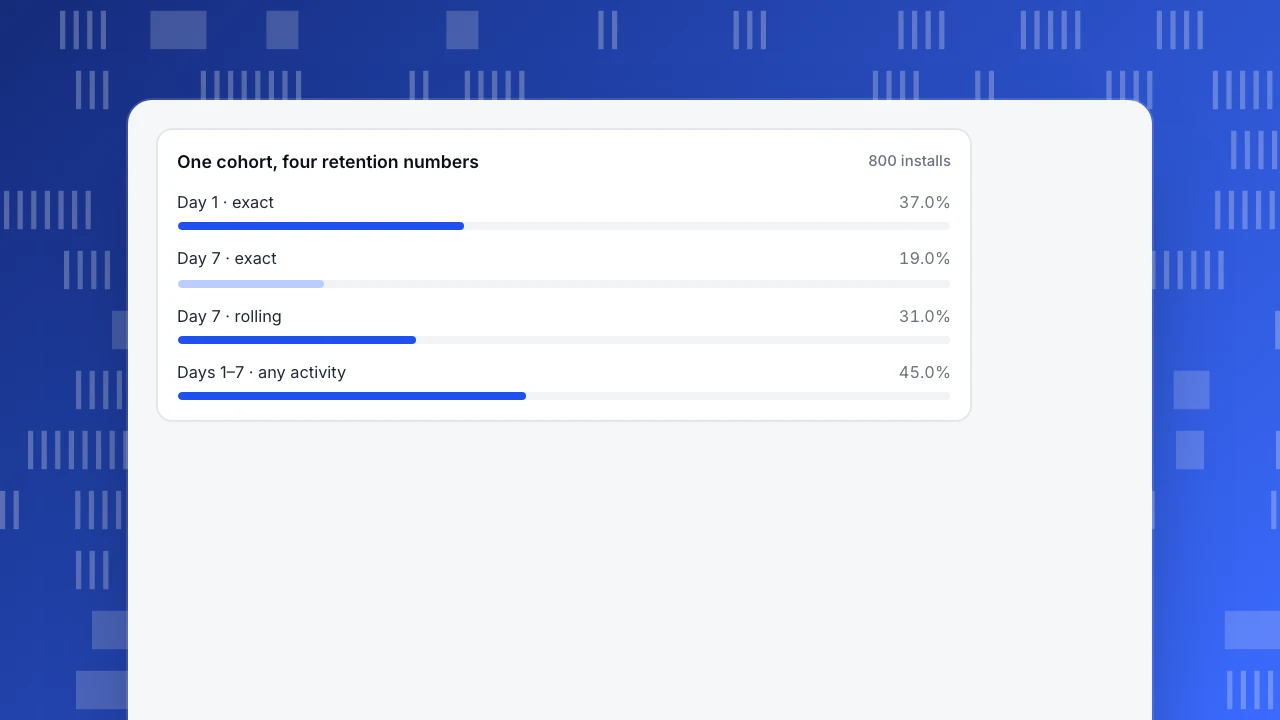
Sample data: one cohort of 800 installs, measured four ways.
| Definition | Who counts | Count | Rate |
|---|---|---|---|
| Day 1, exact | Opened the app on day 1 | 296 | 37.0% |
| Day 7, exact | Opened the app on day 7 | 152 | 19.0% |
| Day 7, rolling | Opened the app on day 7 or any later day | 248 | 31.0% |
| Days 1–7, any | Opened the app at least once on days 1–7 | 360 | 45.0% |
The same 800 people produce 19.0%, 31.0% and 45.0% depending on the definition. Exact-day numbers are the lowest and the noisiest, because someone who skips day 7 but returns on day 8 is a miss. Rolling numbers can only fall over time, so they give a smooth curve. Any-activity numbers measure habit within a window.
Choose by product rhythm. A product used daily (messaging, a game) suits exact-day. A product used weekly (a budgeting tool, an invoicing app) suits a weekly cohort with "active in week N". A product used a few times a year (travel, tax) should use rolling retention over months, or exact-day numbers will look terrible for no reason.
One cohort, four retention numbers
800 installsHow do period length and annualizing change the answer?
Retention depends on how long the period is. 93.0% monthly retention sounds high, but compounded over a year it is 0.93¹² = 41.9%. That is, if the same 7% leave every month, fewer than half of today's customers are left in 12 months. You can only compound like this when monthly churn is stable, and early-life churn is usually higher than later churn, so treat 41.9% as a rough floor for a mature base and not a forecast.
Two practical rules:
- Quote the period next to the number ("93.0% monthly", "19.0% day-7"). A bare "93%" cannot be compared with anything.
- Do not compare a weekly rate with a monthly rate. A product with 97% weekly retention loses 3% a week, which is 0.97⁴ = 88.5% over four weeks, or 11.5% churn a month.
What are the common mistakes?
| Mistake | What it does | Fix |
|---|---|---|
| New customers left in the numerator | Retention above 100%, as in the 114.7% example | Use (end − new) ÷ start |
| Average of cohort percentages | Small cohorts weigh too much; 38.3% instead of 37.9% | Sum counts, then divide |
| Reading an unfinished period as zero | The newest cohort looks like it collapsed | Mark periods that have not ended as not due |
| Mixing definitions in one chart | A rolling Day 7 next to an exact Day 1 | Fix one definition per chart |
| Counting people who never became active | The denominator includes installs that never opened | Decide whether the cohort starts at install or first use, and say which |
| Different identity per period | A person on a phone then a laptop counts as lost | Use one identity (person, not device) for both ends |
The last two are where real teams disagree. Apple excludes installs that were never opened from both the numerator and the denominator of its retention percentage, so the cohort is installers who have ever opened the app, and the denominator can grow after install day. If another report counts every install, its Day 1 will look lower.
Which retention number should you report?
Use this decision rule:
- If the money comes from renewals (subscriptions, contracts), report customer retention per month and, next to it, the cohort table by signup month.
- If the product is free to use and success means coming back, report exact-day retention at days 1, 7 and 30, plus the weekly cohort table.
- If usage is infrequent, report rolling retention over 30, 60 and 90 days.
- Always show the cohort size next to the percentage. A 60% retention on 15 people is not the same fact as 60% on 1,500.
For deeper reading on what counts as good, see retention for the definition and good retention rate for benchmarks. This article is only about getting the calculation right.
| Definition | Who counts | Sample rate (800 installs) |
|---|---|---|
| Day 7, exact | Opened the app on day 7 | 19.0% |
| Day 7, rolling | Opened the app on day 7 or later | 31.0% |
| Days 1–7, any activity | At least one open on days 1–7 | 45.0% |
| Customer retention, monthly | (end − new) ÷ start | 93.0% (separate sample) |
Sample data: the three app rows use one 800-install cohort; the last row is a separate 1,200-customer subscription sample.
How to calculate retention in TapCub
Take the sample cohort table above and rebuild it from your own data.
- Open All-platform analytics › Behavior › Behavior analysis and choose retention. Leave both the start and return events empty to measure "any activity", or set a start event such as signup and a return event such as an order.
- Pick the period (day, week or month) and how many to show. The default is 14 days; the limits are 30 days, or 12 weeks or months.
- Choose the mode. TapCub has three: returned on period N exactly, returned on period N or any later period, and how many periods each person returned. These match the exact-day and rolling definitions above.
- Read the table. Each row is a cohort with its start date, size, and a count and rate per period; a period that has not ended yet is empty, not zero. The line under the table is the size-weighted average rate, so it matches the bottom row of the sample table, not a plain average.
- For apps and mini programs, App analytics › Users › Retention has separate New-user retention and Active retention tabs, with cells that are not due marked as not due. The app definition of next-day retention is the share of new users who start again the next day.
TapCub does not tell you whether a retention number is good; the benchmark pages above and your own earlier cohorts are the comparison. It also does not send win-back messages. It measures who came back, and the segment you build from the people who did not.
FAQ
How do you calculate retention rate?
For a group over a period, divide the customers you still have from the starting group by the customers you started with: (customers at end − new customers) ÷ customers at start × 100. For users, fix a cohort on its start day and divide the members active on day N by the cohort size.
What is the formula for customer retention rate?
Customer retention rate = (E − N) ÷ S × 100, where E is customers at the end of the period, N is customers acquired during it and S is customers at the start. With 1,200 at the start, 260 new and 1,376 at the end, retention is 93.0%.
What is the difference between retention rate and churn rate?
They are complements for the same group and period: churn = 1 − retention. If 93.0% of customers are retained in a month, 7.0% churned. Revenue churn is a separate figure because it weights customers by what they pay.
How do you calculate day 7 retention?
Count the cohort members who were active on day 7 after their start day and divide by the cohort size. In the sample, 152 of 800 installs opened the app on day 7, so exact day-7 retention is 19.0%. If you count anyone active on day 7 or later, the same cohort gives 31.0%.
Can retention rate be over 100%?
Not if it is calculated correctly. Retention measures how much of the original group remains. A value above 100% means new customers were not subtracted, or the denominator excludes people who are in the numerator.
Sources
- Apple, App retention, App Store Connect Analytics Help: retention as the percentage of installers who opened the app a set number of days later; installs never opened are excluded. Checked 2026-11-21.
- Google, Retention overview report, Analytics Help: cohorts defined by acquisition day; Day 1, Day 7 and Day 30 lines; a retention chart over the first 42 days. Checked 2026-11-21.
Was this article helpful?
We use your answers to fix and expand this page.
Couldn’t send. Please try again in a minute.
Thanks for the feedback. We’ll use it to improve this page.You’ve already sent feedback on this page. Thanks.

Product Experience Specialist
Writes about product experience, practical workflows, and growth, turning complex processes into clear steps for everyday decisions.