Try it on your own data
Every report in this article is in the free plan. One snippet for web and apps, up to 10 sites.
Start freeSaaS LTV is average monthly revenue per account times gross margin, divided by monthly churn: $80 × 0.80 ÷ 0.03 = $2,133 in the worked example. The shortcut assumes every customer churns at the same rate. When segments differ, it is off: in a two-segment sample it comes out 36% below the true $2,667. Below: each input, a churn sensitivity table, the cohort gap by horizon and the LTV to CAC check.
What you will learn
- Use gross margin, not revenue: revenue overstates LTV by 25% at an 80% margin
- LTV falls fast as churn rises: 3% to 4% monthly churn cuts $2,133 to $1,600
- Segment before you average: constant churn on a mixed base understated LTV by 36% in the sample
What is the formula for SaaS LTV?
SaaS customer lifetime value is LTV = ARPA × gross margin % ÷ monthly churn rate, where ARPA is average monthly revenue per account. The churn rate does double duty: it also gives the expected customer lifetime, which is 1 ÷ churn in months. A worked example:
- ARPA: $80 a month
- Gross margin: 80%, so each account contributes $80 × 0.80 = $64 a month
- Monthly churn: 3%, so the expected lifetime is 1 ÷ 0.03 = 33.3 months
- LTV = $64 ÷ 0.03 = $2,133
This is the shortcut every SaaS team uses, and it is a good start. It rests on one assumption that often fails: that every customer has the same churn. This guide shows how to get each input right, how sensitive the answer is to churn, and how large the error gets when churn differs between segments. The general, non-SaaS version of the calculation is in how to calculate LTV; how LTV compares with acquisition cost is in LTV to CAC ratio.
How do you get each input right?
| Input | Definition to use | Common mistake |
|---|---|---|
| ARPA | Recurring revenue in the month ÷ paying accounts at the same point | Counting free or trial accounts, which drags ARPA down and mixes two groups |
| Gross margin | (Recurring revenue − cost of serving it) ÷ recurring revenue; include hosting, support and payment fees | Using revenue, which overstates LTV by 1 ÷ margin (here 25%) |
| Monthly churn | Accounts lost in the month ÷ accounts at the start of the month, averaged over at least 6 months | Using one good or bad month, or quoting annual churn divided by 12 |
Two cautions come from David Skok's SaaS metrics guide. First, customer churn and revenue churn can differ: losing 10% of customers may be only about 3.4% revenue churn if the lost customers were the smaller accounts, and both numbers matter (Skok, SaaS Metrics 2.0). Use the one that matches your ARPA: if ARPA is per account, use account (logo) churn; if you want revenue-weighted LTV, use revenue churn and total revenue. Second, the same guide treats monthly net revenue churn above 2% as a problem signal; that is roughly 22% of revenue lost a year, since 1 − 0.98¹² = 21.5%.
Gross margin has a quiet effect. With revenue instead of margin, the sample LTV would be $80 ÷ 0.03 = $2,667, which is 25% higher than $2,133. Always multiply by margin.
How sensitive is LTV to churn?
LTV moves faster than churn does, because churn is in the denominator. Holding ARPA at $80 and margin at 80%:
| Monthly churn | Expected lifetime | LTV |
|---|---|---|
| 2% | 50.0 months | $3,200 |
| 3% | 33.3 months | $2,133 |
| 4% | 25.0 months | $1,600 |
| 5% | 20.0 months | $1,280 |
| 6% | 16.7 months | $1,067 |
Recompute one row: $64 ÷ 0.04 = $1,600, and 1 ÷ 0.04 = 25 months. Moving churn from 3% to 4%, one point, cuts LTV by $533 (25%). That is why churn is the number to protect and why a small error in measuring it matters more than the same error in ARPA.
| Monthly churn | Expected lifetime | LTV |
|---|---|---|
| 2% | 50.0 months | $3,200 |
| 3% | 33.3 months | $2,133 |
| 4% | 25.0 months | $1,600 |
| 5% | 20.0 months | $1,280 |
| 6% | 16.7 months | $1,067 |
ARPA $80 and 80% gross margin held constant; LTV = $64 ÷ churn.
When does the simple formula give the wrong answer?
When customers do not all churn at the same rate, the average churn is the wrong thing to divide by. A sample: half your new accounts are small businesses that churn at 6% a month, and half are mid-size accounts that churn at 1.5% a month. Both pay $80 with an 80% margin.
| Share of accounts | Monthly churn | Lifetime | LTV ($64 ÷ churn) | |
|---|---|---|---|---|
| Small business | 50% | 6.0% | 16.7 months | $1,067 |
| Mid-size | 50% | 1.5% | 66.7 months | $4,267 |
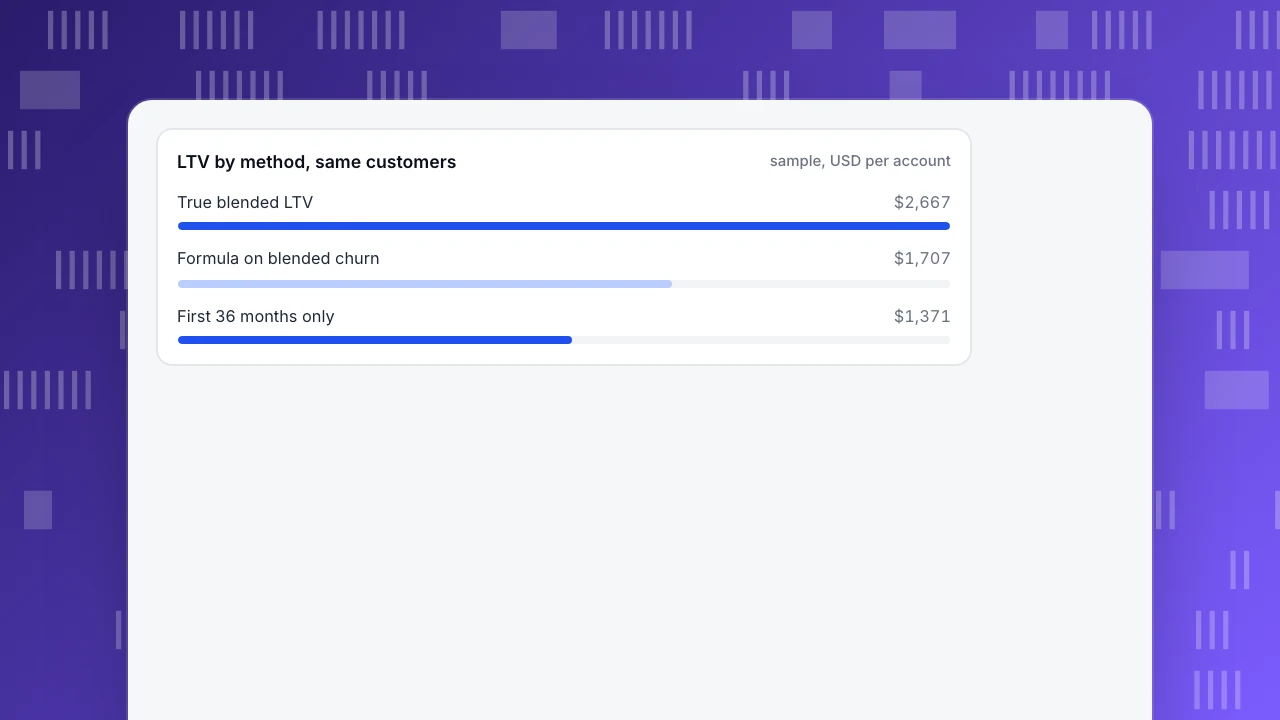
| True blended LTV | $2,667 (average of the two) | |||
| Formula on blended churn | 3.75% (average of 6% and 1.5%) | 26.7 months | $1,707 |
Recompute: the true LTV is 0.5 × $1,067 + 0.5 × $4,267 = $2,667. The formula uses the blended churn of 0.5 × 6% + 0.5 × 1.5% = 3.75%, giving $64 ÷ 0.0375 = $1,707. The formula underestimates the true figure by 36% ($1,707 versus $2,667); put the other way round, the truth is 56% higher.
Why: the fast-churning accounts leave early, so the people who remain churn more slowly than the average suggests. Fader and Hardie's work on subscription retention builds on exactly this idea: if customers have different underlying churn probabilities, the aggregate retention rate rises over time as the high-churn customers leave (Fader and Hardie, How to Project Customer Retention). A constant-churn assumption therefore misses the long tail. The fix is to calculate LTV per segment and add up weighted by share, or to read the retention curve of real cohorts.
LTV by method, same customers
sample, USD per accountHow far should you project, and what does a cohort curve change?
The gap above is invisible early. Using the same two-segment mix (cumulative gross margin per account, counting each month at the start-of-month survival):
| Horizon | Cohort curve (mix) | Formula (3.75% churn) | Cohort higher by |
|---|---|---|---|
| 12 months | $633 | $628 | 0.9% |
| 24 months | $1,062 | $1,025 | 3.6% |
| 36 months | $1,371 | $1,276 | 7.5% |
| Lifetime | $2,667 | $1,707 | 56.2% |
After 12 months, the two methods differ by less than 1%, so a year of data cannot tell you which is right. By month 36, 35.2% of the mixed cohort is still active, against 26.2% under constant 3.75% churn. Most of the gap lives in the tail beyond three years, which is also the part you are least able to verify.
Two practical rules follow. Cap the horizon at what you can believe: many teams use 36 or 60 months, so the figure is the first 36 months' margin ($1,371 here) rather than an infinite sum. And recompute from real cohorts every quarter: plot retention by sign-up month, sum the gross margin each cohort has actually produced, and use the formula only to extrapolate.
What about expansion revenue and the LTV to CAC check?
If existing customers pay more over time and the expansion is larger than the revenue lost to churn, net revenue churn is negative and the simple formula breaks: it would give an infinite or negative lifetime. Skok points out that this case needs a different, discounted cash-flow approach (Skok). Until then, use gross churn for the formula and treat expansion as upside you report separately.
Once you have LTV, test it against acquisition cost. With a sample CAC of $800:
- LTV ÷ CAC = $2,133 ÷ $800 = 2.67. Skok's guide calls a ratio above 3 typical of the best SaaS businesses, with the caveat that these are only guidelines.
- Payback: $800 ÷ $64 monthly margin = 12.5 months. The same guide says profitability is weak when CAC takes longer than 12 months to recover.
This example sits just outside both guidelines, so the question to ask is not "is LTV high" but "which of ARPA, margin, churn or CAC can we move". Dropping churn from 3% to 2% (LTV $3,200) lifts the ratio to 4.0.
What mistakes make SaaS LTV unreliable?
- Using revenue instead of gross margin. It overstates LTV by 25% at an 80% margin.
- Averaging churn across very different segments. The example above is 36% too low; segment first.
- Using too short a window for churn. One month is noise; use at least six, and watch for seasonality.
- Mixing free and paying accounts in ARPA. Report them separately.
- Quoting an infinite-horizon number as fact. Cap it, and show the cohort figure beside it.
- Ignoring discounting. Money in three years is worth less than money now; say whether the figure is discounted.
- Forgetting that LTV is a model. Recompute it against real cohorts every quarter.
How do you build this in TapCub?
TapCub is not a billing system and does not know your subscription state on its own: LTV needs revenue and churn that you send as events. If you record each subscription payment as a purchase event with an amount property, and identify logged-in users (or, for B2B, group them into accounts), you can build the inputs:
- ARPA. In All-platform analytics › Behavior › Metrics & SQL, define a metric from the purchase event: property sum of the amount divided by distinct paying accounts, per month.
- Churn and the cohort curve. In All-platform analytics › Behavior › Behavior analysis, run a retention report on the purchase event (or the login event) by sign-up month. That is the cohort curve to compare with the formula.
- Segments for the mix. Use All-platform analytics › Users › Segments & tags to make rule segments (for example plan or company size, if you send those as properties) and read each segment's retention separately. For B2B, Users › Accounts summarises members and a 0–100 account health score by account, not by person.
- CAC side. Import spend by day, channel and campaign in All-platform analytics › Business › Channel ROI; it shows cost per acquisition as spend divided by purchases in orders, so the numbers fit your LTV only if purchases mean new customers.
- A one-off cut. For anything else, the SQL tab can query events per person.
TapCub reports what was sent to it; it does not read your billing system, manage subscriptions, or collect failed payments.
FAQ
How do you calculate LTV for a SaaS business?
Multiply average monthly revenue per account by gross margin, then divide by monthly churn. With $80 ARPA, 80% margin and 3% churn, LTV is $80 × 0.80 ÷ 0.03 = $2,133.
What is a good LTV to CAC ratio for SaaS?
One widely quoted guideline is above 3, with CAC recovered in under 12 months, as in Skok's guide. Treat them as guidelines. In the example, 2.67 and 12.5 months show where the gap is.
Why is my SaaS LTV so different from my cohort data?
Because the formula assumes one churn rate for everyone. If segments churn at different speeds, the average churn understates the lifetime of the customers who stay. In the sample the formula was 36% below the true value.
Should LTV use revenue or gross margin?
Gross margin. Revenue overstates LTV; at an 80% margin the sample figure would be $2,667 instead of $2,133.
What should I use for churn if I have expansion revenue?
Use gross account churn for the simple formula and report expansion separately. If expansion exceeds churn, net revenue churn is negative and you need a different, discounted approach.
Sources
- David Skok, SaaS Metrics 2.0: A Guide to Measuring and Improving What Matters, checked 2026-11-21
- Fader and Hardie, How to Project Customer Retention (2006), checked 2026-11-21
Was this article helpful?
We use your answers to fix and expand this page.
Couldn’t send. Please try again in a minute.
Thanks for the feedback. We’ll use it to improve this page.You’ve already sent feedback on this page. Thanks.

Product Adoption Consultant
Explores customer onboarding, live conversations, and self-service, turning common usage questions into practical guidance and improvements.