Try it on your own data
Every report in this article is in the free plan. One snippet for web and apps, up to 10 sites.
Start freeImpressions = reach × average frequency. If you know the budget and CPM instead, impressions = budget ÷ CPM × 1,000; if you know clicks and CTR, impressions = clicks ÷ CTR. For a campaign reaching 400,000 people at a frequency of 3.5 that is 1,400,000 impressions. Below: each formula worked, why reach does not add across channels, served versus viewable, and how to verify results from your own tracking.
What you will learn
- Pick the formula by what you know: reach and frequency, budget and CPM, or clicks and CTR
- Reach does not add across channels (300,000 + 250,000 − 100,000 overlap = 450,000); impressions do
- You cannot count impressions on your own site; verify clicks against tagged sessions instead
What are the impressions formulas, and which one do you need?
An impression is one ad being served to one screen. There is no single formula, because impressions are normally counted by the platform that served the ad; the formulas below are for planning, for checking a report and for converting between numbers you already have. Which one you need depends on what you know.
| You know | Formula | Sample |
|---|---|---|
| Reach and average frequency | Impressions = reach × average frequency | 400,000 × 3.5 = 1,400,000 |
| Budget and CPM | Impressions = budget ÷ CPM × 1,000 | $5,000 ÷ $6.50 × 1,000 = 769,231 |
| Spend and impressions | CPM = spend ÷ impressions × 1,000 | $11,200 ÷ 1,400,000 × 1,000 = $8.00 |
| Clicks and click-through rate | Impressions = clicks ÷ CTR | 3,200 ÷ 0.2286% = 1,400,000 |
| Impressions and reach | Average frequency = impressions ÷ reach | 1,400,000 ÷ 400,000 = 3.5 |
CPM is "cost per mille", the cost of 1,000 impressions. For the CTR side, see how to calculate CTR; for the term itself, impressions and CPM. TapCub does not buy, bid on or serve ads, so none of these numbers is counted by TapCub. What TapCub measures is what happens after the click, which the last two sections cover.
| You know | Formula | Sample |
|---|---|---|
| Reach and frequency | reach × average frequency | 400,000 × 3.5 = 1,400,000 |
| Budget and CPM | budget ÷ CPM × 1,000 | $5,000 ÷ $6.50 × 1,000 = 769,231 |
| Spend and impressions | spend ÷ impressions × 1,000 = CPM | $11,200 ÷ 1.4M × 1,000 = $8.00 |
| Clicks and CTR | clicks ÷ CTR | 3,200 ÷ 0.2286% = 1,400,000 |
Viewable impressions are a share of served impressions: 62% of 1,400,000 = 868,000.
How do you calculate impressions from reach and frequency?
Reach is the number of different people who saw the ad at least once. Frequency is how many times, on average, each of those people saw it. Impressions are their product.
Sample data: a campaign reaches 400,000 people and the average frequency is 3.5.
- Impressions = 400,000 × 3.5 = 1,400,000.
- Rearranged, average frequency = 1,400,000 ÷ 400,000 = 3.5, and reach = 1,400,000 ÷ 3.5 = 400,000.
Average frequency hides the spread. Suppose 250,000 of those people saw the ad once, 100,000 saw it four times and 50,000 saw it twelve times: 250,000 × 1 + 100,000 × 4 + 50,000 × 12 = 250,000 + 400,000 + 600,000 = 1,250,000 impressions. The two views are not the same campaign: in this breakdown, 12.5% of the audience took 48% of the impressions. When a report gives only the average, ask for the distribution (how many people saw it once, twice, three times or more) before you judge whether the money is concentrated.
Reach does not add across channels. If channel A reaches 300,000 people, channel B reaches 250,000 and 100,000 saw both, combined reach is 300,000 + 250,000 − 100,000 = 450,000, not 550,000. Impressions do add (the overlap is counted twice, once for each exposure), which is why impressions can rise while reach barely moves.
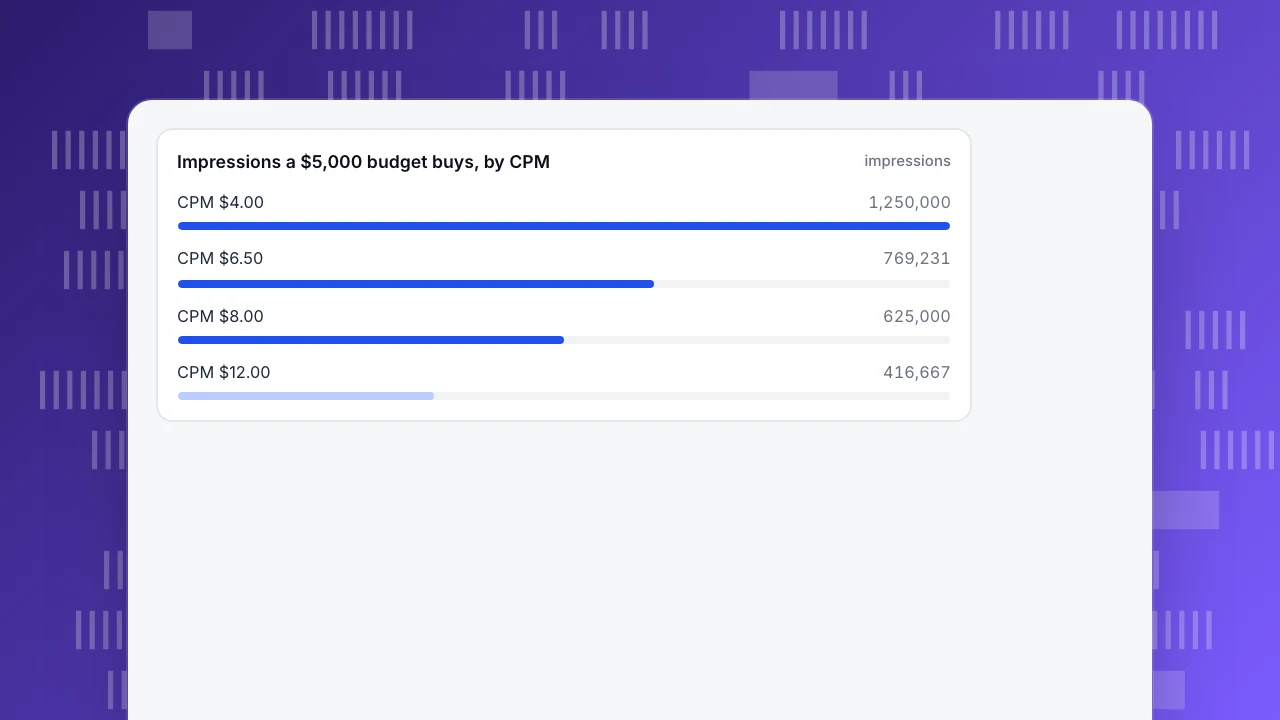
How do you calculate impressions from budget and CPM?
Rearrange CPM = spend ÷ impressions × 1,000 to get impressions = spend ÷ CPM × 1,000.
Sample data: a $5,000 budget.
| CPM | Impressions for $5,000 |
|---|---|
| $4.00 | 1,250,000 |
| $6.50 | 769,231 |
| $8.00 | 625,000 |
| $12.00 | 416,667 |
At the same budget, tripling the CPM from $4 to $12 cuts impressions to one third. Going the other way, the campaign in the first table spent $11,200 for 1,400,000 impressions, so its CPM was $11,200 ÷ 1,400,000 × 1,000 = $8.00.
A planning rule: impressions from a budget are an estimate, because CPM moves with audience, placement and competition for the same inventory. Treat a plan as a range (for example $6.50 to $8.00 gives 625,000 to 769,231 impressions) and compare the actual CPM with the plan every week.
A weekly pacing check, sample data: week 1 spent $1,400 for 200,000 impressions, a CPM of $1,400 ÷ 200,000 × 1,000 = $7.00. Against the planned $6.50 that is 7.7% higher (7.00 ÷ 6.50 = 1.077). If it holds, the $5,000 budget buys about 714,286 impressions rather than 769,231, so decide in week 2 whether to accept fewer impressions or move the budget, not at the end of the month.
Impressions a $5,000 budget buys, by CPM
impressionsHow do you work backwards from clicks and CTR?
CTR = clicks ÷ impressions, so impressions = clicks ÷ CTR. Sample data: 3,200 clicks and 1,400,000 impressions give a CTR of 3,200 ÷ 1,400,000 = 0.2286%. If a report shows clicks and a rounded CTR (0.23%), the implied impressions are 3,200 ÷ 0.0023 = 1,391,304. The difference from 1,400,000 is rounding: a CTR shown to two decimals can move the implied impressions by a few percent, so use this only as a cross-check, never as a count.
Cost per click follows from the same data: $11,200 ÷ 3,200 = $3.50.
What is the difference between served and viewable impressions?
A served impression means the ad was delivered to the page; it does not mean anyone could see it. The Media Rating Council's viewable impression guideline (version 1.0, June 2014) counts a display ad as viewable when at least 50% of its pixels were in view on an in-focus browser tab for at least one continuous second after render. For display ads of 242,500 pixels or more (the size of a 970 × 250 ad), a viewable impression may be counted at 30% of pixels for one continuous second, if that practice is disclosed. Video ads are covered separately.
So viewability is a ratio of served impressions. Sample data: of 1,400,000 served impressions, 62% were viewable.
- Viewable impressions = 1,400,000 × 62% = 868,000.
- Viewable CPM (vCPM) = $11,200 ÷ 868,000 × 1,000 = $12.90, against $8.00 for served impressions.
Google Ad Manager's help page for Active View describes the same logic in steps: viewable % = viewable impressions ÷ measurable impressions, where measurable is a subset of the impressions that were eligible for measurement. Always ask which base a quoted viewability percentage uses.
How do you verify impressions from your own tracking?
You cannot count ad impressions on your own site, because the ad was never on your page. What you can verify is everything after the click, and a gap there tells you whether to trust the reported clicks.
Sample data: the platform reports 3,200 clicks. Your site, with every ad link tagged with UTM parameters, recorded 2,560 sessions from the campaign.
- Click-to-session rate = 2,560 ÷ 3,200 = 80%. A gap of 20% is normal: some people click and leave before the page loads, some block scripts, some clicks are accidental or automated.
- Cost per session = $11,200 ÷ 2,560 = $4.375, compared with the platform's cost per click of $3.50. The second number is the one to compare channels on, because it counts only visits that arrived.
- Conversions at 2.5% of sessions = 2,560 × 2.5% = 64, so cost per acquisition = $11,200 ÷ 64 = $175.
Make the check a habit: record the click-to-session rate for each campaign, and after three campaigns treat any rate more than 10 points below your own median (here, below 70% if the median is 80%) as an alert to investigate before the next payment to the platform. If the click-to-session rate falls well below the usual range, investigate before changing the media plan: a broken tag, a slow landing page or a redirect that drops the UTM parameters are the usual causes. See UTM for tag hygiene and CTR for the click side.
Common mistakes with impressions
- Treating average frequency as the distribution. 3.5 can mean most people saw it once.
- Adding reach across channels. Subtract the overlap.
- Comparing impressions across platforms that count differently (served, viewable, measurable). Check the definition.
- Comparing CPM with vCPM. $8.00 and $12.90 are the same spend on different bases.
- Back-solving impressions from a rounded CTR and reporting it as a count.
- Assuming impressions equal visits. At an 80% click-to-session rate, 3,200 clicks became 2,560 visits.
Checking campaign results in TapCub
Take the sample campaign: $11,200 spent, 3,200 clicks reported by the platform. You want to know what happened after the click.
- Tag the links. Add UTM parameters (source, medium, campaign) to every ad link.
- Read the sessions. In Web analytics › Sources, filter by the UTM campaign to see visitors and sessions from it; recognised bots are kept out of visitor counts, so the 2,560 sessions are people.
- Add the spend. In All-platform analytics › Business › Channel ROI, import the spend by day, channel and campaign (CSV or one at a time). The page shows cost per click (spend ÷ sessions) and cost per acquisition (spend ÷ purchases in orders), grouped by channel, source or campaign.
- Count the outcome. Define a goal in Web analytics › Goals; it is the same data as under All-platform analytics › Business › Goals.
- Know the boundary. TapCub does not count ad impressions or run the buying and bidding; impressions, reach and viewability come from the platform you bought on. TapCub measures what the visits did afterwards.
FAQ
What is the formula for impressions?
Impressions = reach × average frequency. If you know the budget and CPM, impressions = budget ÷ CPM × 1,000, and if you know clicks and CTR, impressions = clicks ÷ CTR. For example, 400,000 people × 3.5 views = 1,400,000 impressions.
How do you calculate impressions from CPM?
Divide the budget by the CPM and multiply by 1,000. At $5,000 and a $6.50 CPM that is 5,000 ÷ 6.50 × 1,000 = 769,231 impressions. A higher CPM buys fewer impressions: at $12.00, the same budget buys 416,667.
What is the difference between reach and impressions?
Reach counts different people; impressions count exposures. One person who sees an ad four times is 1 reach and 4 impressions. Average frequency connects the two: impressions ÷ reach.
How do you calculate CPM?
CPM = spend ÷ impressions × 1,000. In the sample, $11,200 ÷ 1,400,000 × 1,000 = $8.00. If only viewable impressions are counted, the result is a viewable CPM: $11,200 ÷ 868,000 × 1,000 = $12.90.
Can you verify ad impressions with website analytics?
Not directly, because the ad is not on your site. You can verify the clicks that arrive: tag links with UTM parameters and compare sessions with reported clicks. In the sample, 2,560 sessions from 3,200 clicks is an 80% click-to-session rate.
Sources
- Media Rating Council with IAB. Viewable Ad Impression Measurement Guidelines, version 1.0. 30 June 2014: 50% of pixels for one continuous second; 30% for ads of 242,500 pixels or more. Checked 2026-11-21.
- Google Ad Manager Help. How Active View viewability is calculated. Eligible, measurable and viewable impressions and the viewable % formula. Checked 2026-11-21.
Was this article helpful?
We use your answers to fix and expand this page.
Couldn’t send. Please try again in a minute.
Thanks for the feedback. We’ll use it to improve this page.You’ve already sent feedback on this page. Thanks.

Product Experience Specialist
Explores usability, user journeys, and feature adoption through practical examples of onboarding and everyday product use.