Try it on your own data
Every report in this article is in the free plan. One snippet for web and apps, up to 10 sites.
Start freeA KPI report sample you can copy has six parts on one page: header, one-sentence headline, a table of five to seven KPIs with targets, one chart, short commentary on anything off target, and the decisions you need. The sample below shows the layout filled in, and the commentary rule that makes it useful: say what changed, why (known or suspected) and what happens next, and say when a change is within noise.
What you will learn
- One page, 5–7 KPIs, each with a target, an owner and a status rule agreed before the month starts
- Commentary is three sentences: what changed, why (label it suspected if unsure), what next with owner and date
- Check whether a change clears noise before calling it a trend: the sample's 1.5-point drop has p ≈ 0.21
What does a one-page KPI report need to contain?
A KPI report sample you can copy has six parts on one page: a header that says which period and who owns it, a one-sentence headline, a table of five to seven KPIs with target and comparison, one chart, a short commentary for anything off target, and a list of decisions or asks. Everything else belongs in an appendix. The reader should be able to say, in ten seconds, whether the month was on track and what you want from them.
| Part | What goes in it | Rule |
|---|---|---|
| Header | Period, data cut-off date, owner, definitions link | State the date range and when the data was pulled |
| Headline | One sentence: the verdict and the one thing that matters | If it needs two sentences, you have two stories |
| KPI table | Metric, previous period, this period, change, target, status | 5–7 rows; each has a target and an owner |
| Chart | The trend of the one KPI that explains the headline | One chart, not a dashboard |
| Commentary | What changed, the likely reason, what you will do | One to three lines per KPI that is off target |
| Asks | Decisions or resources needed, with dates | Two or three, each with an owner |
Compare this with a live KPI dashboard: a dashboard is for looking things up any day, a report is a fixed snapshot with a judgement attached. A general business report can be longer and cover strategy; this one is the monthly page that sits on top of it.
| Part | What goes in it | Rule |
|---|---|---|
| Header | Period, data cut-off, owner | State the date range |
| Headline | One-sentence verdict | Two sentences means two stories |
| KPI table | Previous, current, change, target, status | 5–7 rows |
| Chart | Trend of the KPI that explains the headline | One chart |
| Commentary | What, why, what next | 1–3 lines per off-target KPI |
| Asks | Decisions or resources needed | Two or three, each with an owner |
A dashboard is for lookups; a report is a snapshot with a judgement.
What does a filled-in sample look like?
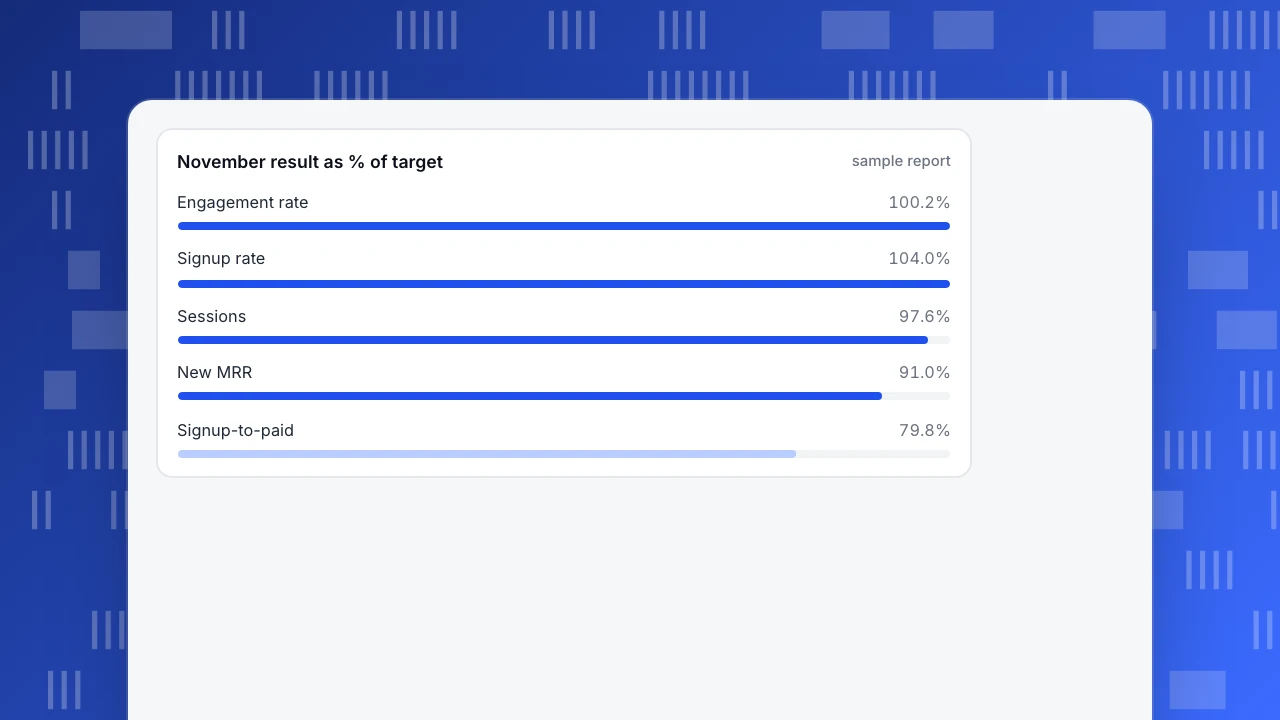
Sample data: a software product's monthly report, November compared with October. Status rule: green at or above target, amber at 90–99% of target, red below 90%.
| KPI | October | November | Change | Target | Status |
|---|---|---|---|---|---|
| Sessions | 41,200 | 43,900 | +6.6% | 45,000 | Amber (97.6% of target) |
| Engagement rate | 58.0% | 60.1% | +2.1 points | 60.0% | Green |
| Signup rate (signups ÷ sessions) | 2.40% (989) | 2.60% (1,141) | +0.20 points | 2.50% | Green |
| Signup-to-paid rate | 9.5% (94) | 8.0% (91) | −1.5 points | 10.0% | Red (79.8% of target) |
| New monthly recurring revenue | $4,700 | $4,550 | −3.2% | $5,000 | Amber (91.0% of target) |
Headline for this page: Acquisition grew and signups rose 15.4%, but fewer people paid, so new revenue fell to 91% of target.
How to recompute: sessions change is (43,900 − 41,200) ÷ 41,200 = 6.6%, and 43,900 ÷ 45,000 = 97.6% of target. Signup rate is 989 ÷ 41,200 = 2.40% and 1,141 ÷ 43,900 = 2.60%. Signups rose (1,141 − 989) ÷ 989 = 15.4%. Signup-to-paid is 94 ÷ 989 = 9.5% and 91 ÷ 1,141 = 8.0%, and 8.0 ÷ 10.0 = 79.8% of target. New revenue is 4,550 ÷ 5,000 = 91.0% of target.
Notice what the table does not say: that revenue fell because of anything. It states the numbers and leaves the reasoning to the commentary, where it can be marked as a hypothesis.
November result as % of target
sample reportHow do you write the commentary?
Commentary is the part that makes a report useful. Use three sentences per off-target KPI: what changed (with the numbers), why (a reason, labelled as known or suspected), and what next (an action, an owner and a date).
For the red row above:
- What: Signup-to-paid fell from 9.5% to 8.0% while signups rose 15.4%; paid accounts went from 94 to 91.
- Why (suspected): The extra signups likely came from a new, lower-intent source; we have not yet split signup-to-paid by source.
- Next: Split paid conversion by acquisition source by the 5th; owner, growth lead. If one source accounts for the drop, reduce its budget or change its landing page.
Two habits keep commentary honest. Write "suspected" when you do not know. And say when a change is within noise, which is the next point.
How do you tell a real change from noise?
Every rate in a report comes from a sample, so a small change can be chance. The US Census Bureau shows the habit well: its quarterly retail e-commerce release for the third quarter of 2026 (published 19 November 2026) reports seasonally adjusted e-commerce sales of $347.3 billion, up 1.6% (±0.4%) from the second quarter and up 10.4% (±0.9%) from a year earlier, a 17.9% share of total retail sales. The figures come with a margin of error, so the reader knows how much of the movement could be sampling (U.S. Census Bureau, Quarterly Retail E-Commerce Sales, checked 2026-11-21).
Do the same for your own rates. For the sample above, the 95% margin on a rate is about 1.96 × √(p × (1 − p) ÷ n):
| Rate | Value | n | 95% margin |
|---|---|---|---|
| Signup-to-paid, October | 9.5% | 989 | ±1.8 points |
| Signup-to-paid, November | 8.0% | 1,141 | ±1.6 points |
The two intervals overlap widely, and a two-proportion test on the 1.5-point drop gives z ≈ 1.25 and p ≈ 0.21: the fall is not yet distinguishable from chance. That does not make the commentary wrong; it changes its wording. "Fell 1.5 points, within noise at this volume; watching a second month" is honest. "Conversion collapsed" is not.
Contrast the signup rate: 2.40% to 2.60% gives z ≈ 1.85 and p ≈ 0.06, borderline. A rule that works: call a change "real" in the headline only when it clears roughly p < 0.05, or has held for two periods in a row. Otherwise write "up" or "down" and say it is within noise.
How should you define the KPIs so numbers do not change under you?
A report loses trust the first time a number differs from last month's definition. Fix the definitions once and put a link at the top of the page.
- Sessions. State the tool and whether bots are excluded. If bot traffic is counted, a crawler surge looks like growth.
- Engagement rate. In Google Analytics 4 a session is engaged if it lasts longer than 10 seconds, includes a key event, or has two or more page or screen views, and engagement rate is the share of sessions that were engaged (Google Analytics Help, checked 2026-11-21). Whatever definition you use, write it down; a different threshold gives a different number.
- Signup rate. Signups ÷ sessions in the same period, with the signup event named.
- Conversion rates across periods. Say whether the denominator is people or sessions, and whether a signup from last month who pays this month counts in this month's rate (cohort) or last month's.
- Revenue. Say whether it is billed, recognised or new recurring revenue, and in what currency.
Freeze last period's numbers when you publish. If a definition must change, restate the previous period under the new definition in the same report.
How do you adapt the sample for other teams?
Keep the layout and swap the KPI rows. Pick five that map to the team's goals, each with a target and an owner:
| Team | Suggested KPI rows | Cadence |
|---|---|---|
| Marketing | Sessions by channel, signup rate, cost per signup, new-visitor share, assisted conversions | Monthly |
| Product | Activation rate, day-7 retention, feature adoption, error rate, frustration per 1,000 page views | Monthly |
| Support | First response time, resolution rate, satisfaction, conversations per 1,000 sessions, knowledge base hit rate | Weekly |
| Leadership | New recurring revenue, signup-to-paid rate, churned revenue, cash runway, one risk | Monthly |
The same rules apply to each: a target, a status rule, one headline, and commentary only where the number is off.
How do you build this report in TapCub?
Take the sample report and produce it from your own project.
- Pull the numbers. Open Web analytics › Reports for core metrics by date with a comparison period and export. Use Web analytics › Goals for the signup rate, and Web analytics › Sources for sessions by channel. TapCub counts recognised bots separately, so the session figure is human traffic.
- Add the explanation. Use date annotations (Configuration › Annotations) to mark the releases and campaigns of the month on the charts, so the commentary can point to dates instead of memory.
- Find the reason behind a red row. For the sample's signup-to-paid drop, open All-platform analytics › Behavior › Behavior analysis and break the funnel down by source, or use the AI Assistant's "why did it change" breakdown by channel, source domain, country, device and landing page.
- Send it on a schedule. Subscribe to a daily, weekly or monthly report (the plan must include scheduled reports), or create a read-only public link under Configuration › Settings › Public sharing, choosing the modules to expose and optionally a password and a limit on how many days can be viewed. Visitor lists and sessions cannot be shared publicly.
- Alert between reports. Create a monitor for the KPI that went red, so you hear about the next movement before the next report.
TapCub gives you the numbers, comparisons, breakdowns and delivery. The headline, the commentary and the asks are still yours to write.
What mistakes make KPI reports unreadable?
- Too many KPIs. Twelve rows and nothing is the headline. Cut to the five that map to your goals.
- No target. A number without a target cannot be green or red. Agree targets before the month starts.
- Percent changes on tiny bases. "+300%" from 3 to 12 is not news.
- Commentary that restates the table. "Sessions rose 6.6%" is already in the table. Say why and what next.
- Changing definitions silently. Restate the previous period when you change one.
FAQ
What is a KPI report?
A KPI report is a regular, fixed-format summary of the key performance indicators that show whether a team or business is on track, with comparison to the previous period and to targets, and short commentary on anything off target. It is a snapshot with a judgement, not a live dashboard.
What should a KPI report include?
A header with the period and owner, a one-sentence headline, five to seven KPIs with previous period, current period, change, target and status, one chart, brief commentary on off-target items and a short list of decisions needed.
How many KPIs should a report have?
Five to seven is a good range for a one-page report. More than that and no single message stands out. Keep extra metrics in an appendix or a dashboard that people can open when they have a question.
How do I write KPI commentary?
For each off-target KPI write three sentences: what changed with numbers, why with a note on whether it is known or suspected, and what happens next with an owner and a date. Say when a change is within normal noise rather than calling it a trend.
How often should a KPI report be produced?
Match the decision rhythm. Monthly suits strategic KPIs such as revenue and conversion rates. Weekly suits operational ones such as sessions and support response. Use alerts for anything that cannot wait for the next report.
Sources
- U.S. Census Bureau: Quarterly Retail E-Commerce Sales, third quarter 2026 release of 19 November 2026, checked 2026-11-21
- Google Analytics Help: Engagement rate and engaged sessions, checked 2026-11-21
Was this article helpful?
We use your answers to fix and expand this page.
Couldn’t send. Please try again in a minute.
Thanks for the feedback. We’ll use it to improve this page.You’ve already sent feedback on this page. Thanks.

Data Engineer
Writes about event design, data quality, and collection workflows, with verifiable implementation methods for reliable analytics.