Try it on your own data
Every report in this article is in the free plan. One snippet for web and apps, up to 10 sites.
Start freeAn interactive product tour is a short guided sequence in which the user performs actions step by step instead of reading, used inside a product to reach a first useful result. It works when each step asks for one action and success is judged by the outcome, not by clicks on Next. Below: structure rules, keyboard accessibility, five events to track, a computed six-step funnel and how to tell whether the tour really helped.
What you will learn
- One goal, one action per step, value early, a visible skip: about 3 to 6 steps by our working rule
- Send an event per step and read the funnel from the biggest drop: step 4 lost 40.6% in the example
- Judge the tour by the outcome with a before-and-after or holdout comparison, not completers against non-completers
What is an interactive product tour?
An interactive product tour is a short guided sequence that asks the user to do something in the product, step by step, instead of only reading about it. Two things are called tours, and they have different goals:
- In-product tours run inside the live product and help a new user reach a first useful result. Success is activation.
- Interactive demos are sharable replicas of the product used before sign-up, on a website or in a sales email. Success is the visitor reaching the end and taking the next step. For that use see product demos.
This guide is about the first kind, with one measurement approach that works for both. For the term, see product tour. TapCub does not build or show tours. It measures them: you send an event for each step and read the step-by-step completion in a funnel, as the last section shows.
How should a tour be structured?
Nielsen Norman Group's research on instructional overlays (coach marks) in mobile apps gives rules that carry over to web tours: show one tip at a time, avoid chains of back-to-back tips (people dismiss them faster and the product seems more complicated), keep text minimal, make the overlay look different from real controls so people do not try to tap it, and limit content to key tasks or unusual interactions. Turn those into a structure.
| Part | Rule | Sample copy |
|---|---|---|
| Goal | One goal per tour, written as an outcome | "Create your first report" |
| Steps | One action per step; 3 to 6 steps for one goal | "Click New report" |
| Copy | Under about 25 words, verb first | "Pick the date range, then press Apply" |
| Order | The step that produces value comes early | Show a result by step 3 |
| Exit | A visible Skip and a way to resume later | "Skip tour" / "Resume from the Help menu" |
| Trigger | Start when the user reaches the relevant screen, not on every first load | Start on the empty reports page |
The 3-to-6 range is our working rule, not a published standard. What is worth checking is your own data: where, in the funnel below, people leave.
Make a step an action step (the user must click or type to continue) when the action is the point; make it an information step (a Next button) only when there is something to read first. Action steps give a cleaner signal, because completing one proves the user did the thing.
| Part | Rule | Sample |
|---|---|---|
| Goal | One goal per tour, written as an outcome | Create your first report |
| Steps | One action per step; 3 to 6 steps | Click New report |
| Copy | Under about 25 words, verb first | Pick the date range, then press Apply |
| Order | Value-producing step early | Show a result by step 3 |
| Exit | Visible Skip and a way to resume | Skip tour / Resume from the Help menu |
| Trigger | Start on the relevant screen | Empty reports page |
The 3-to-6 step range is our working rule; check your own funnel.
What does accessibility require?
A tour is an overlay on top of a product, so it can break keyboard use. WCAG 2.2 success criterion 2.1.1 (Keyboard, Level A) requires that all content functions can be operated through a keyboard interface. In practice, for every step:
- Reach and operate with the keyboard. Next, Back and Skip are focusable and respond to Enter and Space.
- Move focus into the step when it opens and return it to the element you are explaining when it closes.
- Do not trap focus in the overlay with no way out; Escape closes it.
- Do not hide the thing you are pointing at behind the overlay, and do not rely on colour alone to show the highlighted area.
Test it once with only a keyboard before launch; it takes five minutes and catches the common failures.
Which events should you track?
Without events you only know whether the tour was shown. Send five, with the tour name and the step number as properties:
| Event | When it fires | Properties |
|---|---|---|
tour_started | Tour appears | tour, version |
tour_step_viewed | A step is shown | tour, step |
tour_step_completed | The user does what the step asked | tour, step |
tour_skipped | Skip is pressed | tour, step |
tour_completed | Last step done | tour, version |
Then add the outcome event the tour exists for, for example report_created. A call looks like tapcub.track('tour_step_completed', { tour: 'first-report', step: 3 }). Name the events once and keep them: renaming splits the history.
Worked example: a step-completion funnel
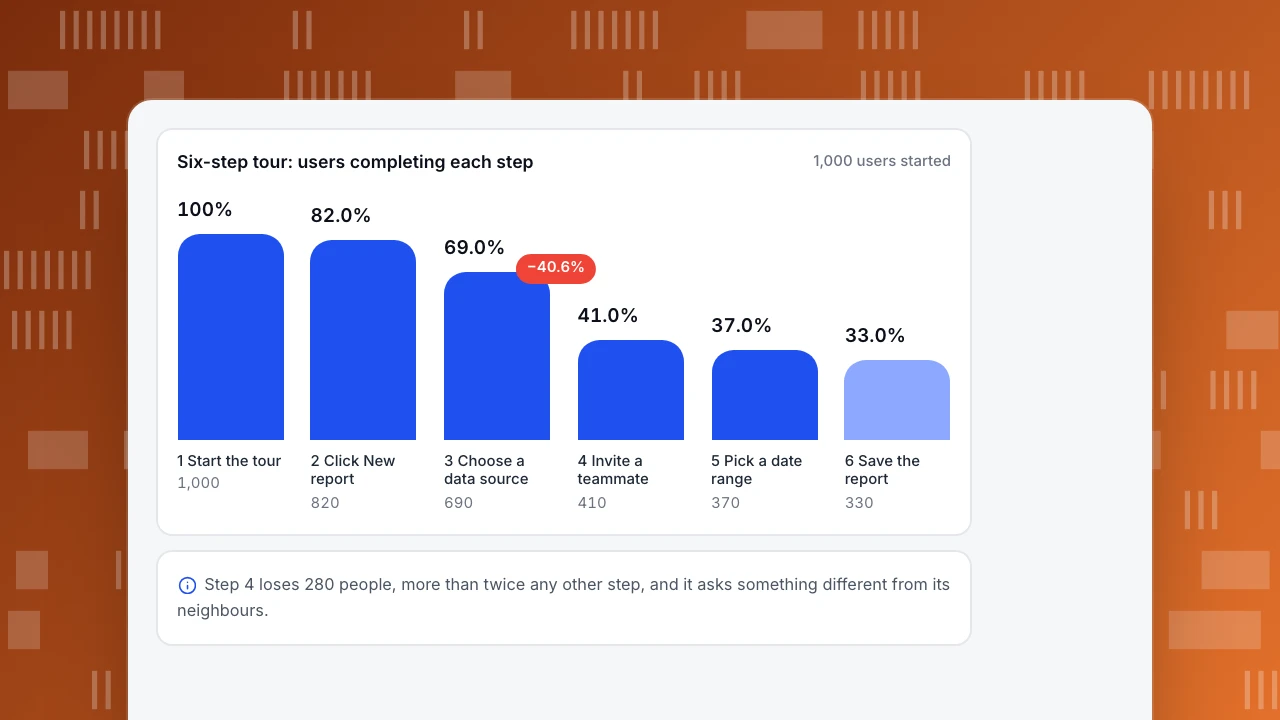
Sample data: 1,000 new users start a six-step tour. The number who complete each step:
| Step | What it asks | Users | % of start | % of previous step | Drop |
|---|---|---|---|---|---|
| 1 | Start the tour | 1,000 | 100.0% | ||
| 2 | Click New report | 820 | 82.0% | 82.0% | 18.0% |
| 3 | Choose a data source | 690 | 69.0% | 84.1% | 15.9% |
| 4 | Invite a teammate | 410 | 41.0% | 59.4% | 40.6% |
| 5 | Pick a date range | 370 | 37.0% | 90.2% | 9.8% |
| 6 | Save the report | 330 | 33.0% | 89.2% | 10.8% |
Read it from the biggest drop. Step 4 loses 280 people (40.6%), more than twice any other step. It asks something different from its neighbours (leave the report and invite a person), so the cause is probably the step itself, not the tour's length. If step 4 were made optional or moved after the report is saved, and its pass rate rose from 59.4% to 80%, completion would be 690 × 0.80 × 0.902 × 0.892 = about 444, a completion rate of 44.4% instead of 33.0%, with the later steps' pass rates unchanged. That is a hypothesis to test, not a promise.
Also read the overall number: 33.0% completed. A low completion rate is not by itself a failure. If most of the people who leave have already reached the first useful result, the tour has done its job early.
Six-step tour: users completing each step
1,000 users started1 Start the tour
1,000
2 Click New report
820
3 Choose a data source
690
4 Invite a teammate
410
5 Pick a date range
370
6 Save the report
330
Did the tour actually help?
The tempting comparison is completers against non-completers. Sample data: of the 330 completers, 224 activated (67.9%); of the 670 others, 208 did (31.0%). "The tour doubles activation" is the headline. It is wrong in the same way the chatted-versus-not comparison is wrong: people who finish a six-step tour are the keen ones, who might have activated anyway.
Use a comparison that does not depend on who finishes:
- Before and after, same length. Sample data: the 1,000 users before the tour activated at 38%; the 1,000 after at 44%. The gap is 6 points. Standard error of the gap = √(0.38 × 0.62 ÷ 1,000 + 0.44 × 0.56 ÷ 1,000) = 0.0220, so the 95% interval is 6 ± 4.3 points: 1.7 to 10.3 points. It excludes 0, which supports a real change, but the lower end is small. Check that nothing else changed in that period (a pricing change, a campaign).
- A holdout (some new users never see the tour) is stronger, but needs an experimentation tool; TapCub does not split traffic.
- Outcome, not completion. Judge the tour by the outcome event (activation, retention at week 4), not by how many clicked Next.
The method for the interval is the one in how to calculate a confidence interval; the two-proportion comparison follows the NIST/SEMATECH handbook.
How do you improve a tour with this data?
- Fix the biggest drop first. In the example, step 4.
- Make the step optional, move it later or split it if people leave the page to do it.
- Cut steps that no one fails only if they add nothing; a step with a 98% pass rate costs little.
- Trigger by behaviour. Start the tour when the user reaches the screen it explains.
- Compare versions. Add a
versionproperty and break the funnel down by it. - Re-measure with the same outcome after each change and keep the old numbers.
Common mistakes
- Counting "tour shown" as success. Count outcomes.
- Too many steps, all information. Chains of tips are dismissed.
- Comparing completers with non-completers. Selection bias again.
- No skip. Forced tours teach people to dismiss overlays.
- Keyboard-hostile overlays. Test with a keyboard.
- Renaming events between versions. It splits the history.
- Reading small cohorts. A cohort of 30 swings by several points on one person.
Measuring a tour in TapCub
Take the six-step example. TapCub does not build the tour, so you add the events in the product and read the results here.
- Send the events. In the product's code, call
tapcub.trackfor each event in the table. A name is required (cut at 100 characters), and you can send up to 20 properties per event. - Build the funnel. In All-platform analytics › Behavior › Behavior analysis, make a funnel from
tour_startedthrough eachtour_step_completed(at most 20 steps), with a window long enough for people to finish (the default is 7 days). It shows count, rate versus step one and versus the previous step, drop-off and median time from the previous step, and marks the largest drop. - See who dropped. Click a step to see the people who arrived or dropped there, and open one in All-platform analytics › Users › People to read their timeline.
- Compare versions. Break the funnel down by the
versionproperty; the breakdown keeps the 10 groups with the most entries. - Judge the outcome. Build the same funnel to the outcome event, and build a segment in All-platform analytics › Users › Segments & tags of people who did
tour_completed. Use annotations (Configuration › Annotations) to mark the day a new tour version shipped, so the before-and-after comparison is dated.
Know the boundary: TapCub does not build or display tours, run A/B tests or split traffic. A holdout needs a separate tool; TapCub measures what happened.
FAQ
What is an interactive product tour?
A short guided sequence in which the user performs actions step by step instead of reading, used inside a product to reach a first useful result or on a website as a clickable demo. Its success is measured by the outcome, such as activation.
How many steps should a product tour have?
Our working rule is 3 to 6 steps for one goal, one action per step, with the value-producing step early and a visible skip. Check your own funnel: a step that loses far more people than the others, like the 40.6% drop in the example, is the one to redesign.
How do you measure product tour success?
Send an event for each step and for the outcome, build a funnel of step completion, and judge the tour by the outcome (activation, week-4 retention) rather than by completion. Compare before and after, or against a holdout, not completers against non-completers.
What is a good product tour completion rate?
There is no universal figure. In the sample, 33.0% completed, and that can be acceptable if people who leave have already reached the first useful result. Look at where people leave and what outcome they reached.
Are product tours accessible?
They can be if every step works from the keyboard: WCAG 2.2 success criterion 2.1.1 (Level A) requires content to be operable through a keyboard interface. Make Next, Back and Skip focusable, move focus into each step, never trap it, and let Escape close the tour.
Sources
- Nielsen Norman Group. Instructional overlays and coach marks for mobile apps. One tip at a time, avoid chains of tips, minimal text, overlays that look distinct from controls, limit content to key tasks. Checked 2026-11-21.
- W3C. Understanding Success Criterion 2.1.1: Keyboard. All functionality operable through a keyboard interface; Level A. Checked 2026-11-21.
- NIST/SEMATECH e-Handbook of Statistical Methods. 7.3.3 Do two processes have the same proportion of defects?. Two-proportion comparison. Checked 2026-11-15.
Was this article helpful?
We use your answers to fix and expand this page.
Couldn’t send. Please try again in a minute.
Thanks for the feedback. We’ll use it to improve this page.You’ve already sent feedback on this page. Thanks.

Technical Engineer
Focuses on tracking code, SDKs, and API integrations, with practical guidance on implementation checks and troubleshooting.