Try it on your own data
Every report in this article is in the free plan. One snippet for web and apps, up to 10 sites.
Start freeThe average ecommerce bounce rate that you can trust is the one for your own segment: device, source and landing page type, measured with one definition. Public blended figures sit around 45–47% but rarely state a sample or definition. This guide splits a sample 46.7% store three ways and shows how traffic mix alone can move the number.
What you will learn
- A store-wide bounce rate is a weighted average, so compare device, source and page type with their own history and siblings, not with one blended number
- Tools define bounce differently (GA4 engaged-session rule vs one page view and no event); compare only within one definition with bots filtered out
- More sessions from a high-bounce source raise the average with no site change: 46.7% became 47.9% in the sample
Why one store-wide average misleads
Most "average ecommerce bounce rate" figures you find online are a single blended number, usually in the 40–60% range, quoted without a date, a sample or a definition. A blended number hides three things that move it more than your site design does: which devices your shoppers use, where they come from and which page they land on. If your mix changes, the average changes even when nothing on the site did.
The sample store used throughout this article has 100,000 sessions in a month and a store-wide bounce rate of 46.7%. That number is useful as a headline and useless as a diagnosis. The rest of the article splits it three ways, shows the arithmetic and explains which public benchmarks you can trust.
What counts as a bounce
A bounce rate is only comparable with another bounce rate if the definition matches. Google Analytics 4 defines bounce rate as the share of sessions that were not engaged. A session is engaged if it lasts longer than 10 seconds, has a key event or has two or more page or screen views. So in GA4 a shopper who reads one product page for 40 seconds is not a bounce.
Other tools use a stricter rule. TapCub counts a bounce as one page view and no custom event, regardless of how long the visit lasted. Under that rule, the same 40-second visit is a bounce. Neither rule is wrong, but a store reading 35% in one tool and 52% in another may simply be seeing two definitions.
Before you compare with any benchmark, write down three things: the tool, its bounce definition and whether bots are filtered out. Bot sessions are almost always one page and zero events, so unfiltered traffic inflates the rate.
What public benchmarks exist, and how far to trust them
Public ecommerce bounce benchmarks are thinner than the web suggests. Three data points are published with a source, a date and a sample:
- Contentsquare's 2026 Digital Experience Benchmark Report, published in early 2026, analysed 99 billion web and app sessions across 6,500 websites in nine industries. Its engagement chapter reports that 61% of visits to product detail pages bounce. It also reports year-on-year changes by source: bounce rates fell 4% for organic search and 3% for paid search between Q4 2024 and Q4 2025.
- Google's 2017 mobile speed study found that 53% of mobile visits are abandoned when a page takes longer than three seconds to load. That is a speed result, not an ecommerce bounce average, but it explains why mobile usually bounces higher.
- Google's Core Web Vitals guidance sets "good" at a Largest Contentful Paint of 2.5 seconds or less, measured at the 75th percentile of page loads.
What we could not verify is a single dated, sourced retail average split by device. Treat any "the average ecommerce bounce rate is X%" claim without a named report, year and definition as an unsourced figure. The practical use of the numbers above is directional: product pages bounce more than the store as a whole, and speed matters more on mobile.
Bounce rate by device
Sample data: the store's 100,000 sessions split by device.
| Device | Sessions | Bounce rate | Bounced sessions |
|---|---|---|---|
| Desktop | 35,000 | 38% | 13,300 |
| Mobile | 60,000 | 52% | 31,200 |
| Tablet | 5,000 | 44% | 2,200 |
| Total | 100,000 | 46.7% | 46,700 |
The blended rate is total bounced sessions divided by total sessions: 46,700 ÷ 100,000 = 46.7%. Note that you cannot average the three percentages (38, 52 and 44 average to 44.7%); the weights are different because mobile carries 60% of sessions.
The decision rule: if mobile bounces more than desktop by 10 points or more, check mobile speed and layout before touching copy. In the sample, the gap is 14 points (52% − 38%). Mobile accounts for 31,200 of the 46,700 bounces, 67% of the problem. Fixing mobile is the highest-value work, even though the desktop rate looks healthy.
| Segment gap | Likely cause | First check |
|---|---|---|
| Mobile 10+ points above desktop | Slow load, layout, tap targets | LCP at the 75th percentile, target 2.5 s or less |
| One source far above the rest | Ad promise differs from landing page | Ad headline against the first screen |
| Product pages above sibling product pages | Missing price, stock or shipping | First screen on mobile |
Change one thing at a time and compare the same segment before and after, with the mix held constant.
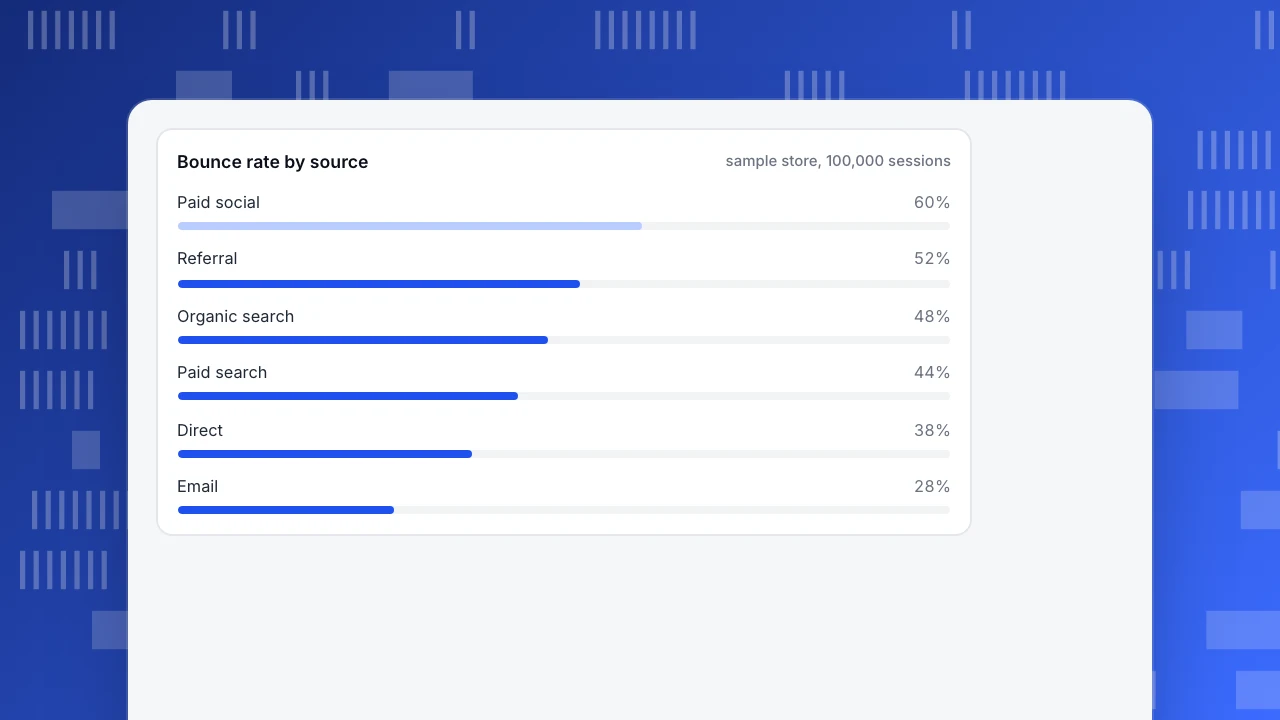
Bounce rate by traffic source
Sample data: the same 100,000 sessions split by source.
| Source | Sessions | Bounce rate | Bounced sessions |
|---|---|---|---|
| Organic search | 30,000 | 48% | 14,400 |
| Paid social | 20,000 | 60% | 12,000 |
| Paid search | 15,000 | 44% | 6,600 |
| Direct | 15,000 | 38% | 5,700 |
| 10,000 | 28% | 2,800 | |
| Referral | 10,000 | 52% | 5,200 |
| Total | 100,000 | 46.7% | 46,700 |
Email is low because the visitor chose to click and already knows the store. Paid social is high because the visitor was interrupted in a feed and clicked on an image. A high bounce rate from a source is not automatically a problem: what matters is whether the source's bounced sessions cost you money and whether the non-bounced ones convert.
A source with a high bounce rate and a low cost can still be worth it. A source with a high bounce rate and high cost per click is where to look first. If you import spend, the cost per session by source tells you which kind it is. The cost per acquisition formula article shows how to turn that into a decision.
Bounce rate by source
sample store, 100,000 sessionsBounce rate by landing page type
Sample data: the same 100,000 sessions split by the first page of the session.
| Landing page type | Sessions | Bounce rate | Bounced sessions |
|---|---|---|---|
| Home page | 20,000 | 40% | 8,000 |
| Category page | 25,000 | 42% | 10,500 |
| Product page | 40,000 | 52% | 20,800 |
| Search results | 5,000 | 32% | 1,600 |
| Blog article | 10,000 | 58% | 5,800 |
| Total | 100,000 | 46.7% | 46,700 |
Product pages carry 40% of sessions and 44.5% of bounces (20,800 ÷ 46,700). Search results pages bounce least because the shopper has already typed what they want. Blog articles bounce most because most readers have an answer-seeking intent and leave after reading.
The decision rule: compare each landing page type with the store-wide rate and with the other types of the same kind. A product page at 52% is not alarming when the public figure for product pages is 61%. A category page at 42% might be. The bounce rate of a single page is only meaningful beside pages that play the same role.
How your mix changes the average
Mix shift is the most common reason a store's bounce rate moves without a site change. Sample data: next month paid social grows from 20,000 to 30,000 sessions while every segment keeps its own bounce rate. The extra 10,000 sessions bounce at 60%, so 6,000 more bounces.
- Bounced sessions: 46,700 + 6,000 = 52,700
- Sessions: 100,000 + 10,000 = 110,000
- New store-wide rate: 52,700 ÷ 110,000 = 47.9%
The store-wide rate rose by 1.2 points although no page changed. If you reported "bounce rate got worse" you would send the team to fix a page that did nothing wrong. The check is simple: before explaining a change in the average, recompute last month's rate using this month's source mix. If it lands near the new figure, the cause is mix, not the site.
Which bounce rate is too high
A bounce rate is "too high" when it is high relative to what the page is for and to your own history, not relative to a number from a blog. Use three comparisons in this order:
- Your same segment last period. Device, source and page type, same definition. A move of more than 5 points that is not explained by mix is worth investigating.
- Your sibling segments. Mobile against desktop, a product page against other product pages. A gap above 10 points between siblings usually points to a specific fault.
- A public figure with a named source. Use it only as direction, for example product detail pages at 61% from the Contentsquare report.
Then ask what the bounce costs. Multiply bounced sessions by the share that would otherwise have converted at the segment's non-bounce conversion rate, and you get a rough value for the leak. In the sample, if paid social sends 12,000 bounced sessions at an assumed $0.80 per session, that is $9,600 of spend on visits that did nothing.
Fixes that follow from the segment
Each segment points to a different first fix:
| Pattern | Likely cause | First thing to check |
|---|---|---|
| Mobile 10+ points above desktop | Slow load, layout, tap targets | Largest Contentful Paint at the 75th percentile; target 2.5 s or less |
| One source far above the others | Ad promise does not match the landing page | The ad's headline against the page's first screen |
| Product pages above sibling product pages | Missing price, stock or shipping information | The first screen on mobile |
| Search or category pages high | Filters or results that do not match the query | Zero-result searches and default sort order |
| Sudden jump with no deploy | Bot traffic or a tracking change | Whether the tracking snippet fires twice or not at all |
Change one thing at a time and compare the same segment before and after, with the mix held constant. If you run the fix on mobile only, compare mobile with mobile.
In TapCub
Take the sample store above and look at it in TapCub in four steps.
- Open Web analytics › Overview and read the bounce rate card for the last 30 days. TapCub filters recognised bots out of visitor numbers, so this is human traffic. It counts a bounce as one page view and no custom event, so it will not match a tool that uses an engaged-session rule.
- Open Web analytics › Sources to read bounce rate by channel and source, then Web analytics › Audience for the device split. Compare each against the store-wide rate, as in the tables above.
- Open Web analytics › Pages: the visited-pages list shows a bounce rate per page, so you can compare product pages with each other, and the entry-pages tab shows where sessions start.
- In All-platform analytics › Operations › Monitors, create a check on the built-in
bounce_ratemetric. A dry run shows how many times it would have fired in the last 30 days. It only notifies you; it does not change anything on the site.
TapCub does not tell you which bounce rate is "good" for your store. It reports yours by segment so you can compare it with your own history.
FAQ
What is a good bounce rate for an ecommerce site?
There is no single good number, because the rate depends on device, source and page type. Compare each segment with the same segment last month and with its sibling segments, and treat a published figure as direction only. Contentsquare's 2026 report puts product detail pages at 61%, well above most store-wide averages.
Is a 50% bounce rate bad for ecommerce?
Not by itself. In the sample store, mobile at 52% and paid social at 60% sit above 50% while the store-wide rate is 46.7%. The question is whether that segment's visits cost money and whether the non-bounced ones convert. Check the segments before reacting to the headline.
Why is mobile bounce rate higher than desktop?
Mobile visits are more often interrupted visits from a feed, and pages load more slowly on mobile networks. Google's 2017 study found that 53% of mobile visits are abandoned after three seconds. Check Largest Contentful Paint at the 75th percentile on mobile first.
Why does my bounce rate differ between analytics tools?
The definitions differ. Google Analytics 4 treats a session as engaged after 10 seconds, a key event or two page views, and calls the rest bounces. TapCub counts one page view and no custom event. Bot filtering also differs, so compare only within one tool.
How does traffic mix change the average bounce rate?
The store-wide rate is a weighted average, so adding sessions from a high-bounce source raises it. In the sample, 10,000 extra paid social sessions at 60% lift the rate from 46.7% to 47.9% with no site change.
Sources
- Google Analytics Help, Engagement rate and bounce rate (engaged session: over 10 seconds, a key event or 2+ views). Checked 2026-11-21.
- Contentsquare, 2026 Digital Experience Benchmark: engagement (99 billion sessions, 6,500 websites; 61% bounce on product detail pages; source bounce changes Q4 2024 to Q4 2025). Checked 2026-11-21.
- Think with Google, Mobile page speed: new industry benchmarks (53% of mobile visits abandoned after 3 seconds, 2017). Checked 2026-11-21.
- web.dev, Web Vitals (LCP 2.5 s or less at the 75th percentile). Checked 2026-11-21.
Was this article helpful?
We use your answers to fix and expand this page.
Couldn’t send. Please try again in a minute.
Thanks for the feedback. We’ll use it to improve this page.You’ve already sent feedback on this page. Thanks.

Customer Experience Consultant
Writes about live chat, visitor conversations, and self-service, sharing practical ways to make customer communication clearer and more effective.