Try it on your own data
Every report in this article is in the free plan. One snippet for web and apps, up to 10 sites.
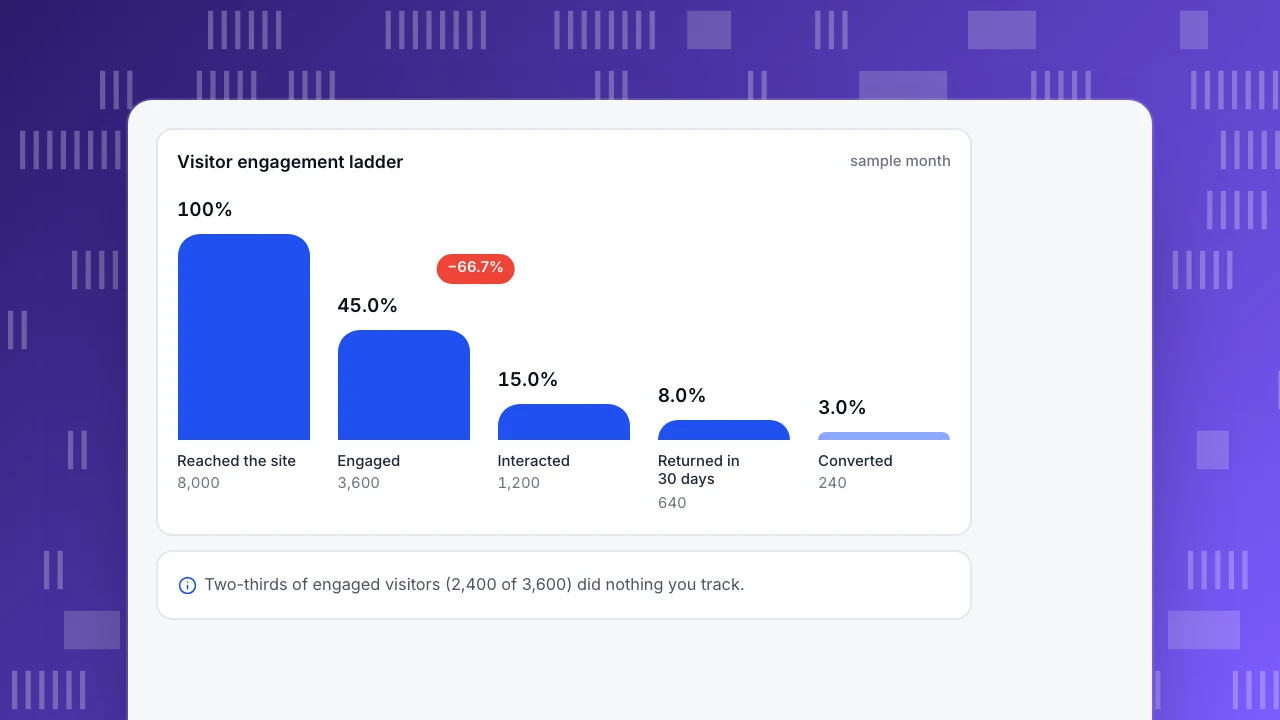
Start freeDigital engagement marketing is marketing that aims to make people interact, return and act, not just see; it is worth reporting only as behavior you can count on your own site. Use a five-rung ladder: reach, attention (an engaged session), interaction (a named event), return and value (a goal). In the sample, 8,000 visitors became 3,600 engaged, 1,200 interacting, 640 returning and 240 converting; the biggest drop was between attention and interaction.
What you will learn
- Report all five rungs by source: a report with only visits and engagement stopped two rungs early
- Compare campaigns by cost per engaged session: social cost 2 times email per session but 4.3 times per engaged session
- Put the main message and action in the first two screenfuls, which got about 74% of viewing time in an eye-tracking study
What is digital engagement marketing, if you measure it by behavior?
Digital engagement marketing is marketing that aims to get people to take part, not just to see something: read, interact, return and act. The common definition stops there, which is why "engagement" so often ends up meaning likes and clicks. This guide takes a stricter position: engagement is only worth reporting when it is a behavior you can count on your own site, in the order a person escalates, and tied to a result.
That gives you a ladder with five rungs: reach, attention, interaction, return and value. Each rung has a measurable definition, and each one filters out the people who did less. You will see the ladder with numbers, how two campaigns with the same traffic can differ four times over in cost per engaged visit, what published attention research says about where to put your message, and a table that replaces vanity metrics with behavior counts. Related reading: customer engagement metrics lists the metrics, and engagement metrics covers how to calculate them.
What are the rungs of the engagement ladder?
| Rung | Question | What counts | How to measure | Caution |
|---|---|---|---|---|
| 1. Reach | Did they arrive? | A session or visitor | Sessions and visitors by source | Includes bots unless filtered |
| 2. Attention | Did they stay and look? | An engaged session: longer than 10 seconds, or 2+ page views, or a key event (GA4 definition) | Engagement rate = engaged sessions ÷ sessions | 10 seconds is a convention |
| 3. Interaction | Did they do something? | A named event: video play, calculator use, download, scroll to a set depth | Event count and visitors with the event | Define events before the campaign |
| 4. Return | Did they come back? | A second visit within a window (7 or 30 days) | Returning visitors ÷ visitors | Anonymous visitors reset when site data is cleared |
| 5. Value | Did they act? | A goal: sign-up, purchase, request | Conversion rate from a named goal | Count people or sessions consistently |
Two principles make the ladder work:
- Each rung is a subset of the one before. You cannot interact without arriving; you can arrive without paying attention. Reporting all five side by side shows where people stop.
- Higher rungs are rarer and more valuable. A like or a click sits at rung 1 or 2. Rung 4 and 5 behaviors predict whether the marketing worked.
If a report only has rung 1 and rung 2 numbers, it is describing attention, not engagement with your business.
| Rung | What it counts | Measure |
|---|---|---|
| 1. Reach | A session or visitor | Sessions and visitors by source |
| 2. Attention | An engaged session | Engagement rate |
| 3. Interaction | A named event | Event count and visitors with the event |
| 4. Return | A second visit in 30 days | Returning visitors ÷ visitors |
| 5. Value | A goal | Conversion rate from a named goal |
Each rung is a subset of the one before; report them side by side by source.
Worked example: a visitor ladder with the drop at each rung
Sample data: one month, 8,000 visitors. For simplicity the ladder is nested: each rung counts the visitors who reached it and all lower rungs.
| Rung | Visitors | Share of all visitors | Share of previous rung |
|---|---|---|---|
| 1. Reached the site | 8,000 | 100.0% | n/a |
| 2. Engaged (a session over 10 s, 2+ pages or a key event) | 3,600 | 45.0% | 45.0% |
| 3. Interacted (any named event) | 1,200 | 15.0% | 33.3% |
| 4. Returned within 30 days | 640 | 8.0% | 53.3% |
| 5. Converted | 240 | 3.0% | 37.5% |
Checks: 3,600 ÷ 8,000 = 45.0%; 1,200 ÷ 3,600 = 33.3%; 640 ÷ 1,200 = 53.3%; 240 ÷ 640 = 37.5%; 240 ÷ 8,000 = 3.0%.
Reading it:
- The biggest drop is between attention and interaction. Two-thirds of engaged visitors (66.7%) did nothing you track. If you can only change one thing, change what invites an action on the pages they were reading.
- People who return are a good bet. 53.3% of those who interacted came back, and 37.5% of returners converted. That is 12.5 times the rate of the whole base (37.5% ÷ 3.0%), though returners are a self-selected group, so it does not prove returning causes conversion.
- A marketing report that says "8,000 visitors" or "45% engaged" has stopped two rungs early.
Visitor engagement ladder
sample monthReached the site
8,000
Engaged
3,600
Interacted
1,200
Returned in 30 days
640
Converted
240
How do you compare campaigns by engagement, not by clicks?
Cost per click treats every visit as equal. Cost per engaged session shows what you actually bought.
Sample data: two campaigns, each sending 2,000 sessions.
| Campaign | Spend | Sessions | Engaged sessions | Engagement rate | Conversions | Cost per session | Cost per engaged session | Cost per conversion |
|---|---|---|---|---|---|---|---|---|
| $200 | 2,000 | 1,300 | 65.0% | 60 | $0.10 | $0.15 | $3.33 | |
| Paid social | $400 | 2,000 | 600 | 30.0% | 24 | $0.20 | $0.67 | $16.67 |
Computation: email $200 ÷ 1,300 = $0.154; social $400 ÷ 600 = $0.667. Cost per conversion: $200 ÷ 60 = $3.33; $400 ÷ 24 = $16.67.
Per session, social costs 2 times what email does ($0.20 vs $0.10). Per engaged session it costs 4.3 times as much ($0.667 ÷ $0.154), and per conversion 5.0 times as much. Looking only at clicks understates the difference by more than half.
Two cautions. Email goes to a list that already knows you, and social reaches colder audiences, so the comparison measures the mix of audience as well as the channel. And sessions from different sources are a mix of intents; compare campaigns inside the same medium when you can.
Where should you put the message? What attention research says
An eye-tracking study by Nielsen Norman Group, published in 2018, analysed more than 130,000 fixations from 120 participants. People spent about 57% of their page-viewing time above the fold, 17% on the second screenful, and the remaining 26% across the rest of the page.
What to do with the numbers:
- Put the main message and the main action in the first two screenfuls. Together they received about 74% of viewing time (57% + 17%).
- Treat scroll depth as an event, not a verdict. A visitor who reaches 75% of the page is a stronger signal than one who stops at 25%, but a page that answers the question at the top does not need deep scroll.
- Set a depth event you can count, such as 50% and 90%, and report the share of engaged visitors who reach it.
Quick rule: if less than a quarter of engaged visitors reach the section holding your call to action, the page has a placement problem before it has a copy problem.
Which interactions should you track as rung 3?
Rung 3 is only as good as the events you define, so choose three to five that signal intent on your site, not everything that can be clicked. Name them before the campaign starts.
| Site type | Interactions that signal intent | Interactions to ignore |
|---|---|---|
| Content or blog | Scroll to 75%, newsletter signup, click to a related guide | Clicks on the logo or menu |
| SaaS product site | Pricing page viewed, demo video played to 50%, docs link clicked | Generic button hovers |
| Online store | Product image zoom, size guide opened, add to cart | Page loads of the cart without items |
A good test for any event: if a visitor does this, would you follow up differently? If not, it is noise at rung 3.
Which vanity metrics should you swap for behavior counts?
| Vanity metric | Why it misleads | Replace with |
|---|---|---|
| Likes, reactions | Cost nothing, tell you nothing about visits | Sessions from that post and their engagement rate |
| Clicks | Count visits regardless of what they did | Engaged sessions and cost per engaged session |
| Email opens | Inflated by automatic image loading | Clicks to the site, then engaged sessions |
| Followers | A stock, not an action | Returning visitors from that source |
| Time on page (average) | One idle tab skews the mean | Median time, or share of sessions over 10 seconds |
| Pageviews | Rewards confusing navigation | Pages per engaged session and goals reached |
How do you set engagement targets and review them weekly?
Set one target per rung, using your own baseline from the last 8 to 12 weeks, not an industry figure:
- Write the baseline for each rung from the ladder table.
- Pick the rung with the largest drop and set a target one rung-step higher (for example, from 33.3% of engaged visitors interacting to 40%).
- Define the event before the campaign starts. Changing a definition mid-test invalidates the comparison.
- Review weekly by source, not blended; a blended ladder hides the campaign that is failing.
- Annotate changes (new page, new creative, send date) so a dip is traceable.
Measuring engagement in TapCub
Use the ladder as the dashboard.
- Rungs 1 and 2: Web analytics › Reports lets you tick sessions, visitors and engagement rate (engaged sessions ÷ sessions; engaged means 10 seconds or more, or 2 or more pages, or a goal marked as key). Web analytics › Sources splits them by channel and campaign.
- Rung 3: in Web analytics › Events, name the events you care about; scroll depth is a separate switch in auto-capture. Funnels and event analysis are under All-platform analytics › Behavior.
- Rung 4: retention in All-platform analytics › Behavior › Behavior analysis shows how many of a group come back in period N; the lifecycle view splits New, Returning, Resurrecting and Dormant. Returning only works for visitors TapCub can recognise, so anonymous visitors who clear their data look new.
- Rung 5: Web analytics › Goals defines the conversion; use one goal across sources.
- Filtering out noise: bots and AI crawlers are counted separately, so they do not inflate rung 1 or drag down engagement rate.
- Segment the engaged: save a segment under All-platform analytics › Users › Segments & tags (rule segments like "did event X in the last 30 days") and use it as a group in funnels and retention.
TapCub does not send emails or run campaigns; it shows what people do after they arrive.
FAQ
What is digital engagement marketing?
Marketing that aims to make people interact with, return to and act on your digital content, not just see it. It is measured by behavior: engaged sessions, named events, return visits and goals.
How do you measure digital engagement?
Use a ladder: reach (sessions), attention (engaged sessions), interaction (named events), return (returning visitors) and value (goals). Report all rungs by source so you see where people stop.
What is a good engagement rate?
There is no universal figure. Use your own baseline over 8 to 12 weeks, compared within the same source. In the sample, email was 65.0% and paid social 30.0%, so the blended 47.5% would have described neither.
What is the difference between digital marketing and digital engagement marketing?
Digital marketing focuses on reaching people; digital engagement marketing focuses on what they do after: interact, return and convert. The first is measured at the top of the ladder, the second all the way down.
Are likes and shares engagement?
They are weak signals. They cost the user nothing and say nothing about visits. Count sessions, engaged sessions and goals from that post instead.
Sources
Was this article helpful?
We use your answers to fix and expand this page.
Couldn’t send. Please try again in a minute.
Thanks for the feedback. We’ll use it to improve this page.You’ve already sent feedback on this page. Thanks.

Product Adoption Consultant
Explores customer onboarding, live conversations, and self-service, turning common usage questions into practical guidance and improvements.