Try it on your own data
Every report in this article is in the free plan. One snippet for web and apps, up to 10 sites.
Start freeMarketers need five data skills, in this order: reading what a number counts, comparing it fairly, checking that it can be trusted, judging whether a difference is real, and explaining it in one sentence. None requires code, and each can be practised on the dashboard you already have. Each skill protects the next: a significance test on a rate with the wrong denominator is precise and wrong.
What you will learn
- Write "per ___" next to every rate: 5.0% per visitor and 3.6% per session are both correct and cannot be compared
- Split before you explain: conversion fell from 3.0% to 2.5% while both device rates stayed the same
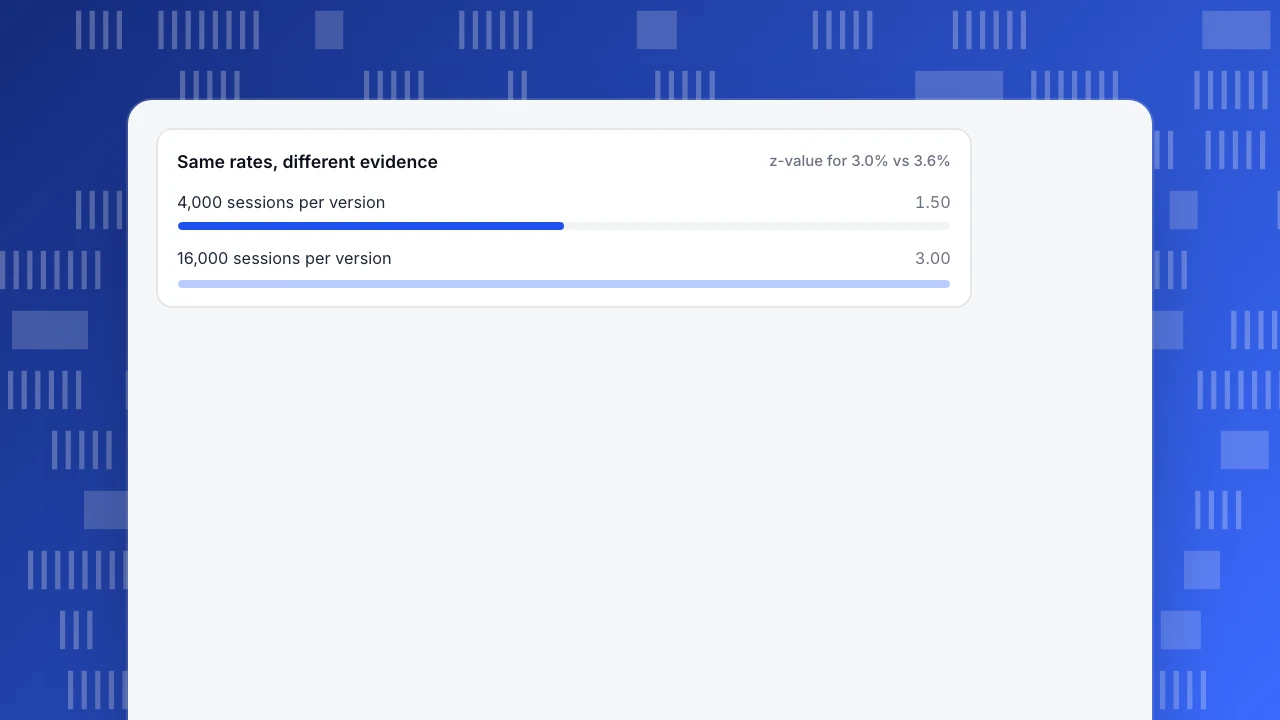
- 3.0% vs 3.6% on 4,000 sessions each is noise (z = 1.50); the same rates on 16,000 each are not (z = 3.00)
Which data skills does a marketer actually need?
A marketer needs five data skills, in this order: reading what a number counts, comparing it fairly, checking that it can be trusted, judging whether a difference is real, and explaining it in one sentence. None of them requires writing code. All of them can be practised on the analytics dashboard you already have open.
The order matters because each skill protects the next. Someone who can run a significance test but does not know whether a rate is per session or per person will test the wrong thing precisely. And someone who tells a clear story from an untrustworthy number does more harm than someone who tells no story at all.
For a sense of why employers care: the US Bureau of Labor Statistics projects employment of market research analysts to grow 7% from 2025 to 2035, described as much faster than the average for all occupations, with a median annual wage of $78,760 in May 2025. Its occupational profile lists analytical skills and the use of statistical techniques and software among the requirements. That is a job description, not a prediction about your role, but it shows that analysis is part of marketing's core work, not an add-on.
This guide gives you the ladder, a test question for each level so you can see where you are, a worked example at each of the middle levels, and a five-week plan with 30 minutes a week. It pairs with data storytelling, which covers level 5 in depth, and data maturity model, which looks at the same question for a whole team.
What is the skill ladder, and how do you know your level?
| Level | Skill | Test question | Practice on your dashboard |
|---|---|---|---|
| 1 | Read what a number counts | Is this rate per session, per visitor or per order? | Pick five numbers on the overview page; write the numerator and denominator of each |
| 2 | Compare fairly | Did the rate change, or did the mix change? | Split one rate by device and compare two periods |
| 3 | Check it can be trusted | Could bots, a tracking change or a small sample explain it? | Run the five-point check below on a number you are about to report |
| 4 | Judge whether a difference is real | Is 3.0% vs 3.6% a signal or noise? | Compute a confidence interval for one A-versus-B comparison |
| 5 | Explain in one sentence | What should the reader do differently? | Write a headline, the number and the action for one chart |
Rule for self-assessment: you are at the level where you can answer the test question for a number you did not build, without looking anything up. Most marketers who think they are at level 4 are at level 2, because level 1 and 2 mistakes are invisible to the person making them.
| Level | Skill | Test question |
|---|---|---|
| 1 | Read what a number counts | Per session, per visitor or per order? |
| 2 | Compare fairly | Did the rate change or did the mix? |
| 3 | Check it can be trusted | Bots, tracking changes, small sample? |
| 4 | Judge whether a difference is real | Is 3.0% vs 3.6% signal or noise? |
| 5 | Explain in one sentence | What should the reader do differently? |
You are at the level where you can answer the test question for a number you did not build.
Level 1: how do you read what a number actually counts?
Every rate has a numerator and a denominator, and tools differ on both. TapCub's documentation, for instance, defines goal conversion rate as the number of visitors who completed a goal divided by distinct visitors in the same period, while the reports table uses conversions divided by sessions. It says plainly that the two are not directly comparable: one divides people by people, the other counts events per visit.
Sample data to show the effect: a month with 10,000 sessions from 6,000 visitors, and 300 visitors who converted, with 360 conversions in total (some converted twice).
| Measure | Calculation | Result |
|---|---|---|
| Visitor conversion rate | 300 ÷ 6,000 | 5.0% |
| Session conversion rate | 360 ÷ 10,000 | 3.6% |
Same month, same site, two correct numbers that differ by 1.4 points. A marketer who quotes 5.0% in one slide and compares it to last quarter's 3.6% has invented a 39% improvement (5.0 ÷ 3.6 − 1 = 38.9%) that is a change of definition.
Habit: before you quote any rate, write "per ___" next to it.
Level 2: how do you compare without being fooled by mix?
A blended rate moves when the mix of traffic changes even if every segment's rate stays the same.
Sample data: a site's conversion rates by device stay constant across two months, but the traffic mix shifts.
| Month | Mobile sessions | Mobile rate | Desktop sessions | Desktop rate | Blended |
|---|---|---|---|---|---|
| March | 2,000 | 1.5% | 3,000 | 4.0% | (30 + 120) ÷ 5,000 = 3.0% |
| April | 3,000 | 1.5% | 2,000 | 4.0% | (45 + 80) ÷ 5,000 = 2.5% |
The blended rate fell by half a point (a 16.7% drop) although neither device got worse. A campaign that sent more mobile visitors changed the mix. The skill is the reflex to split before you explain: by device, source and new versus returning visitors, always comparing like with like.
Level 3: what should you check before trusting a number?
Run five checks before you report a number. Each takes under a minute:
- Denominator size. Under about 100 conversions, a rate can move a lot by chance. Say "small sample" out loud.
- Bots. Are crawlers excluded? Bot traffic is short, single-page and rarely converts, so it drags rates down.
- Tracking changes. Did anyone change the code, goals or session rule in this period? A jump on the day of a release is a measurement change until proven otherwise. Use date annotations to mark releases.
- Time window. Does the comparison cover the same weekdays? Compare Tuesday-to-Tuesday weeks, not a week with a holiday against one without.
- Definition. Is the number defined the same way as last time (per session or per person)?
If any check fails, report the number with that caveat or do not report it. A number you cannot defend is worse than a missing one.
Level 4: is a difference real or noise?
Sample data: two versions of a landing page, each shown to 4,000 sessions. Version A converts 120 (3.0%); version B converts 144 (3.6%).
Using the two-proportion test described in the NIST/SEMATECH e-Handbook:
- Pooled rate p = (120 + 144) ÷ 8,000 = 0.033.
- Standard error = √(0.033 × 0.967 × (1/4,000 + 1/4,000)) = 0.00399.
- Difference = 0.036 − 0.030 = 0.006, so z = 0.006 ÷ 0.00399 = 1.50, p ≈ 0.13.
- A 95% confidence interval for the difference is −0.18 to +1.38 percentage points. It includes zero.
At this sample size, B being 20% better is not distinguishable from luck. Keep the same rates and multiply the sample by four (16,000 sessions each: 480 vs 576 conversions) and the result changes: z = 3.00, p ≈ 0.003. The rates did not change; the evidence did.
Three rules for marketers: (1) plan the sample before the test, (2) never stop the moment a number looks good, and (3) report the interval, not just the point. TapCub does not run A/B tests or split traffic; if you test elsewhere, use TapCub to check the conversion and bot filtering of each arm.
Same rates, different evidence
z-value for 3.0% vs 3.6%Level 5: how do you explain it in one sentence?
A finding the reader can act on has four parts: what changed, by how much, compared with what, and what to do. Template:
"[Metric] for [segment] was [value] in [period], [up or down] [amount] from [baseline]. [Cause or best guess]. We should [action]."
Example from level 2: "Blended conversion fell from 3.0% to 2.5% in April, but mobile and desktop rates were unchanged at 1.5% and 4.0%. The campaign shifted mix toward mobile. We should compare device by device, not blended." Notice it states the baseline and gives an action. Chart choice and narrative structure are in data storytelling.
What is a five-week practice plan?
30 minutes a week on your own dashboard:
| Week | Level | Exercise | Done when |
|---|---|---|---|
| 1 | 1 | Write numerator, denominator and "per ___" for five overview numbers | Each has a written definition |
| 2 | 2 | Split one rate by device and compare two months | You can explain a blended change using the split |
| 3 | 3 | Run the five-point check on the number from your last report | You found at least one caveat or confirmed none |
| 4 | 4 | Compute a z-value and interval for one comparison | You can say whether the difference is distinguishable from noise |
| 5 | 5 | Write a four-part finding for the week-4 comparison | Someone who was not involved can act on it |
Where each skill lives in TapCub
Use the dashboard you have as the practice ground.
- Level 1: Web analytics › Overview and Web analytics › Reports list each metric with its definition; TapCub's goal conversion rate (people ÷ people) and report conversion rate (conversions ÷ sessions) are different numbers, so write "per ___" next to each.
- Level 2: use Web analytics › Audience to split by device, and Web analytics › Sources for source mix. Web analytics › Pages shows period-over-period change.
- Level 3: Web analytics › Bots shows what is excluded; Configuration › Annotations lets you mark releases and campaigns on the charts.
- Level 4: the Metrics & SQL page (All-platform analytics › Behavior › Metrics & SQL) defines your own metrics from events, or you can query event data with SQL, to compute rates for each arm.
- Level 5: All-platform analytics › Operations › AI Assistant answers a plain-language question with a chart built from queries on your project; read the numbers back with the four-part template. It does not make decisions for you.
TapCub does not run experiments or compute significance for you, so level 4 is a calculation you do from its numbers.
FAQ
What data skills do marketers need?
Reading what a metric counts, comparing fairly across segments and periods, checking data quality, judging whether a difference is real, and explaining a finding in one actionable sentence. SQL is useful but not required for any of the five.
Do marketers need to learn SQL?
Not to start. Levels 1 to 3 use reports and filters. SQL helps at level 4 when a question is not in any report, but learn it after the first three levels.
How do I practise data skills?
Use your own analytics dashboard with a weekly 30-minute exercise per level, as in the five-week plan. Practice on numbers you report, not on sample datasets.
How long does it take to build data skills?
Five weeks at 30 minutes a week gets you through the ladder once. Real fluency comes from repeating it on each report you publish.
What is the most common data mistake in marketing?
Comparing rates with different denominators, such as people versus sessions. It produces improvements that are only changes of definition, like the 38.9% in the example.
Sources
Was this article helpful?
We use your answers to fix and expand this page.
Couldn’t send. Please try again in a minute.
Thanks for the feedback. We’ll use it to improve this page.You’ve already sent feedback on this page. Thanks.

Data Analyst
Explores traffic sources, conversion funnels, and retention, using clear metric definitions and concrete examples to explain what the numbers mean.