Try it on your own data
Every report in this article is in the free plan. One snippet for web and apps, up to 10 sites.
Start freeTo track the customer journey, define four to six stages, pick one event that proves each, send a user ID at login so one person is one record across devices, name events consistently and read the funnel and common paths. Count people, not devices: in the sample, 1,000 people showed up as 1,380 visitors.
What you will learn
- One proof event per stage, fired from the server for money and accounts
- A user ID at login turns 1,380 device IDs back into 1,000 people and moves conversion from 5.4% to 7.4%
- Set the window at the 90th percentile of the real delay: 19 days in the sample, so use 30
What tracking the customer journey means
To track the customer journey is to record a sequence of events that belong to one person over time, so you can see what they did before they bought and where they stopped. Three things have to be true: the stages are defined, each stage has one event that proves it, and the events from a person's phone and laptop are tied to the same identity.
Most journey tracking fails at the third point. A page-view report counts devices, not people, so the same person looks like two visitors who each did half the work. This article is the setup in five steps, with a worked example. Mapping the journey on paper is covered in customer journey map, and reading the data afterwards in customer journey analytics.
Step 1: write the stages and the one event that proves each
Start from four to six stages and choose one event per stage that cannot happen by accident. A page view of a pricing page is weak proof of consideration; a click on "Start trial" is strong proof of intent.
| Stage | Proof event | Why this event |
|---|---|---|
| Aware | First visit with a source | Records where the person came from |
| Consider | Pricing page viewed | Shows comparison behaviour |
| Sign up | signup_completed | Server-confirmed account creation |
| Activate | First key action, such as project_created | The action that predicts staying |
| Pay | purchase or subscription_started | Revenue; take it from the server |
Two rules keep this list useful. Use one event per stage, not "any of these seven". And fire money and account events from your server, because a browser event can be blocked or double-sent.
Step 2: decide how one person is recognised across devices
Before sign-in, you know a browser, not a person. Analytics tools give each browser or device an anonymous ID. The fix is a user ID: your own identifier for the person, sent when they log in, so activity before and after login joins into one record.
Google's GA4 documentation describes the rules, and they are good general rules:
- The ID must be unique per person, at most 256 characters, and assigned the same way every time.
- It must not contain information a third party could use to work out who the person is. Use your internal customer number, not an email address.
- Activity before sign-in is linked to the ID once it is set; activity after sign-out with no ID is not linked.
- Data collected before you implemented user IDs is not linked retroactively.
Here is what it changes. Sample data: 1,000 customers produced 1,380 anonymous visitor IDs, because some used a phone and a laptop, and some cleared cookies. That is 38% more "visitors" than people. If 74 of them bought, the conversion rate is 74 ÷ 1,000 = 7.4% by person and 74 ÷ 1,380 = 5.4% by visitor ID. Neither is wrong; they answer different questions, and mixing them in one report is the error. Count people for journey questions.
| Stage | Proof event |
|---|---|
| Aware | First visit with a source |
| Consider | Pricing page viewed |
| Sign up | signup_completed (server) |
| Activate | First key action, e.g. project_created |
| Pay | purchase or subscription_started (server) |
One event per stage that cannot happen by accident.
Step 3: name events consistently and attach context
An event name should say what happened, in the past tense, in a fixed pattern such as object_action: project_created, invite_sent. Then attach the context you will want later as properties: plan, source, product area, whether the person was logged in.
Three naming habits prevent most clean-up work:
- One name per action. If the web sends
SignUpand the app sendssign_up, your journey splits in two. - Properties, not new events.
pricing_viewedwithplan=prois better thanpricing_pro_viewed. - A record of what you plan to send. A short tracking plan (event, trigger, properties, owner) is the cheapest data-quality tool there is.
Step 4: choose a window that matches how long buying takes
Journeys are not instant. A window decides how long after the first visit a signup still counts. In GA4, acquisition events default to a 30-day lookback and other key events to 90 days, selectable at 30 or 60 days, which shows that the right length depends on the event.
Measure yours instead of copying a default. Sample data: among the 310 people who signed up, the median time from first visit was 3 days and the 90th percentile was 19 days. A rule that works: set the window at least as long as the 90th percentile, rounded up to a clean number, here 30 days. A 7-day window would miss everyone who took longer than a week, which here is more than 10% of signups.
Step 5: read the funnel and the paths
With people as the unit and a 30-day window, count how many reach each stage.
Sample data: 1,000 people who first visited in the month.
| Stage | People | Rate from previous stage | Rate from first stage |
|---|---|---|---|
| Visited | 1,000 | — | 100% |
| Viewed pricing | 640 | 64.0% | 64.0% |
| Signed up | 310 | 48.4% | 31.0% |
| Activated | 186 | 60.0% | 18.6% |
| Paid | 74 | 39.8% | 7.4% |
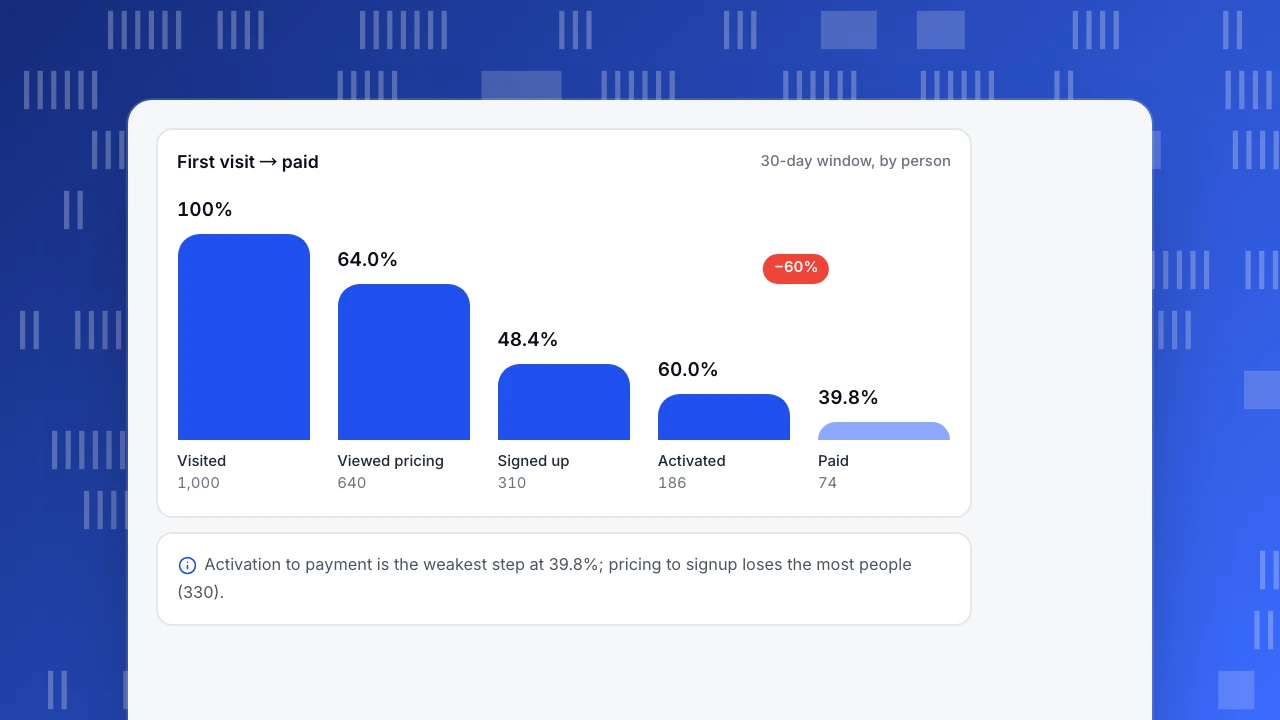
The weakest step is activation to payment, 39.8%, and the largest drop in people is pricing to signup, 330. Then look at how the 310 signups got there. Paths show the actual sequences, not the planned ones:
| Path to signup | People | Share |
|---|---|---|
| Blog → Pricing → Signup | 128 | 41.3% |
| Ad landing page → Signup | 74 | 23.9% |
| Blog → Signup | 61 | 19.7% |
| Email → Pricing → Signup | 47 | 15.2% |
Two findings are worth acting on: pricing sits on the path of 56.5% of signups ((128 + 47) ÷ 310), and the ad landing page converts people who never see pricing, so it should be tested as its own path. The related user flow article covers reading paths in more depth.
First visit → paid
30-day window, by personVisited
1,000
Viewed pricing
640
Signed up
310
Activated
186
Paid
74
Where journey tracking breaks
- Logged-out gaps. A person who browses logged out and buys on another device before ever logging in on the first one stays two people. Prompt for login earlier, or accept the limit and say so.
- Cross-domain hops. If checkout lives on another domain, the visitor ID can reset. Test one purchase end to end.
- Server events without a session. Events sent from your server with no session attached cannot be placed inside a stage that is measured by session. Send the session or visitor ID with them.
- Consent. If a person declines analytics, there is no journey to track; do not rebuild one from other data.
- Bots. Automated visits create journeys that stop at stage one and pull every rate down. Count real visitors only.
Test the journey with one real customer before you trust it
Run a three-part check after setup, and again after any release that touches login or checkout:
- Walk one journey end to end. Visit from a tagged link on your phone, view pricing, sign up on your laptop and pay. In the person's timeline you should see all steps in order under one ID. If the phone visit sits under a different person, the login call is not sent early enough.
- Reconcile the last stage with your billing system. Sample data: the funnel shows 74 paid, the billing export shows 74 orders. A difference above 2% means events are lost or duplicated.
- Compare people with visitor IDs. The ratio of device IDs to people should be stable from month to month (1.38 in the sample). A sudden jump means a release broke identification.
Fix these before you read any path. A journey chart built on a broken identity looks tidy and says nothing true.
Track the customer journey in TapCub
Follow the sample from first visit to payment.
- Identify at login. Call
tapcub.loginwith your internal customer ID after a successful login. From then on the person appears in All-platform analytics › Users › People, with a day-by-day behaviour timeline. One login ID is one person across web, app and mini program. Per the product documentation, identified mode may need to be turned on for the project by support. - Define the funnel. In All-platform analytics › Behavior › Behavior analysis, add the five proof events as steps and keep identity on person. The result shows each step's count, rate against the first step and the previous step, and median time between steps.
- Look at the paths. The path view lists the most common sequences forward from a start or backward from an end (2 to 10 steps, with the most frequent nodes kept at each step).
- Draw stages on a map. All-platform analytics › Business › Journey maps groups pages and events into up to 20 stages and shows reach, next-stage moves and error, frustration and exit rates. Reach is counted in sessions, and an event with no session ID never enters a stage.
- Add context. Source and UTM come from Web analytics › Sources.
TapCub does not run campaigns or send messages to move people along the journey. It records and reports what they did.
FAQ
How do you track a customer journey?
Define four to six stages, choose one event that proves each, recognise people across devices with a user ID sent at login, name events consistently, pick a window that matches how long buying takes and read the stage funnel and the common paths.
How do you track customers across devices?
Send your own user ID when the person logs in, so activity before and after login joins one record. Use an internal ID, not an email address. Without it, each browser and device is counted as a separate visitor and conversion rates are understated.
What events should I track for a customer journey?
One event per stage that cannot happen by accident: first visit with source, pricing viewed, signup completed, first key action and purchase. Fire account and money events from your server so a blocked or duplicated browser event cannot distort the numbers.
How long should the tracking window be?
Use at least the 90th percentile of the real delay from first visit to conversion. In the sample, that is 19 days, so a 30-day window works and a 7-day window would miss more than one signup in ten. Google's GA4 uses 30 days for acquisition events and 90 for others by default.
Can I track the customer journey without cookies?
Partly. You can recognise people after login through a user ID and still see sessions and paths, but anonymous browsing before login is limited by what the visitor's browser and consent settings allow. Report what you can see and name the gap.
Sources
- Google, About User-ID (GA4): how user IDs link activity across sessions and devices; uniqueness, 256-character limit, no identifying information. Checked 2026-11-21.
- Google, Attribution settings (GA4): lookback windows of 30 or 7 days for acquisition events and 90, 60 or 30 days for other key events. Checked 2026-11-21.
Was this article helpful?
We use your answers to fix and expand this page.
Couldn’t send. Please try again in a minute.
Thanks for the feedback. We’ll use it to improve this page.You’ve already sent feedback on this page. Thanks.

Customer Experience Consultant
Writes about live chat, visitor conversations, and self-service, sharing practical ways to make customer communication clearer and more effective.