Try it on your own data
Every report in this article is in the free plan. One snippet for web and apps, up to 10 sites.
Start freeTo speed up a website, find which part of your slowest page's Largest Contentful Paint is biggest (server response, late discovery, file size or render blocking), fix that part first and re-measure at the 75th percentile. In the worked example, four fixes take LCP from 4.2 s to 1.8 s, and the order matters more than the list.
What you will learn
- Target Core Web Vitals at P75: LCP 2.5 s or less, INP 200 ms or less, CLS 0.1 or less
- Split LCP into four parts: in the sample, delays are 40.5% of 4.2 s, so compressing images alone fixes the wrong part
- Rank fixes by seconds saved: 1.4 s from two cheap fixes, 2.4 s from four; confirm with conversion before booking extra orders
What does "fast enough" mean in numbers?
Before changing anything, set a target you can pass or fail. Google's web.dev defines three Core Web Vitals with "good" thresholds: Largest Contentful Paint (LCP) of 2.5 seconds or less, Interaction to Next Paint (INP) of 200 milliseconds or less, and Cumulative Layout Shift (CLS) of 0.1 or less. web.dev recommends judging them at the 75th percentile of page loads, split by mobile and desktop. That means a page is good only when three out of four real visits meet the threshold.
| Metric | What it measures | Good |
|---|---|---|
| LCP | When the biggest visible element has loaded | ≤ 2.5 s |
| INP | How long the page takes to respond to clicks and taps | ≤ 200 ms |
| CLS | How much the layout jumps while loading | ≤ 0.1 |
"Three seconds" and "as fast as possible" are not targets. Use the three numbers above, measured on real visits, and fix the one that fails first.
Which number should you measure and where?
A lab test (running one page once on a test machine) is good for finding causes. Field data (what real visitors experienced) is what the thresholds apply to, and it can differ a lot because visitors use slower phones and networks than your laptop.
Measure in this order:
- Take the P75 of LCP, INP and CLS for the whole site from real-user data.
- Break it down by page, device and country. A site average hides the page that fails.
- Sort pages by P75 LCP and start with the slowest page that has the most traffic.
- Only then run a lab test on that page to see the waterfall.
Sample data: 50,000 sessions in a month, with the P75 LCP of the pricing page at 4.2 seconds, 1.7 seconds over the target. The rest of this article uses that page.
Where do the 4.2 seconds go?
web.dev splits LCP into four parts: time to first byte (TTFB), resource load delay (how long before the browser starts fetching the LCP image or text), resource load duration (how long that fetch takes) and element render delay (how long after loading before it is painted). Its guideline is that roughly 40% of LCP is TTFB, roughly 40% is resource load duration, and the two delays should each be under 10%. The percentages are guidelines, not strict rules.
Sample data for the pricing page:
| LCP part | Seconds | Share of 4.2 s | Guideline |
|---|---|---|---|
| TTFB | 1.4 | 33.3% | ~40% |
| Resource load delay | 0.9 | 21.4% | < 10% |
| Resource load duration | 1.1 | 26.2% | ~40% |
| Element render delay | 0.8 | 19.0% | < 10% |
| Total | 4.2 | 100% |
Add the two delays: 0.9 + 0.8 = 1.7 s, or 40.5% of the total, against a guideline of under 20%. The page is not mainly slow because of big files. It is slow because the browser finds the hero image late and waits for something to unblock painting. Compressing images alone would attack the wrong 26%.
Which fixes come first when ranked by seconds saved?
Rank fixes by the seconds they remove from the failing page divided by the effort. For the sample page:
| Order | Fix | Part it shortens | Before → after | Saves | LCP after |
|---|---|---|---|---|---|
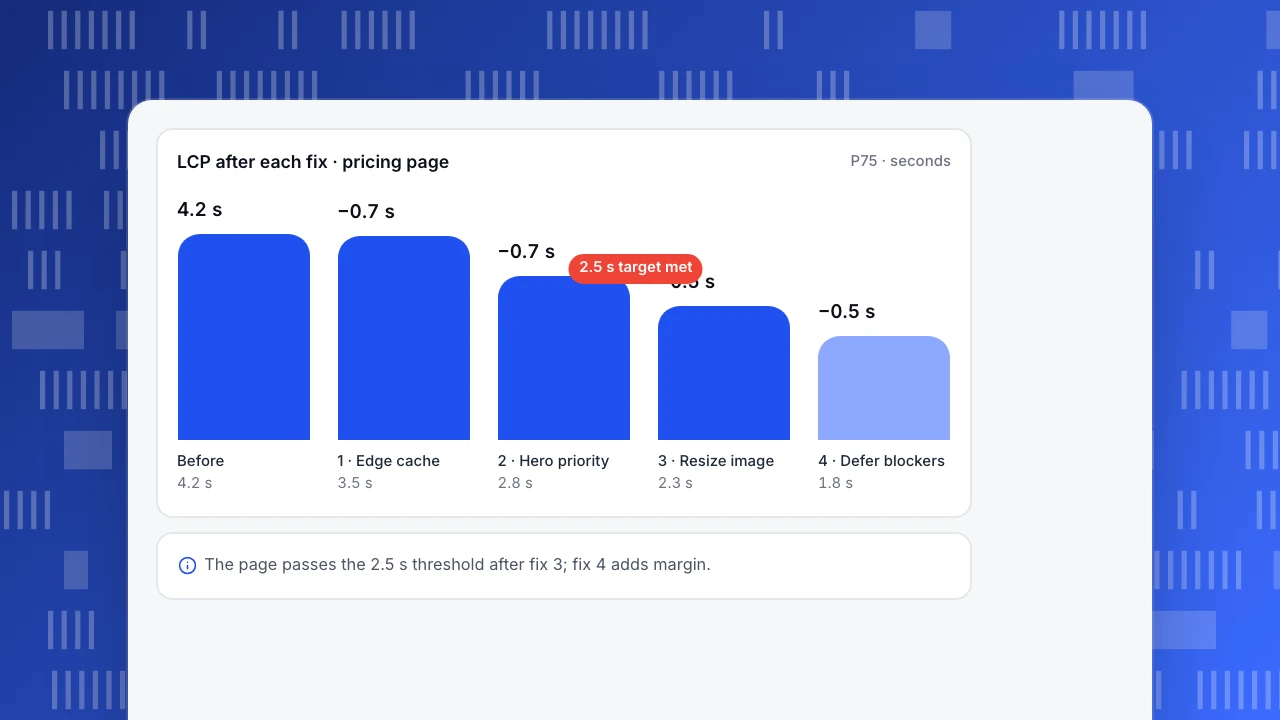
| 1 | Cache the HTML at the edge | TTFB | 1.4 → 0.7 s | 0.7 s | 3.5 s |
| 2 | Stop lazy-loading the hero image and give it high priority | Resource load delay | 0.9 → 0.2 s | 0.7 s | 2.8 s |
| 3 | Serve the hero at its display size in a modern format | Resource load duration | 1.1 → 0.6 s | 0.5 s | 2.3 s |
| 4 | Defer render-blocking CSS and scripts | Element render delay | 0.8 → 0.3 s | 0.5 s | 1.8 s |
Total saving 2.4 s, from 4.2 s to 1.8 s. The page passes 2.5 s after fix 3. If your team can only do two fixes this sprint, pick 1 and 2: together they remove 1.4 s for the least work and bring LCP to 2.8 s, still over the 2.5 s line, so fix 3 comes next. Your numbers will differ. The ranking method is the useful part: find the biggest slice, then the cheapest way to shrink it.
LCP after each fix · pricing page
P75 · secondsHow do you do the four LCP fixes?
1. Cut TTFB. Cache full HTML pages at a CDN edge or in the server, so a visitor in another country does not wait for your origin. Remove slow database calls from pages that do not need them. Check TTFB by country, because a good global average can hide one region at 3 s.
2. Make the LCP element discoverable. If the hero image is a CSS background, injected by JavaScript or marked loading="lazy", the browser finds it late. Put it in the HTML as an <img>, remove lazy loading from anything visible on first screen, and mark it as high priority. This often shrinks the load delay without touching file size.
3. Shrink the LCP resource. Resize the image to the largest size it is displayed at, offer smaller versions for phones with srcset, and use a modern format. Do this after fixes 1 and 2 unless the duration is your largest slice.
4. Remove render blockers. Inline the small amount of CSS needed for the first screen, load the rest without blocking, and add defer to scripts that do not need to run before paint. Check which third-party tags run before the page paints.
What about slow clicks and shifting layouts?
If INP is above 200 ms, the main thread is busy when people interact. The usual causes are third-party scripts (tag managers, chat widgets, A/B scripts), large framework updates and long tasks. Remove tags nobody uses, load the rest after the first interaction or when idle, and split long tasks so the browser can respond between them.
If CLS is above 0.1, something moves after it appears. Set width and height (or an aspect ratio) on images, video and embeds, reserve space for banners and ads, and avoid inserting content above what the visitor is already reading.
Quick triage rule: LCP fails → fix loading order and TTFB. INP fails → reduce JavaScript work. CLS fails → reserve space. A page that fails two should fix the cheaper one first, then re-measure, because fixing one often changes the other.
What is a faster page worth?
A better score is only worth the effort if conversion moves with it. Check that with your own data before promising anyone extra orders.
Sample data: 50,000 sessions split by load time, with orders and conversion:
| Load time | Sessions | Orders | Conversion |
|---|---|---|---|
| Under 2 s | 20,000 | 680 | 3.4% |
| 2–3 s | 14,000 | 406 | 2.9% |
| 3–4 s | 9,000 | 198 | 2.2% |
| Over 4 s | 7,000 | 105 | 1.5% |
| All | 50,000 | 1,389 | 2.78% |
If fixes move 60% of the slowest group (4,200 of 7,000 sessions) into the 2–3 s group, the estimate is 4,200 × (2.9% − 1.5%) = 58.8 extra orders, which is 4.2% more than 1,389. Treat this as an upper bound: people with faster loads also tend to have better phones and connections, so part of the conversion gap is not caused by speed.
There is real evidence that speed changes outcomes. Vodafone ran an A/B test on its landing page where the only difference was a Web Vitals optimization. LCP improved by 31% (5.7 s against 8.3 s), sales rose 8%, the lead-to-visit rate rose 15% and the cart-to-visit rate rose 11%, according to web.dev's case study. That is one company's result, not a promise, but it shows why the method is a test and not a guess. If your site is slow because of hosting or page weight, also read page speed and SEO and the Speed Index definition.
| Load time | Sessions | Orders | Conversion |
|---|---|---|---|
| Under 2 s | 20,000 | 680 | 3.4% |
| 2–3 s | 14,000 | 406 | 2.9% |
| 3–4 s | 9,000 | 198 | 2.2% |
| Over 4 s | 7,000 | 105 | 1.5% |
Sample data: 50,000 sessions, 1,389 orders (2.78%). Moving 4,200 of the slowest sessions to 2–3 s is worth at most 58.8 orders (+4.2%).
How do you check that a fix worked?
- Write the baseline: P75 LCP, INP and CLS for the page, and its conversion rate, over the last 14 days.
- Ship one fix at a time, or a group of fixes with an annotation on the date.
- Wait for enough visits. P75 jumps around when a page has few samples; compare 14 days before with 14 days after on the same page and device.
- Compare conversion on the same page. If speed improves and conversion does not move, the fix may still be right for SEO, but you should not book the extra orders.
- Keep the target as an alert, not a one-off project. A new tag or an unoptimized hero image can undo the gain in a week.
How do you find and watch slow pages in TapCub?
The pricing-page example above is the workflow, with your own pages.
- Open Monitoring › Performance. The numbers come from real loads in your visitors' browsers, not a lab run. Look at P75 and the share rated good for LCP, INP, CLS, First Contentful Paint and Time to First Byte; the thresholds on the cards match the ones above.
- Use the breakdown by page, country, device, browser and operating system to find where the failing visits are. The Slowest pages list is sorted by P75 LCP, so a page like the pricing page in the sample would sit at the top.
- Read the load timing split into backend (time to first byte), network transfer and frontend render. A big backend slice points to fix 1; a big frontend slice points to fixes 2 to 4.
- Open Monitoring › Errors to see whether the slow page also throws script errors or collects frustration clicks, and check Web analytics › Pages to see if the same pages are losing people.
- After you ship a fix, add a date annotation under Configuration › Annotations so the change is visible on the trend, and compare the same page before and after.
TapCub measures speed; it does not change it. It does not host your site, compress images or run a CDN. If the script is blocked, the Performance page is empty, because server time is not substituted for visitor timing.
FAQ
How can I speed up my website quickly?
Start with the slowest high-traffic page and find which LCP part is largest: TTFB, load delay, load duration or render delay. Cache pages at a CDN, remove lazy loading from the hero image, resize images to their displayed size, and defer render-blocking scripts. Measure P75 before and after.
What is a good page load time?
Google's web.dev treats LCP of 2.5 seconds or less as good, judged at the 75th percentile of real page loads. INP should be 200 ms or less and CLS 0.1 or less. These apply to field data from real visitors, not to a single lab run.
Does website speed affect conversion?
It can. In an A/B test described by web.dev, Vodafone's LCP improved by 31% and sales rose 8%. Your own effect depends on the starting point and traffic. Compare conversion by load-time bucket, then confirm with a before and after test on the same page.
What slows down a website the most?
It depends on the page, which is why you measure before fixing. Common causes are a slow server response, a hero image discovered late or too large, render-blocking CSS and scripts, and third-party tags that keep the main thread busy.
Should I test speed on mobile or desktop?
Both, but start with mobile. web.dev recommends segmenting Core Web Vitals by mobile and desktop because mobile visitors often have slower devices and networks. Optimize for the segment with the failing P75 and the most visits.
Sources
- web.dev, Web Vitals: Core Web Vitals "good" thresholds (LCP 2.5 s, INP 200 ms, CLS 0.1) and the 75th percentile recommendation. Checked 2026-11-21.
- web.dev, Optimize Largest Contentful Paint: the four LCP subparts and their guideline shares. Checked 2026-11-21.
- web.dev, Vodafone: 31% improvement in LCP increased sales by 8%: A/B test results (LCP 5.7 s vs 8.3 s, sales +8%, lead-to-visit +15%, cart-to-visit +11%). Checked 2026-11-21.
Was this article helpful?
We use your answers to fix and expand this page.
Couldn’t send. Please try again in a minute.
Thanks for the feedback. We’ll use it to improve this page.You’ve already sent feedback on this page. Thanks.

Product Experience Specialist
Writes about product experience, practical workflows, and growth, turning complex processes into clear steps for everyday decisions.