Analytics · Page 5
How metrics are defined, where numbers disagree, and how to read a funnel or a retention curve without fooling yourself.
This category covers the mechanics of measurement: what a visitor is, why sessions differ between tools, how to build a funnel that survives scrutiny, and how to spot bot traffic before it skews a decision. Every article uses the same sample dataset you see in the product, so you can reproduce the reasoning in your own workspace.
Articles in Analytics
304 articles · page 5 of 7
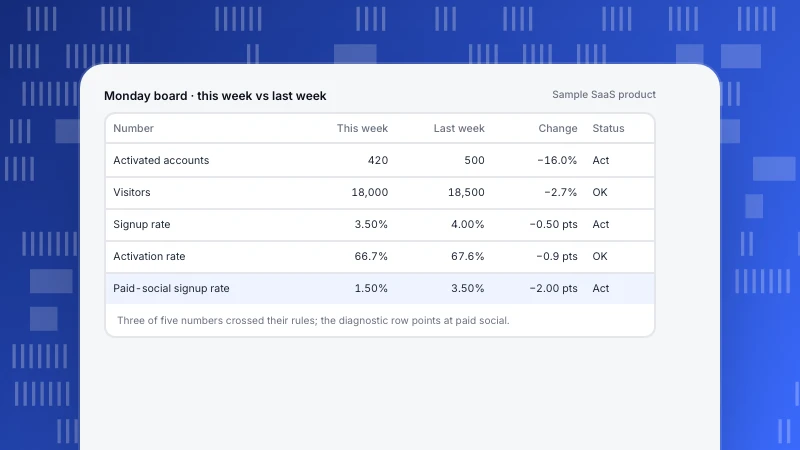
Business Dashboard: How to Build One Around a Decision, Not a Metric List
A business dashboard should serve one decision. Five design rules, a three-layer structure from north star to diagnostics, a layout with rules and owners, and a worked week that finds the cause in two minutes.
Read more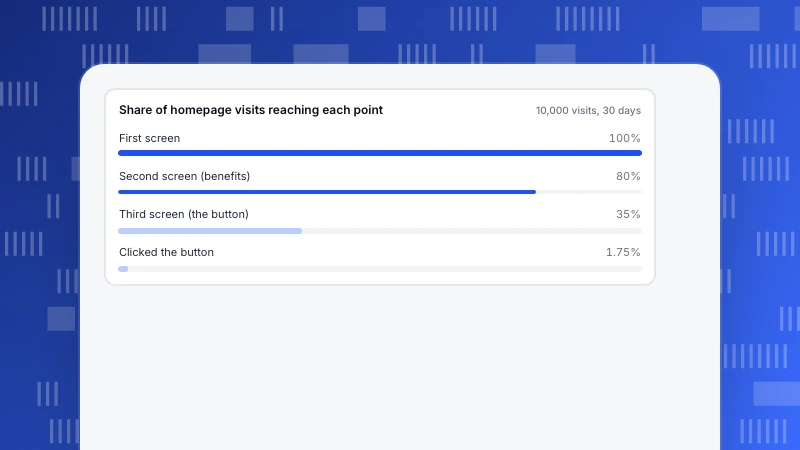
Best Homepage Design: There Is No Single Best, So Test Yours With Data
No homepage design is best for everyone. Six parts every homepage has, what data tests each one, and a worked example showing why a call to action in the third screen gets capped by scroll reach.
Read more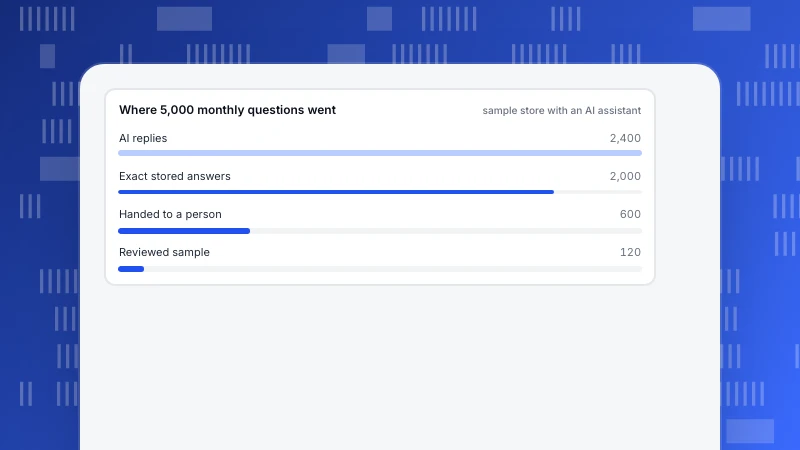
AI Data Governance: Five Controls, Inputs First and Outputs Second
AI data governance adds three questions to ordinary governance: what data reaches the model, whether outputs can be traced, and whether a person checks them. See five controls, a review-sampling example with numbers and what to write in your input rules.
Read more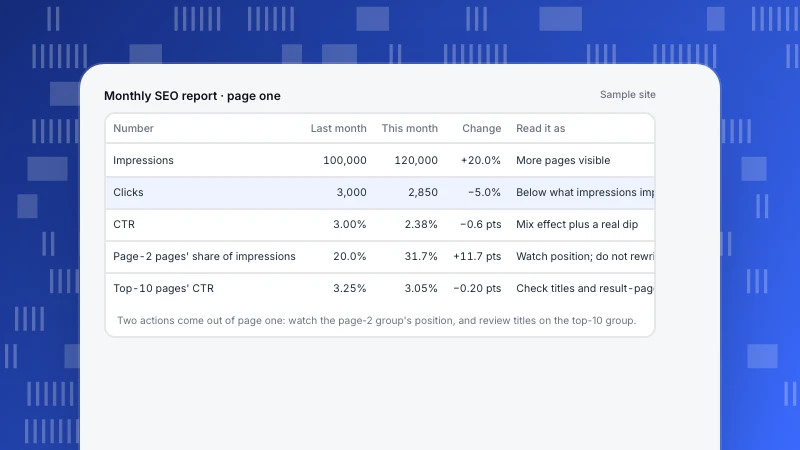
SEO analytics reporting: what to put in a monthly report so it leads to action
A good SEO report puts a decision after every number. The four-part structure, 6–8 metrics with definitions, how to read impressions up and clicks down, and how to write next month's actions.
Read more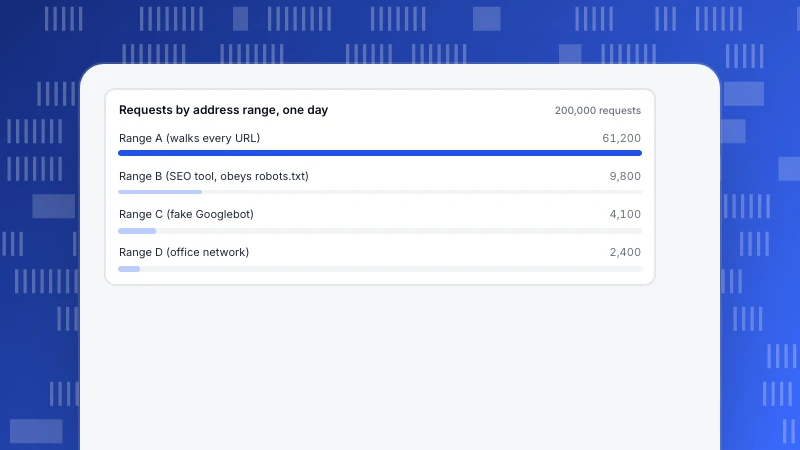
How to prevent web scraping: find who, then decide what to block
Preventing web scraping starts with measuring who is fetching what. Signals that separate scrapers from normal traffic, a one-day example, layered defences with their side effects, and what TapCub can and cannot see.
Read more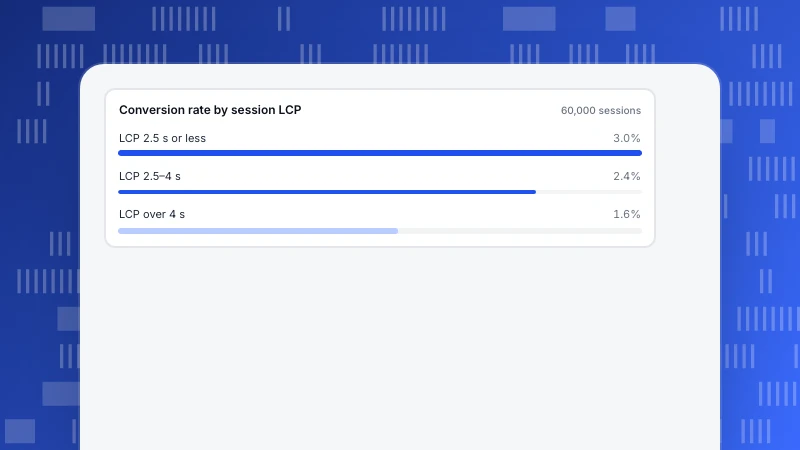
Does page speed affect SEO? What to measure before you optimize
Page speed affects SEO through two narrow routes: page experience as a tie-breaker and crawl capacity on very large sites. What Google says, the three metrics, a decision table and a before-and-after example with a control group.
Read more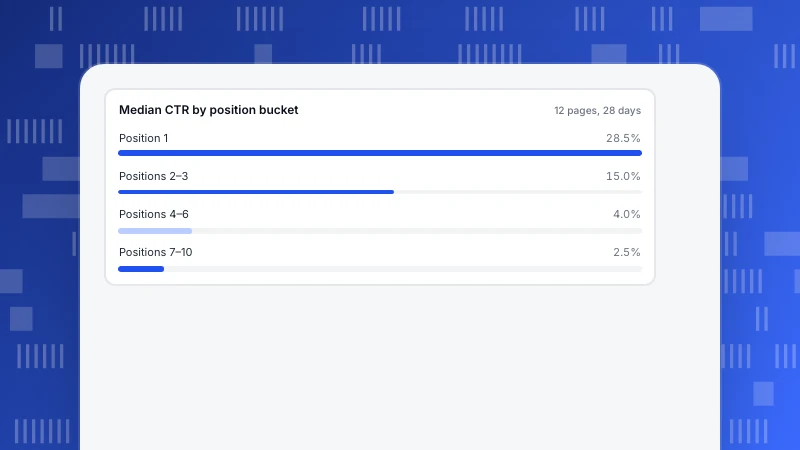
Organic CTR: how to tell whether your click-through rate is good
There is no standard organic CTR: it changes with position, intent and the result page. How to compare a page with the same-position median on your own site, diagnose title vs ranking, and test a change.
Read more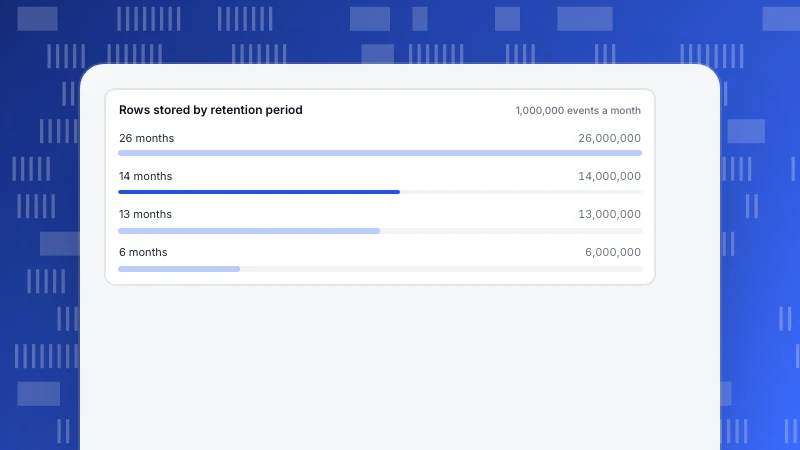
GDPR compliance checklist: four written answers, not a tick list
A GDPR compliance checklist is four written answers: what you collect, why, how long you keep it and how you delete it. A nine-row checklist with article numbers, a statistics-tool self-check and a retention example.
Read more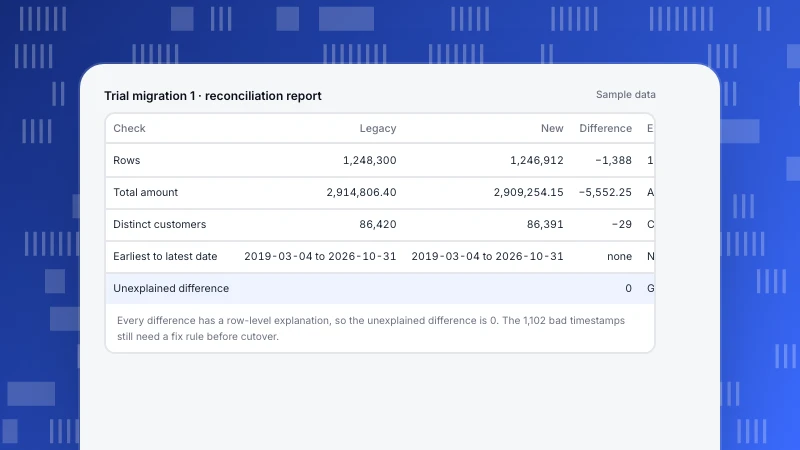
Data migration project: a five-phase plan with reconciliation checks
A data migration project succeeds on the inventory before it and the reconciliation after it. Five phases with gates, a worked reconciliation, rollback conditions, an eight-week timeline and how to run it for analytics.
Read more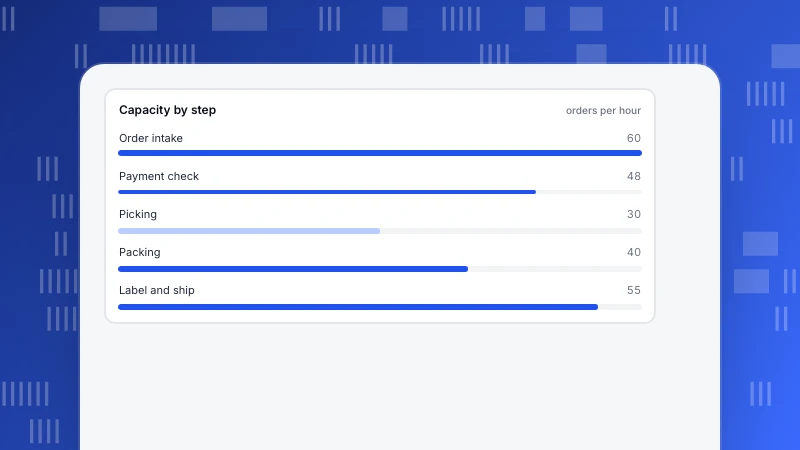
What Is a Bottleneck in Business? How to Find the Slowest Step With Data
A bottleneck is the one step that caps the output of a whole process. Four types, a worked five-step example, how to find it with conversion and wait-time data, and what fixing it is worth.
Read more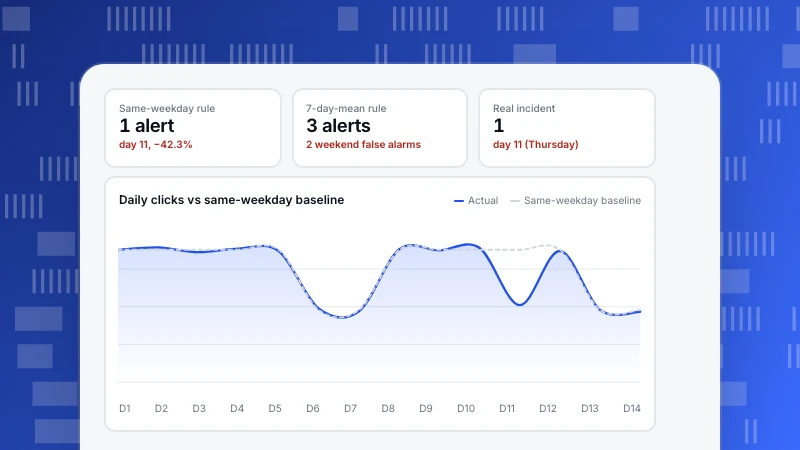
Automated SEO monitoring: four signals to watch and the alert rules to set
Automated SEO monitoring only helps if you know what to watch and what change should wake someone up. Four signal types with starting thresholds, why weekday and rank noise cause false alarms, and how to test a rule first.
Read more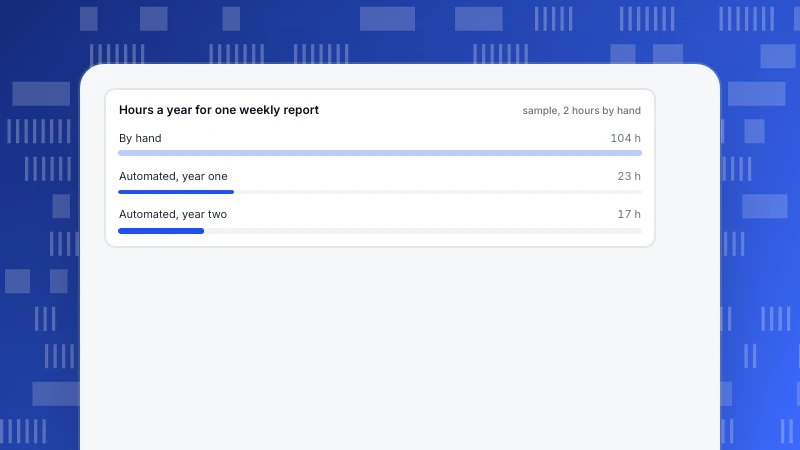
Automated Reports: Fix the Definitions First, Then Schedule Them
Automated reports build themselves and arrive on a schedule, which also repeats any wrong definition faster. Four steps, a one-page definitions table, a frequency guide and a recomputed time-saved example.
Read more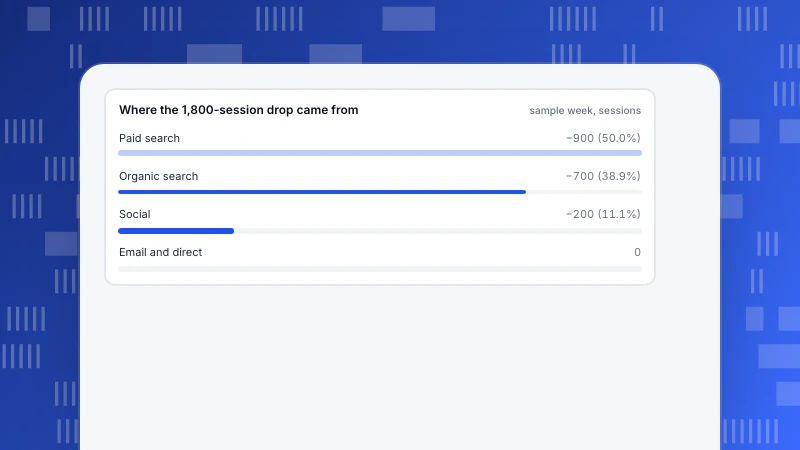
AI Marketing Analytics: What It Can Do, and How to Check Its Answers
AI marketing analytics is safest as a way to ask your data, not to decide for you. Four uses and how far to trust each, how to phrase a question, an 18% traffic drop split by channel, and six checks before you act.
Read more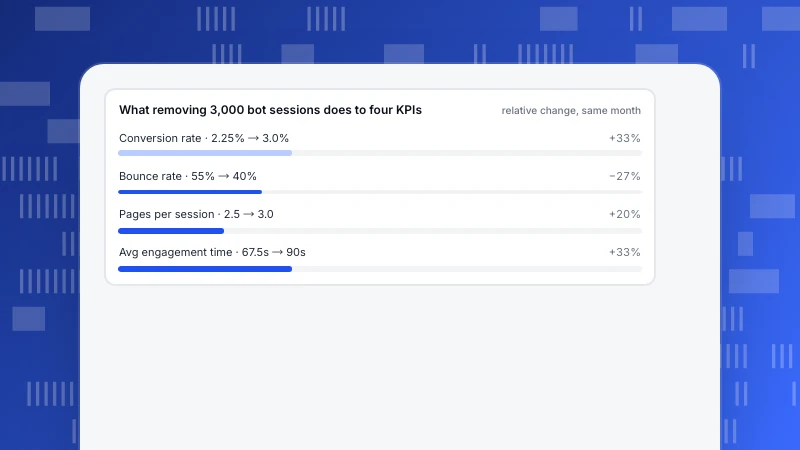
Website KPIs: how to choose the few numbers that matter
Pick website KPIs backward from the job your site must do: one primary KPI, three to five explainers, clean denominators, and targets you can recompute. With KPI trees for four site types and two worked examples.
Read more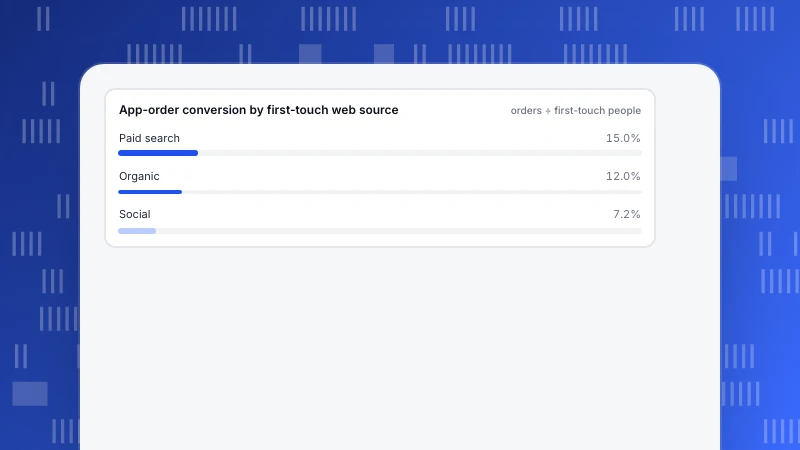
Omnichannel analytics: connect the same person before comparing channels
Omnichannel analytics unifies web, app and mini-program data into one person-level journey. Why per-channel reports double-count people, how to stitch identity and events, a recomputable cross-channel example with four attribution models, and the limits.
Read more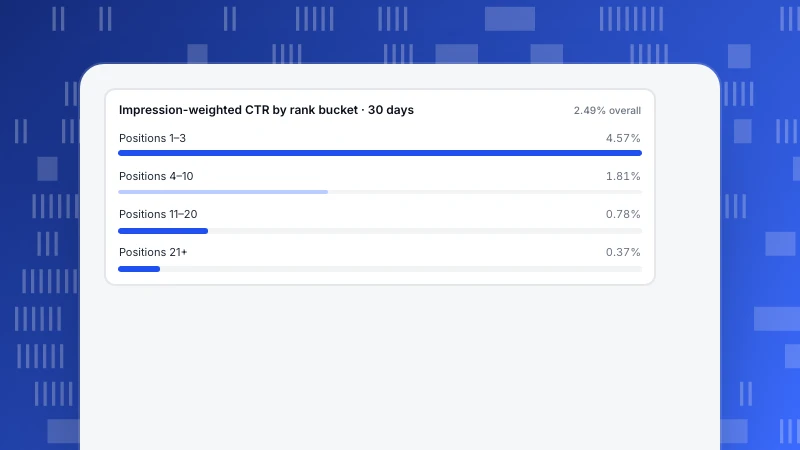
Keyword Performance Report: Template, Worked Example, and Monthly Cadence
A keywords performance report should answer one question: which page do I change next? Here is a nine-column template, a 20-query example with impression-weighted CTR by rank bucket, and a monthly cadence — every number recomputable.
Read more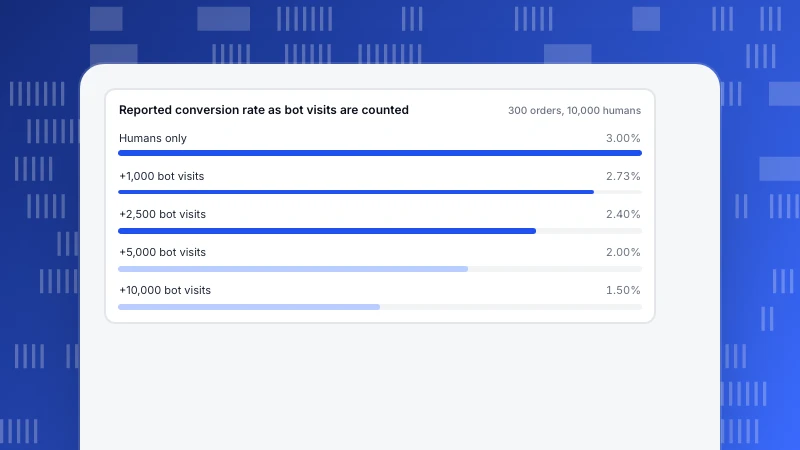
Types of bias in data analysis: the four stages and what to check first
Bias in data analysis enters at one of four steps: sampling, measurement, analysis or interpretation. A table of each type with examples, a worked bot-traffic calculation and a checklist for your own reports.
Read more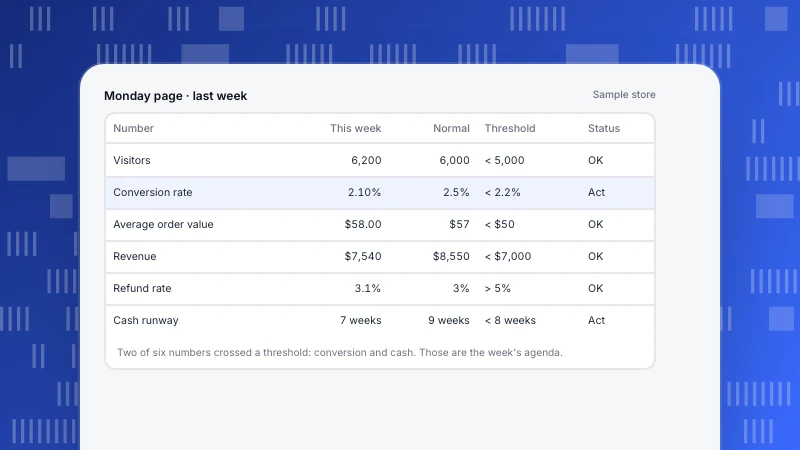
Small business dashboard: 5–7 numbers that tell you when to act
A small business dashboard needs five to seven numbers, each answering whether to act this week. How to pick them, examples for three business types, thresholds and actions, and a worked week.
Read more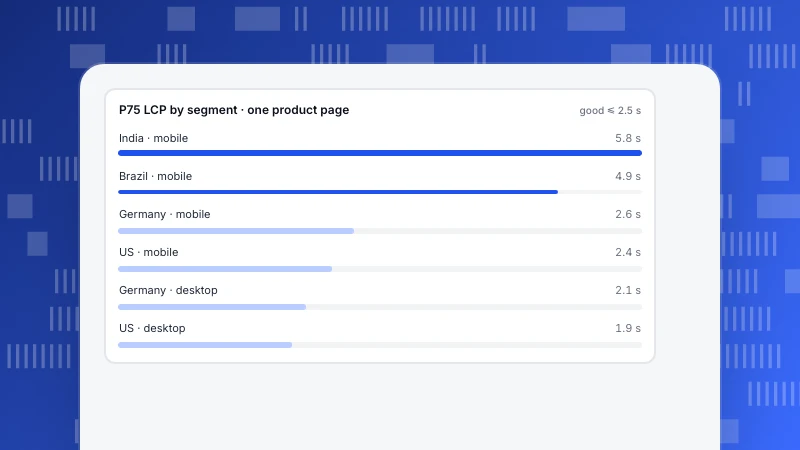
Slow loading websites: find who is slow and where before you fix anything
Why websites load slowly: the server, resource downloads or the browser's main thread. A diagnosis tree, real-user data split by country and device, and the order to fix things in.
Read more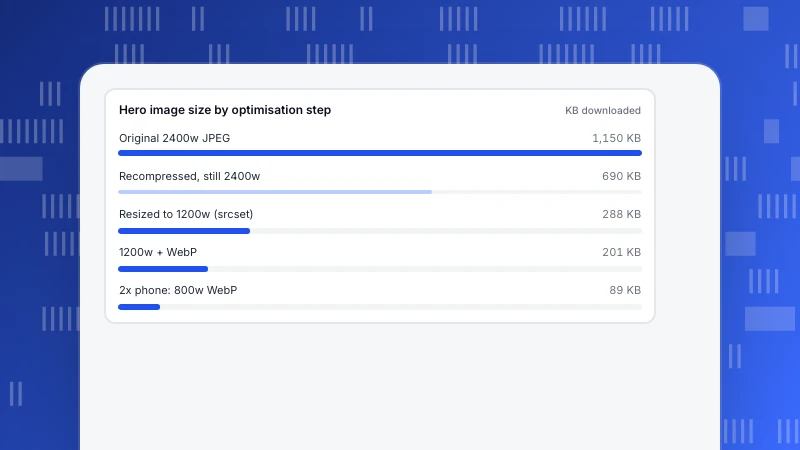
How to optimize images for web: fix size and priority before format
The order that matters when you optimize images for the web: right dimensions with srcset, hero image loaded first, then format and compression. A worked example shows why, plus how to check LCP afterwards.
Read more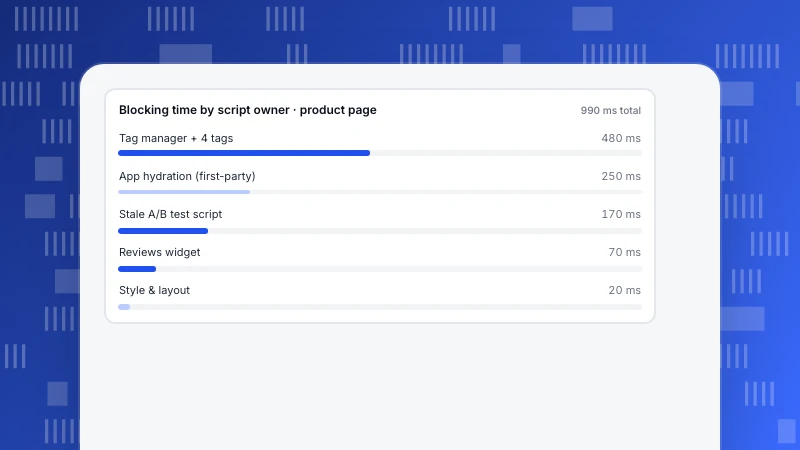
Minimize main thread work: find the long tasks before you fix anything
What Lighthouse's 'minimize main-thread work' audit measures, why it shows up as slow interactions (INP), how to attribute long tasks to the scripts that own them, and which fixes pay off first.
Read more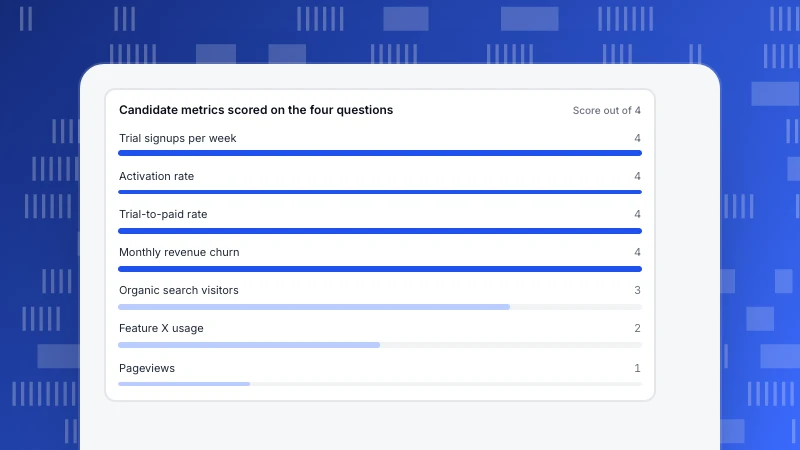
Difference between metrics and KPIs: four questions that decide
Every KPI is a metric, but only a metric with a target, one owner and a threshold that triggers action is a KPI. Four questions, a worked 12-to-4 shortlist and how to calculate an alert threshold.
Read more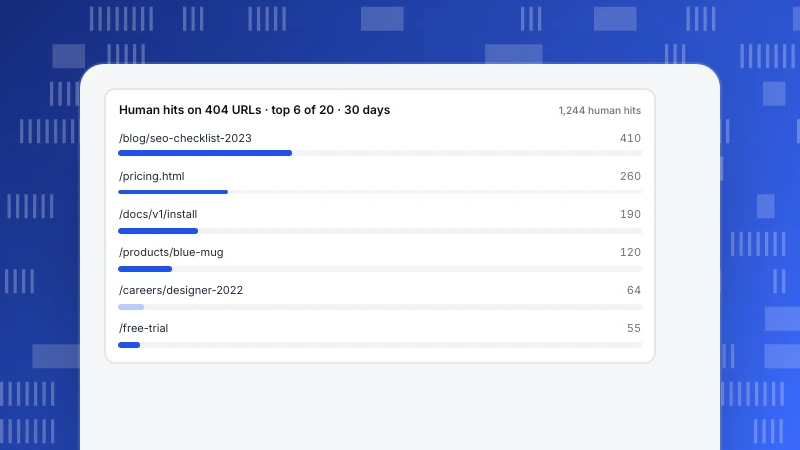
How to fix error 404: which 404s to redirect and which to leave
What a 404 error means, what visitors can do, and how site owners decide which 404s to fix: rank by real visits, crawler hits and backlinks, 301 the valuable ones, and leave the rest.
Read more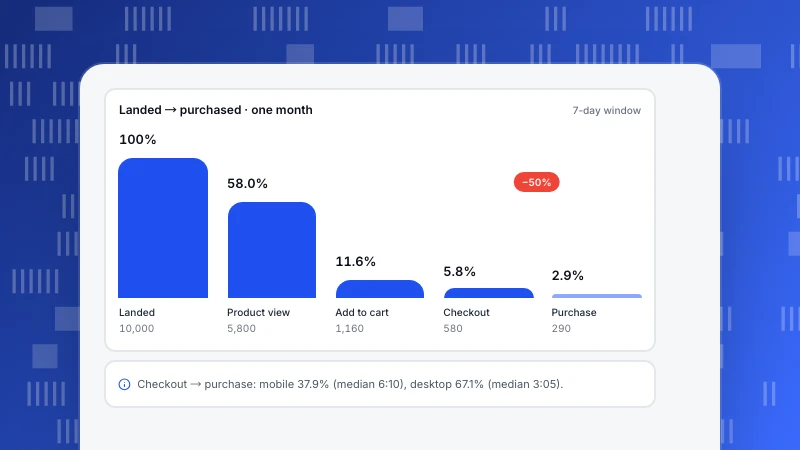
Ecommerce customer journey: find the leak that costs the most
The ecommerce customer journey runs from first visit to repeat order. How to turn each stage into a funnel step, read conversion and time together, and find the leak worth fixing first, with a worked 10,000-session example.
Read more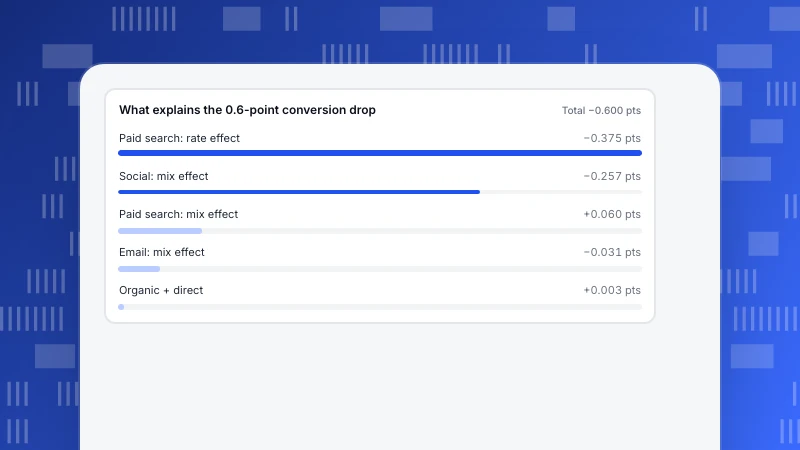
Data analysis report: how to write one people read and can check
A data analysis report should be written upside down: answer and recommendation first, method last, with the time range, denominator and filters behind every number. Template, definitions checklist and a worked example.
Read more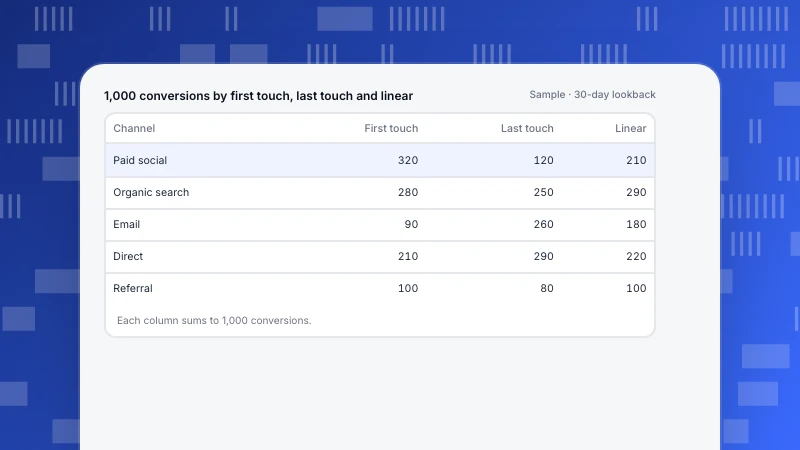
Multi-touch attribution: models compared on one customer journey
Multi-touch attribution shares the credit for a conversion across the touchpoints that led to it. Every common model applied to the same journey with numbers, how channel rankings change between models, what MTA cannot measure, and how to set it up.
Read more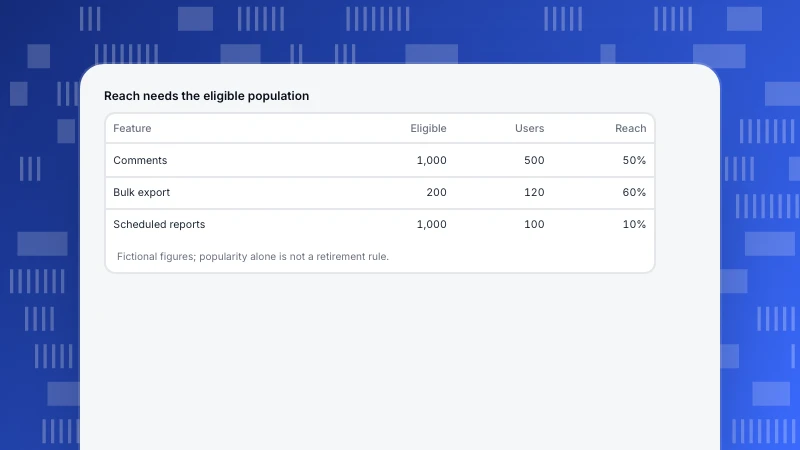
Product feature analysis: a matrix for keep, improve or retire
Compare feature reach, repeat use, quality and dependencies. Includes a product feature analysis matrix and safeguards against unsupported causal claims.
Read more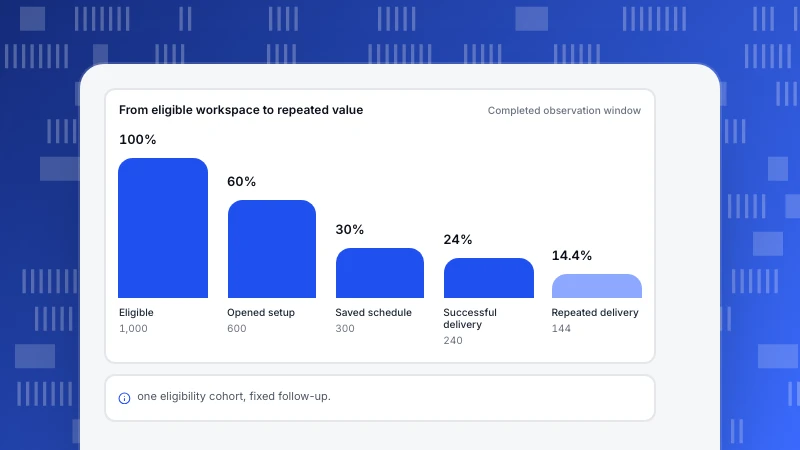
Product adoption dashboard: a template with exact denominators
Build a product adoption dashboard with eligible users, first value, repeat use and cohort windows. Includes a reproducible sample and decision template.
Read more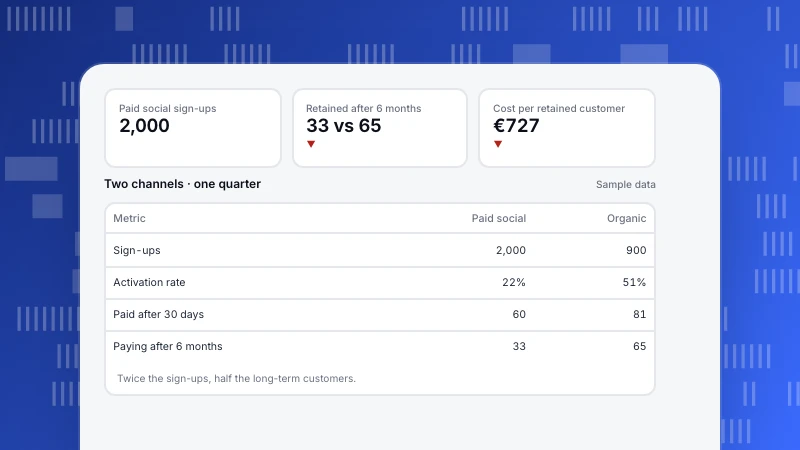
Product analytics vs marketing analytics: differences and why to join them
Product analytics vs marketing analytics: a side-by-side comparison, where they overlap, why joining them on one identity matters, and a channel example.
Read more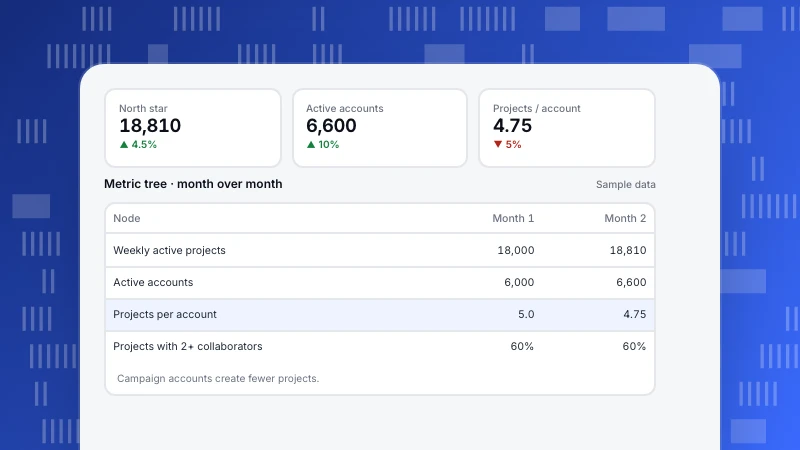
Product analytics framework: how to choose metrics that drive decisions
A product analytics framework connects goals to metrics, behaviors and events. North Star, AARRR, HEART and metric trees compared, five steps to build your own, and a metric tree example.
Read more
Analytics for product managers: metrics, analyses and a weekly routine
What product managers should measure, the six analyses every PM should be able to run, a weekly analytics routine and an example of sizing a roadmap item with data.
Read more
Product analytics examples: 8 questions, analyses and decisions
Eight product analytics examples, each with the question, the analysis, a sample result and the action: funnels, retention, adoption, attribution, paths, lifecycle, conversion and distribution.
Read more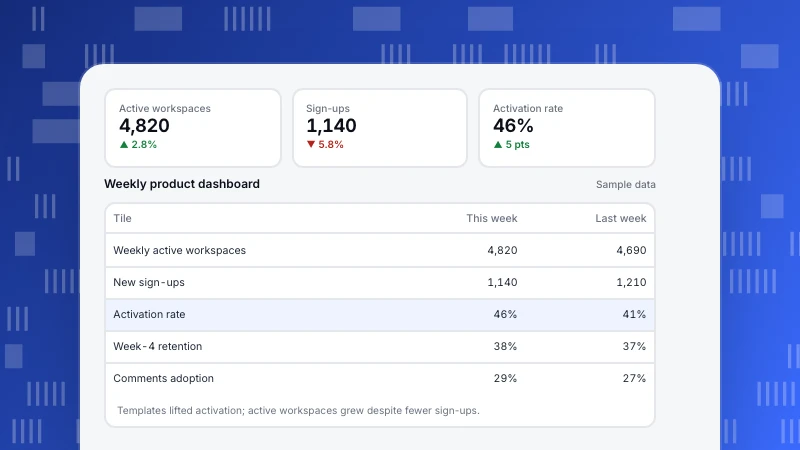
Product analytics dashboard: what to include and an example
What to put on a product analytics dashboard: north star, activation, engagement, adoption, retention, revenue and quality. Six steps to build it and a weekly example.
Read more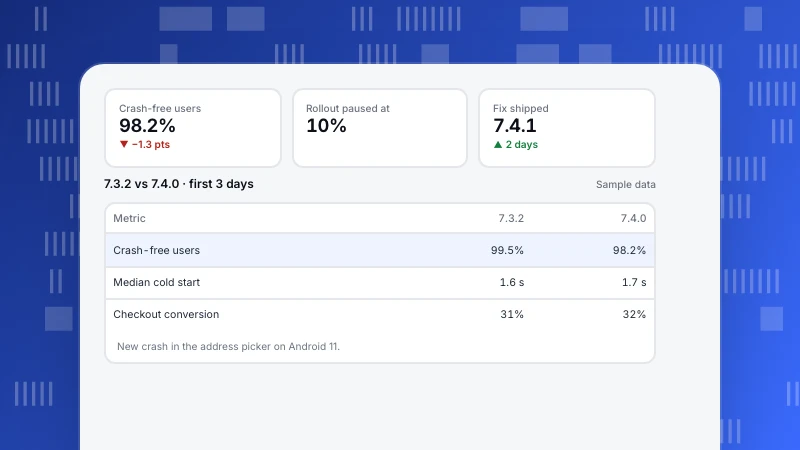
App versioning: best practices and how to compare releases
App versioning explained: version vs build number, semantic versioning for apps, nine best practices, what to compare per release and a staged rollout example.
Read more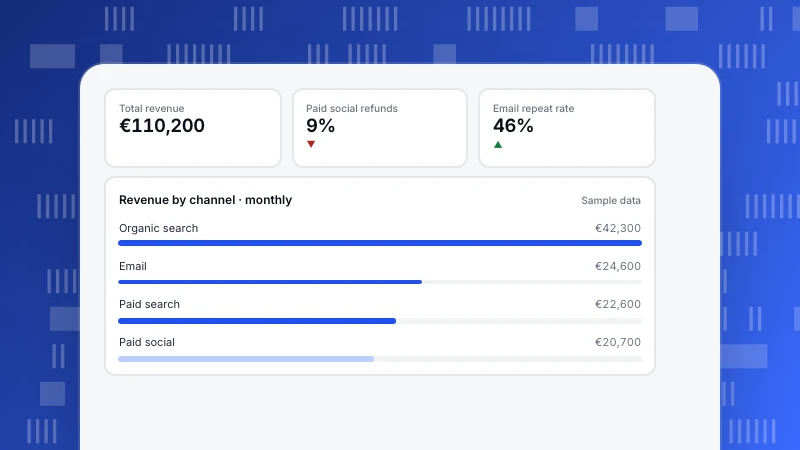
Ecommerce analytics: metrics, reports and how to set it up
Ecommerce analytics joins traffic, behavior and transactions. The metrics and formulas that matter, five reports every store needs, setup steps and a channel-quality example.
Read more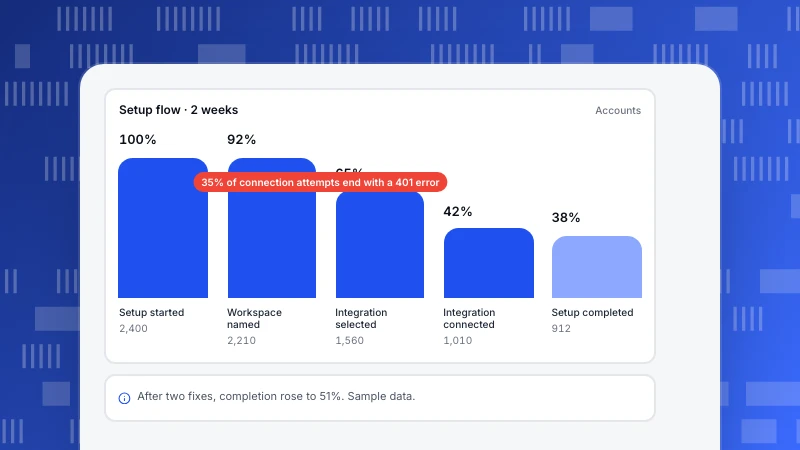
User behavior tracking: what to track, methods and privacy
What user behavior tracking is, which behaviors to track, six tracking methods compared, how to set it up with privacy in mind, and a setup-flow example.
Read more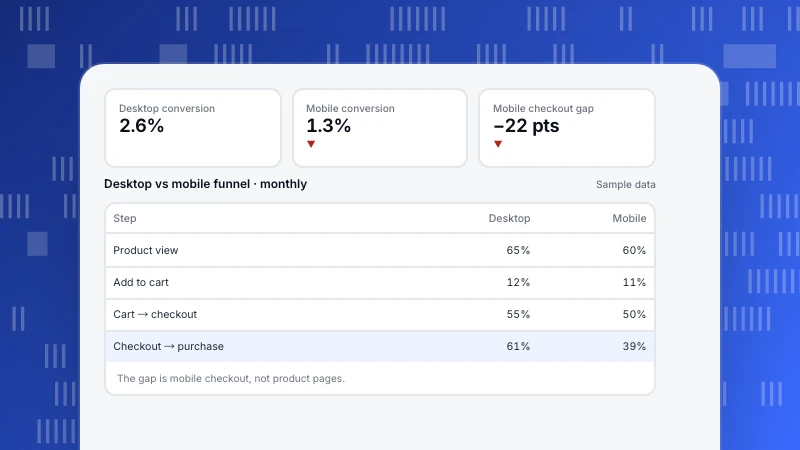
Ecommerce funnel: stages, metrics and how to find the leak
The ecommerce funnel from visit to purchase and repeat: stage metrics with formulas, how to build and segment it, and a device-split example that points to the real leak.
Read more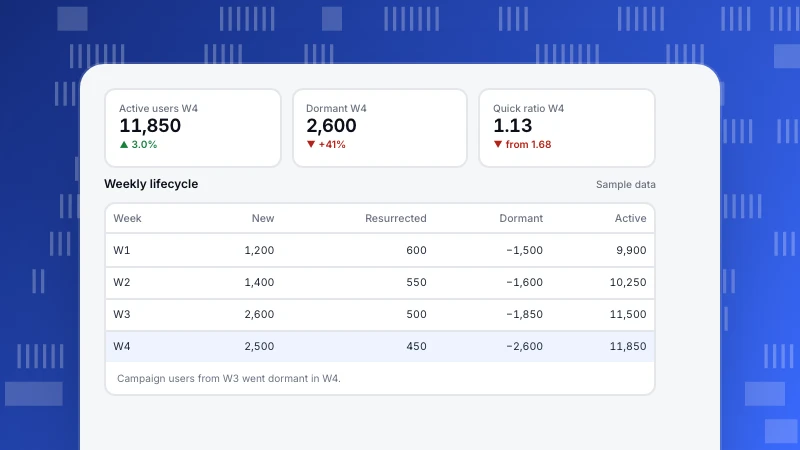
User status segmentation: new, returning, resurrected and dormant users
User status segmentation classifies users as new, returning, resurrected, at risk or dormant each period. Definitions, the growth accounting identity, actions per status and a weekly example.
Read more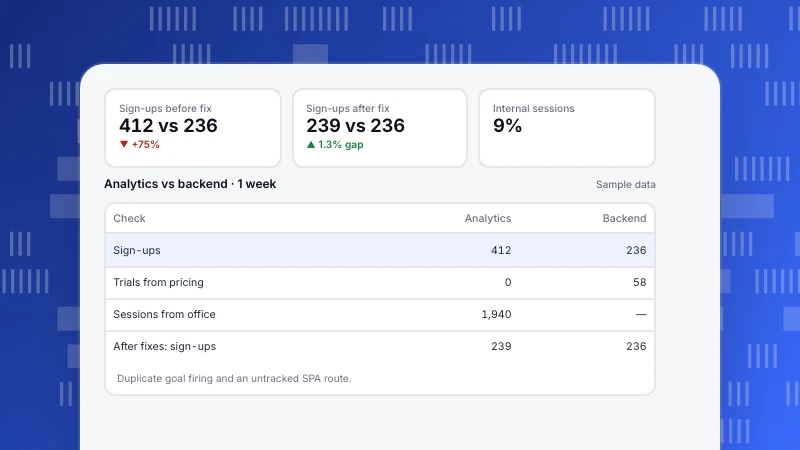
Implementing web analytics: an 8-step plan and checklist
How to implement web analytics properly: questions, tracking plan, installation, events and goals, data hygiene, privacy and verification against your backend, with a worked example.
Read more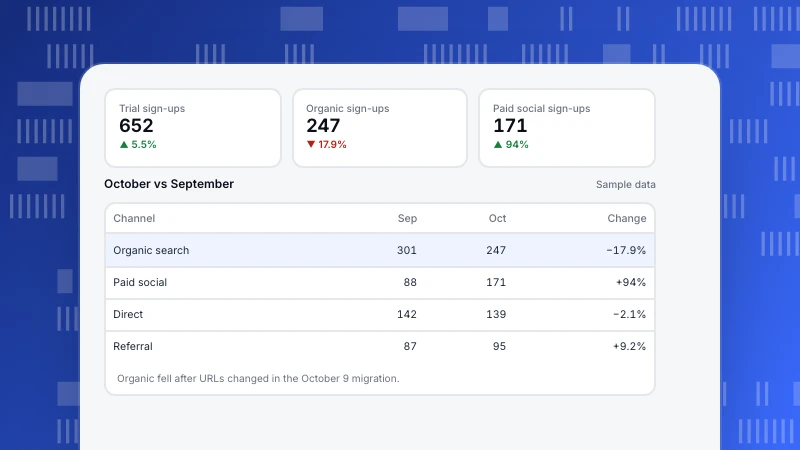
Web analytics report: what to include, types and an example
How to write a web analytics report that leads to action: report types by audience, what to include, six steps and a one-page monthly example.
Read more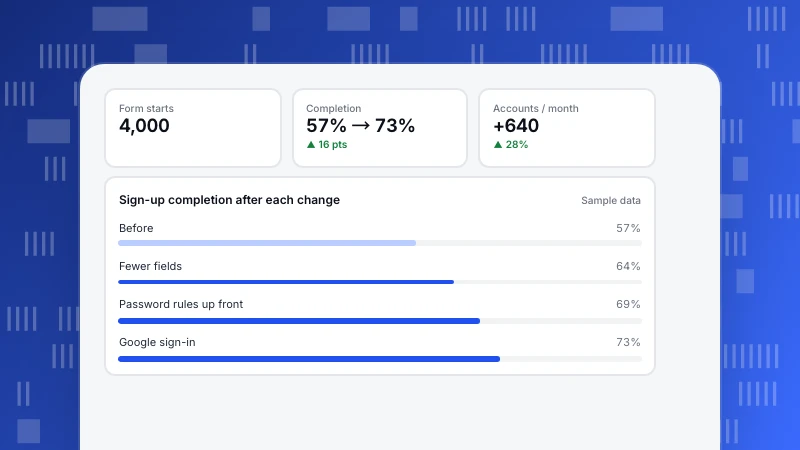
UX optimization: how to improve user experience with data
UX optimization finds where users struggle and removes the friction, one measured change at a time. The metrics to track, ten techniques, the optimization loop and a sign-up form example.
Read more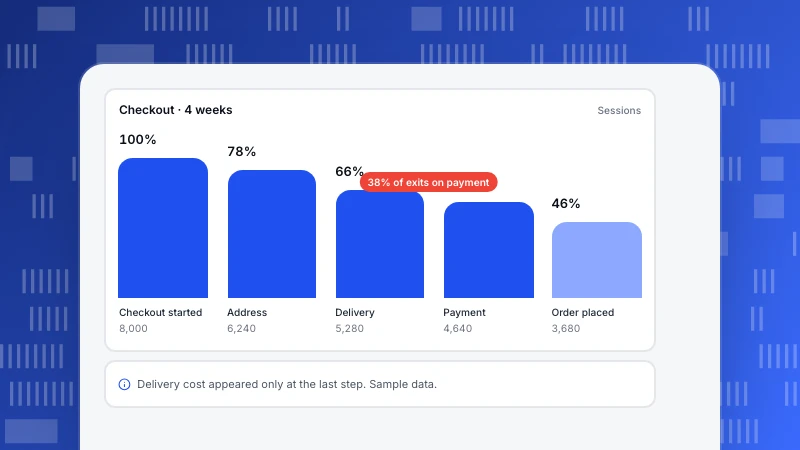
UX audit: how to do one in 7 steps (with checklist)
A UX audit finds usability problems and ranks what to fix. Expert review vs data-driven review, seven steps, a measurable checklist, a checkout audit example and FAQ.
Read more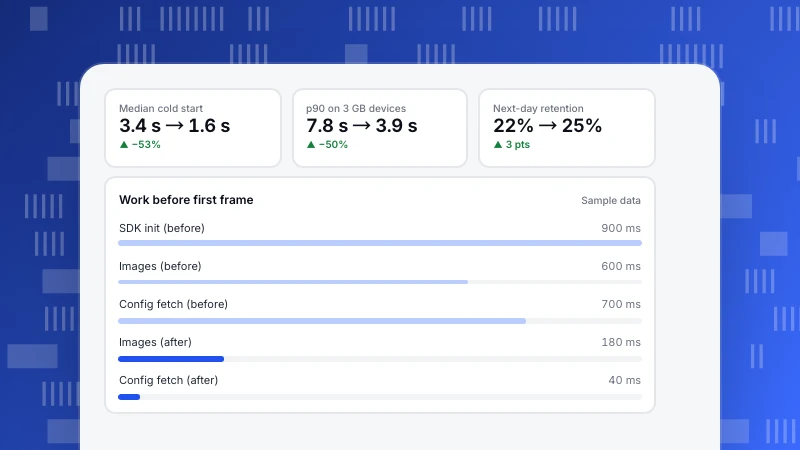
How to improve app performance: metrics, targets and 8 fixes
Improve mobile app performance with the metrics that matter (cold start, jank, ANR, crashes, memory, network), official thresholds, eight steps and a worked example that halved cold start.
Read more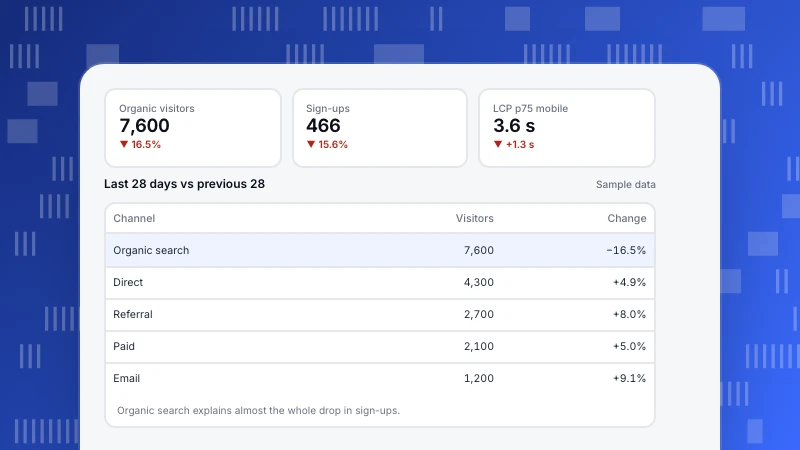
Website analysis: how to analyze a website in 7 steps
How to analyze a website across traffic, behavior, technical health and search, with a 28-day worked example, how to size up a competitor site, common mistakes and a FAQ.
Read more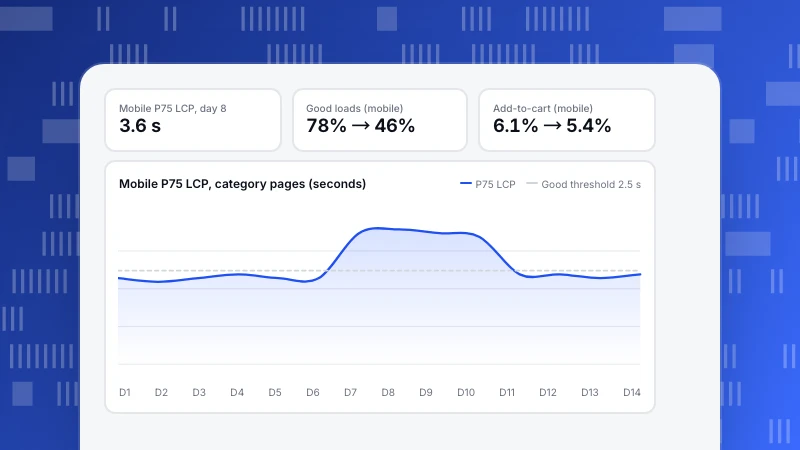
Web performance monitoring: RUM vs synthetic, metrics and a worked regression
How to monitor website performance continuously: real user monitoring vs synthetic checks, Core Web Vitals at P75, and a worked release where mobile LCP jumped from 2.3 to 3.5 seconds and add-to-cart fell.
Read more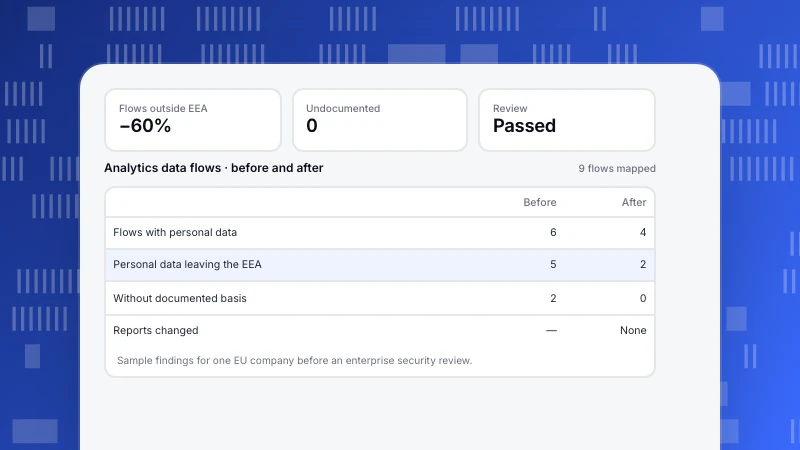
Data residency: what it means, the laws, and how to map your analytics data
Data residency is where your data is physically stored. How it differs from sovereignty and localization, the main laws (GDPR, PIPL and others), why analytics is affected, and a worked mapping of nine data flows.
Read more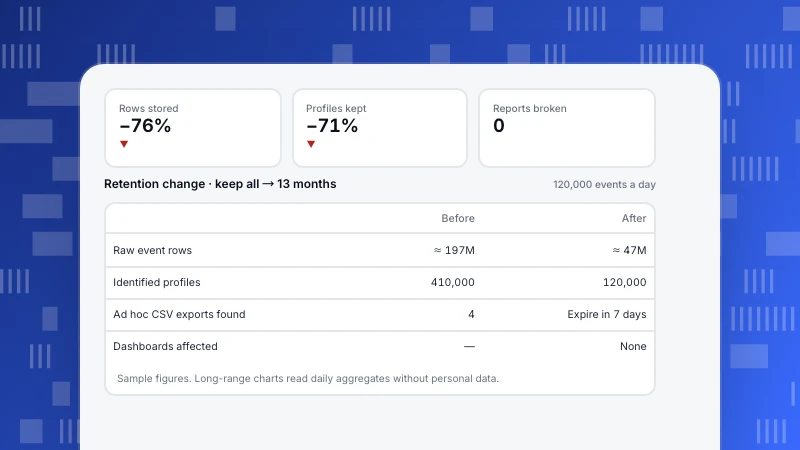
Data retention policy: legal basis, a sample schedule and how to enforce it
A data retention policy sets how long each type of data is kept and how it is deleted. The legal basis (GDPR, CCPA), what to include, a sample schedule for analytics data, and a worked example of moving from "keep everything" to 13 months.
Read more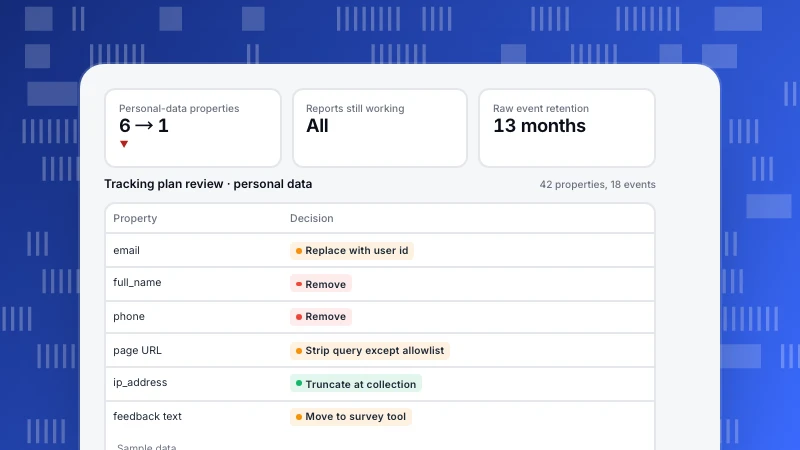
Privacy by design: the 7 principles, GDPR Article 25 and a worked example
Privacy by design builds privacy into products from the start. The seven principles translated into team practice, what GDPR Article 25 requires, a tracking-plan review that cut personal-data fields from six to one, and a checklist.
Read moreOther categories
Each category answers a recurring question we hear from customers. Start with the one closest to your job.
Growth & Marketing
Acquisition, marketing, site and app operations, and how to pick the one stage worth fixing first.
238 articlesLive Chat
Proactive invites, translation and turning support conversations into conversions.
78 articlesAI Search
GPTBot, ClaudeBot, PerplexityBot: who fetches your pages, what the files say and what comes back.
39 articlesProduct News
What shipped, why we built it that way, and how to turn it on.
64 articles