Try it on your own data
Every report in this article is in the free plan. One snippet for web and apps, up to 10 sites.
Start freeAI marketing analytics uses AI to work with marketing data: asking questions in plain language, explaining why a number changed, summarizing results and sometimes forecasting. It is safest as a way to ask your data, not to decide for you, with every number traceable to a query you can open and re-run. Below: four uses and how far to trust each, a worked example and six checks.
What you will learn
- Separate AI that computes (runs a query you can open) from AI that composes (writes text that can sound right and be wrong)
- A split of a change shows where it came from, not why; add the change log and a comparison before acting
- Do not act on small real-time counts: 20 visitors at a 3% rate give a 54.4% chance of no orders
What is AI marketing analytics?
AI marketing analytics is the use of AI, mostly language models and machine-learning methods, to work with marketing data: asking questions in plain language, explaining why a number changed, summarizing results and sometimes forecasting. It does not replace the data collection underneath, and it does not know your business; it speeds up the step between a question and a number.
The distinction that matters is whether the AI computes or composes. When it computes, it turns your question into an analysis query, runs it against your data and shows the result. When it composes, it writes sentences, such as a summary or a recommendation, from numbers or from nothing. The first is checkable: you can look at the query. The second can sound right and be wrong. So the safest way to use AI here is to let it help you ask the data, not decide for you, and to insist that every number can be traced to a query you can open.
What can AI actually do in marketing analytics?
Four uses cover most of what people ask for: getting numbers, explaining a change, forecasting and writing summaries. They differ sharply in how far you can trust them, and the table below sets out, for each, how the answer is produced and what to check. Getting numbers is the most dependable when the query is shown; writing summaries is the least dependable without a check.
Summaries are where the risk sits. NIST's generative AI risk profile lists confabulation, producing confidently stated but erroneous content, as a risk unique to or made worse by generative AI (NIST). A summary is only as safe as your habit of checking its numbers. For improving conversion with AI, a separate topic, see AI conversion rate optimization.
| Use | What you ask | How the answer is produced | How far to trust it | What to check |
|---|---|---|---|---|
| Getting numbers | "Sessions by channel, last 7 days vs the previous 7" | A question becomes an analysis query that runs on your data | High, when the query is shown | That the query uses the metric, period and filters you meant |
| Explaining a change | "Why did sessions fall?" | The change is split across channels, countries, devices and pages | The arithmetic is exact; the cause is not | Release notes, budget changes, tracking breaks |
| Forecasting | "What will orders be next month?" | A statistical or learned model projects the past | Uncertain, and worse after changes | Back-test on past months |
| Writing summaries | "Summarize this week for my boss" | A model writes text from the numbers | Can sound confident and be wrong | Every figure in the text against the data |
The more a step relies on written text rather than a query you can open, the more you must check it.
How do you phrase a question the AI can answer?
A good question names five things: the metric, the time, the comparison, the breakdown and any filters. If one is missing, the system has to guess, and guesses are where wrong answers come from.
| Vague | Specific |
|---|---|
| "How are we doing?" | "Sessions and orders, last 7 days vs the previous 7, by channel" |
| "Why is traffic down?" | "Why did sessions change last week vs the week before?" |
| "Which campaigns work?" | "Orders by campaign, last 30 days, paid channels only" |
| "Show mobile" | "Same query, mobile only" (a follow-up that edits the previous query) |
Follow-ups work best when they change one thing at a time: now by country, now mobile only. If an answer misses the point, do not argue with it. Name the metric, the period and the breakdown, and ask again.
Worked example: one week of traffic down 18%
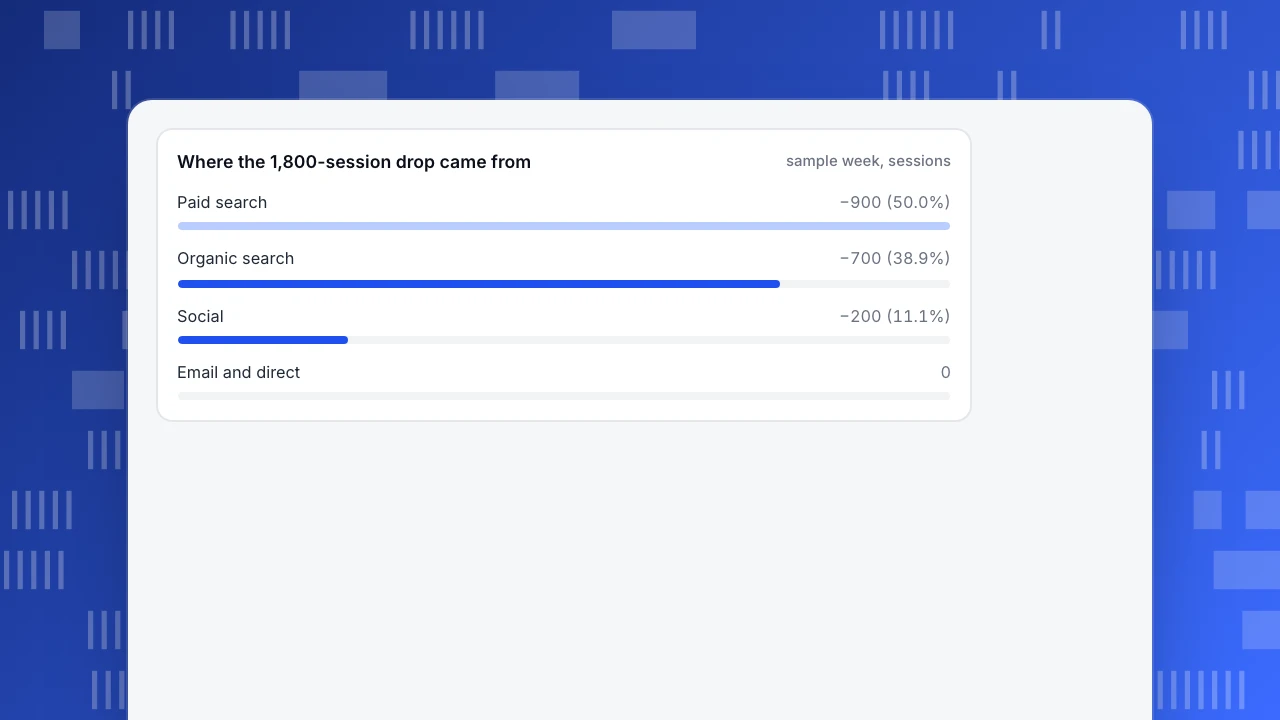
Sample data: sessions fell from 10,000 last week to 8,200 this week, a drop of 1,800, or 18.0% (1,800 ÷ 10,000). The question "why did it change?" splits that drop by channel. Each channel's contribution is its change divided by the total change.
| Channel | Last week | This week | Change | Contribution to the drop |
|---|---|---|---|---|
| Paid search | 3,500 | 2,600 | −900 | 50.0% |
| Organic search | 4,000 | 3,300 | −700 | 38.9% |
| Social | 1,200 | 1,000 | −200 | 11.1% |
| 800 | 800 | 0 | 0.0% | |
| Direct | 500 | 500 | 0 | 0.0% |
| Total | 10,000 | 8,200 | −1,800 | 100.0% |
How to recompute: 900 ÷ 1,800 = 50.0%, 700 ÷ 1,800 = 38.9%, 200 ÷ 1,800 = 11.1%; the three shares add to 100%. Going one level deeper into paid search: brand campaigns went 1,500 to 1,450 (−50, 2.8% of the total drop), while prospecting campaigns went 2,000 to 1,150 (−850, 47.2%), a fall of 42.5% in that one group.
So one campaign group explains almost half of the drop. What the decomposition does not tell you is why prospecting fell. A budget cut? A paused ad? A tracking break? Here the next step is to look at what changed that week: an annotation might show the prospecting budget was reduced on Tuesday. That fits the timing, but even then it is evidence, not proof. The decomposition narrows the search from "traffic is down" to "this campaign group lost 850 sessions"; the explanation still needs a human with the change log.
Where the 1,800-session drop came from
sample week, sessionsHow do you check an AI answer before you act on it?
Run these six checks, in this order, before an answer changes a budget or a plan.
- Open the query. Can you see the metric, period, comparison and filters it used? If the tool shows only prose, treat it as a draft.
- Re-run it yourself. Open the same analysis in the normal report and confirm the numbers match.
- Check a number you already know. Total sessions last week should match your overview page; if not, the question was read differently.
- Look at sample size. A conversion rate from 30 visitors is not a result.
- Check the timeline. Did the change precede the supposed cause? Temporality is one of the considerations Austin Bradford Hill set out for judging whether an association is causal (Hill, 1965), along with experiment: ideally a comparison group.
- List other explanations. A seasonal dip, a holiday, a bot spike, a tracking change. If you cannot rule them out, say so in the report.
The classic mistake is treating correlation as cause: paid prospecting fell and sessions fell together, but a competitor's promotion could also have moved both. AI makes the correlation faster to find, not more likely to be causal.
Is real-time marketing analytics worth acting on?
Real-time views are for confirming that something is working right now: tracking after a deploy, a campaign link going live, an email send arriving. They are poor for judging performance, because small counts are noisy.
Sample data: a page converts 3% of visitors in the long run. In an hour with 20 visitors you expect 20 × 0.03 = 0.6 orders. The chance of seeing none is 0.97^20 ≈ 54.4%, and the chance of two or more is about 12.0%. The same page can look dead or great from one hour to the next with nothing having changed. With 50 visitors the chance of zero orders is still 0.97^50 ≈ 21.8%. Decide on days of data and enough conversions, and use real-time to check the plumbing.
How can your own AI agent read your analytics?
If you use an AI agent or assistant of your own, you can let it query your analytics through the Model Context Protocol (MCP), an open protocol for connecting language-model applications to external data and tools (MCP specification). The practical points are about permission: give the agent a key that can only read, and limit it to the projects it needs. Setup details for TapCub are in connect AI agents with MCP.
Common mistakes with AI marketing analytics
- Trusting the sentence, not the query. If you cannot open the query, you cannot check the number.
- Asking vague questions. "How are we doing?" forces a guess about metric and period.
- Reading a decomposition as a cause. In the example, the 850-session fall in prospecting is where to look, not why it happened.
- Acting on hourly real-time numbers. 20 visitors and a 54.4% chance of no orders is noise.
- Using AI for the forecast without a back-test. A forecast that has never been checked against past months is a guess with a chart.
- Treating the model as the data. The numbers come from your tracking; if collection broke, the best AI just summarizes the break.
How to use AI marketing analytics in TapCub
Here is how the traffic-drop example runs in TapCub. The assistant runs queries and reads the results; it does not predict, and it does not act.
- Ask in one sentence. Open All-platform analytics › Operations › AI Assistant, Ask tab, and type: "sessions by channel, last 7 days vs the previous period". The question is parsed by rules first; the model is used only when confidence is low, no query could be parsed, or the thread has history. The answer includes the query it ran, and the numbers come from an analysis query on your project, not from a knowledge base.
- Check it. Click Open in analyzer to see the same query in the normal report, and Save as insight if it is worth keeping. These are buttons you click; the assistant does not press them. With no model configured the badge reads Rules only (no model calls), and answers stay on the rules path.
- Ask why it changed. Open the Why did it change tab. It splits the change against the previous period or the same period last year by channel, referrer domain, country, device, entry page, platform and related dimensions, one or two levels deep. Contribution is that value's change divided by the total change, which is exactly the calculation in the example.
- Add the context. Check annotations for launches and budget changes (Configuration › Annotations) and cross-check on Web analytics › Realtime only to confirm collection is arriving, not to judge a campaign.
- Connect your own agent, read-only. The MCP tab shows the endpoint and a client config. Create an API key under Configuration › Settings › API keys with the Read stats scope. The tools are read-only: they do not write events, edit definitions or create monitors.
The assistant does not forecast, create monitors or send notifications, and model calls can be limited by a daily cap per site. For a simple expected range, a monitor with a forecast band uses the mean of the last 7 days and the same weekday, but that is a rule, not a prediction model.
FAQ
What is AI marketing analytics?
It is the use of AI to work with marketing data: answering questions in plain language, explaining changes, summarizing results and sometimes forecasting. The key distinction is computing versus composing. An answer that runs a query you can open is checkable; a written summary can be wrong while sounding confident.
How is AI used in marketing analytics?
Mostly four ways: fetching numbers from a plain-language question, splitting a change across channels or devices, forecasting from past data, and writing summaries. They differ in reliability. Fetching and splitting are arithmetic on your data; forecasts and summaries need back-testing and a check against the figures.
Can AI explain why my marketing metrics changed?
It can show where the change came from, such as which channel or campaign group lost 850 sessions, using exact arithmetic. It cannot by itself tell you the cause. A budget cut, a holiday or a tracking break could each produce the same pattern, so you still need the change log and a comparison group.
How do I check whether an AI analytics answer is right?
Open the query it ran, re-run it in the normal report, and compare against a total you already know. Check the sample size, check that the change came after the supposed cause, and list other explanations. If you cannot open the query, treat the answer as a draft.
Is real-time marketing analytics useful?
For checking that tracking, a launch or a send is working, yes. For judging performance, usually no, because small counts swing: with 20 visitors at a 3% rate you have about a 54% chance of seeing no orders. Decide on whole days of data instead.
See also: AI Data Governance: Five Controls, Inputs First and Outputs Second.
Sources
- Model Context Protocol. Specification, version 2025-06-18. Open protocol for connecting language-model applications to external data sources and tools.
- National Institute of Standards and Technology. Artificial Intelligence Risk Management Framework: Generative Artificial Intelligence Profile (NIST AI 600-1). Confabulation as a generative AI risk.
- Hill, A. B. (1965). The Environment and Disease: Association or Causation? Proceedings of the Royal Society of Medicine, 58(5), 295–300. Considerations for judging whether an association is causal.
Was this article helpful?
We use your answers to fix and expand this page.
Couldn’t send. Please try again in a minute.
Thanks for the feedback. We’ll use it to improve this page.You’ve already sent feedback on this page. Thanks.

Product Analyst
Focuses on event analysis, conversion funnels, and retention, using clear metric definitions and structured analysis to explain product performance.