Analytics · Page 3
How metrics are defined, where numbers disagree, and how to read a funnel or a retention curve without fooling yourself.
This category covers the mechanics of measurement: what a visitor is, why sessions differ between tools, how to build a funnel that survives scrutiny, and how to spot bot traffic before it skews a decision. Every article uses the same sample dataset you see in the product, so you can reproduce the reasoning in your own workspace.
Articles in Analytics
304 articles · page 3 of 7
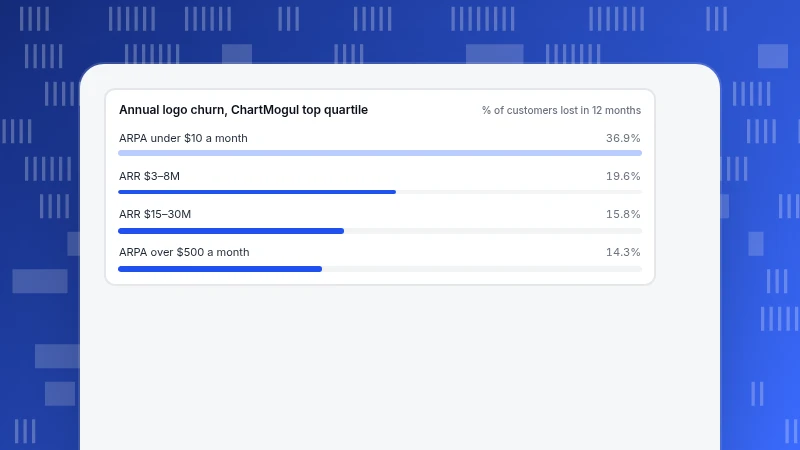
Average SaaS Churn Rate: Benchmarks by Contract Size
There is no single average SaaS churn rate. This guide lists what Recurly, ChartMogul and SaaS Capital actually print, converts monthly and annual figures, and walks through a self-check worked example.
Read more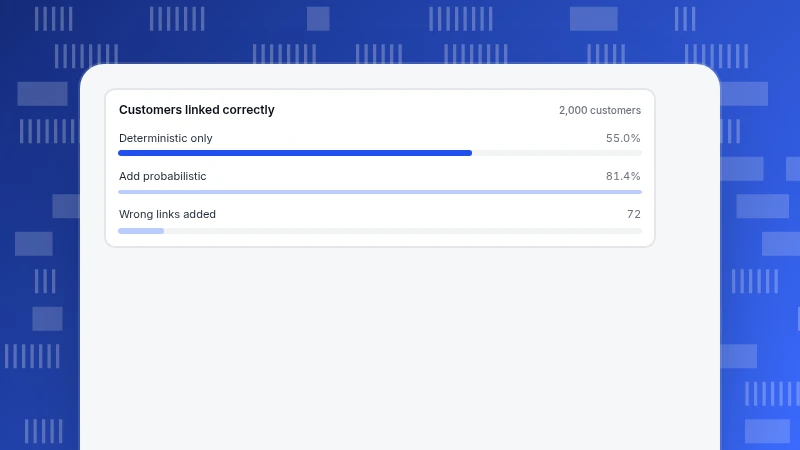
AI CDP: What AI Adds to a Customer Data Platform and Where It Stops
An AI CDP adds identity matching, predictions, audiences and assistants to a customer data platform. A capability table with limits, plus two worked examples: match precision and a churn score's break-even.
Read more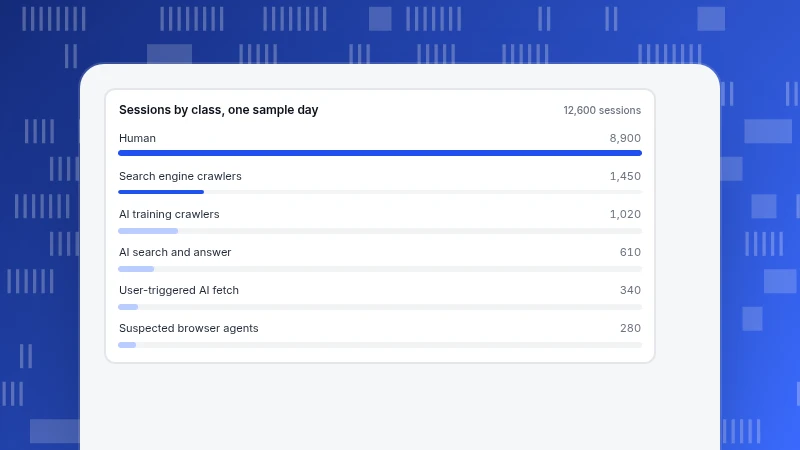
Agent Analytics: How to Tell AI Agents From Human Visitors
Agent analytics separates AI agent requests from human sessions. Four classes of agent traffic, vendor-declared user agents, how to verify them, and a sample day where agents understated conversion by 29%.
Read more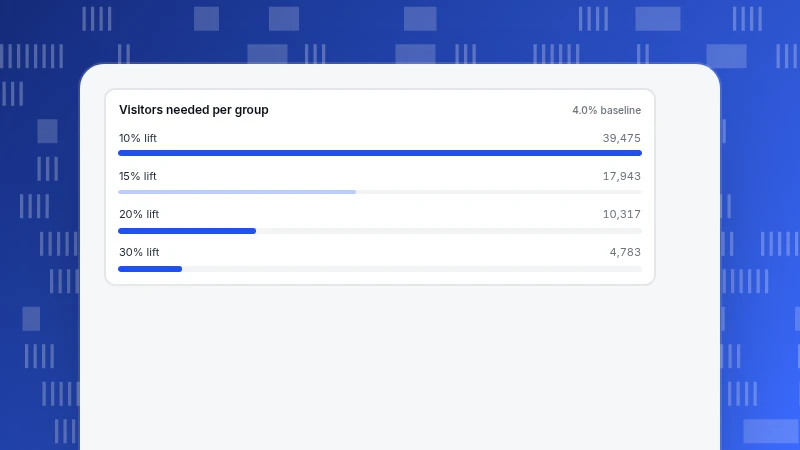
A and B Testing: A Worked Test From Sample Size to Result
A and B testing compares two versions of a page with randomly split visitors. One worked test from sample size and duration to reading the confidence interval and deciding what to ship.
Read more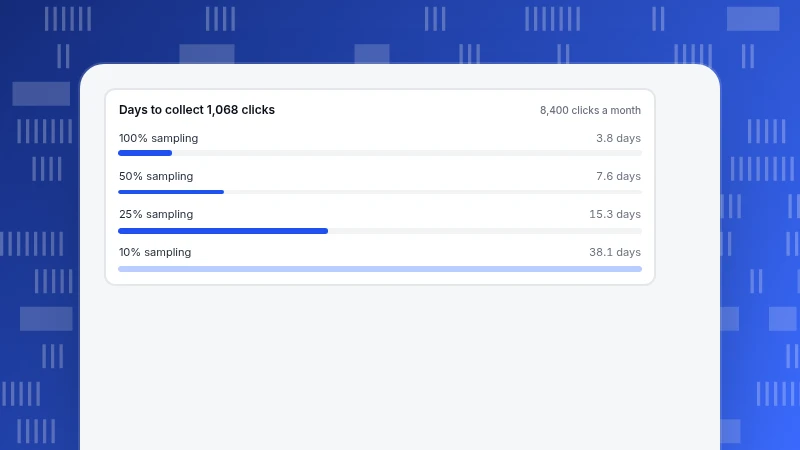
Heatmap tools: 8 criteria to compare before you choose
Compare heatmap tools with a scorable checklist: map types, clicks needed for a trustworthy sample, sampling rate, privacy defaults and how the billing meter changes your bill, with worked numbers.
Read more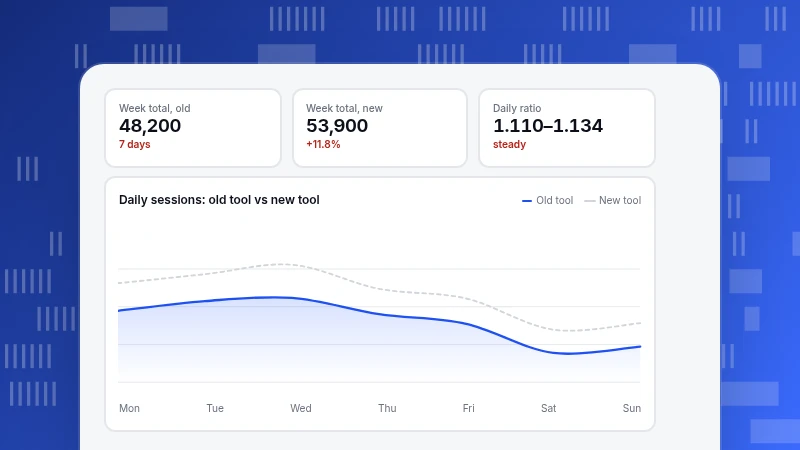
Google Analytics Alternatives: Pick by the Question You Need Answered
Choose a Google Analytics alternative by the question you need answered, not by a ranked list. Documented Google limits, a kind-of-tool matrix, seven tests, and a two-week parallel run with a reconciliation you can recompute.
Read more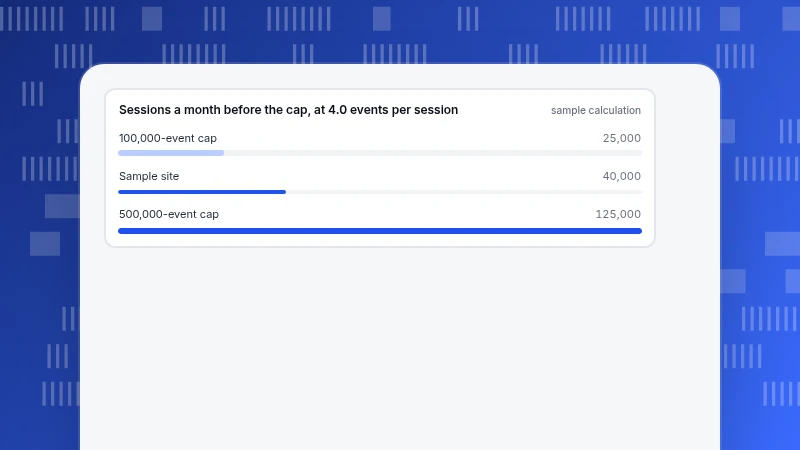
Free Website Analytics: What the Free Tiers Actually Include
Free website analytics tiers compared on five numbers: event cap, retention, sampling, bots and scope, taken from public documentation. Includes a cap-to-sessions calculation and a decision table.
Read more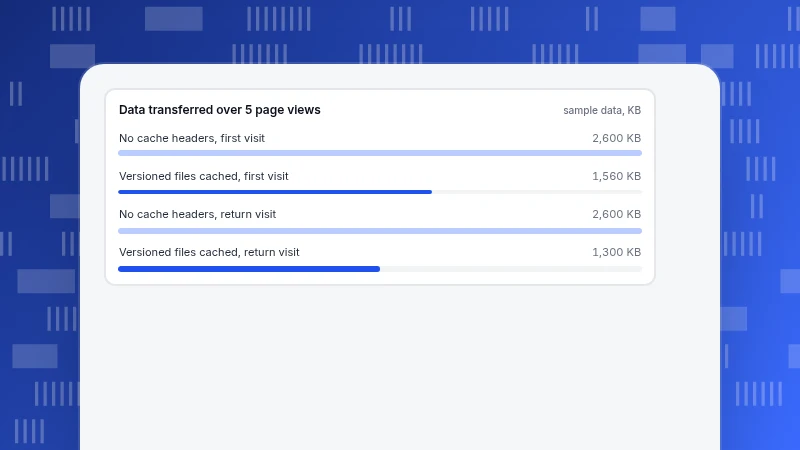
Expires Header and Cache-Control: What to Set and How to Check
The Expires header gives the date after which a cached response is stale, but Cache-Control max-age wins when both are present. See the order caches follow, what to set for each file type, how to set it and a curl check.
Read more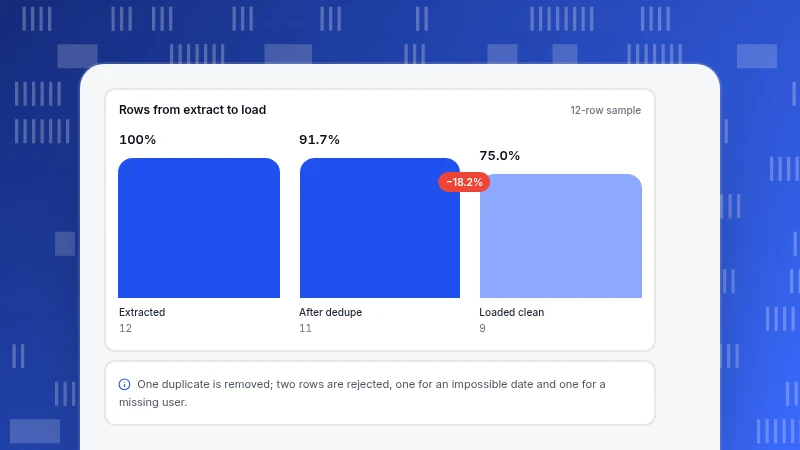
ETL with SQL: A Runnable Extract-Transform-Load Example
ETL with SQL means extracting with a SELECT, transforming with expressions and window functions, and loading with INSERT ... SELECT and upserts. A complete example you can run, with row counts and money reconciled and a safe rerun.
Read more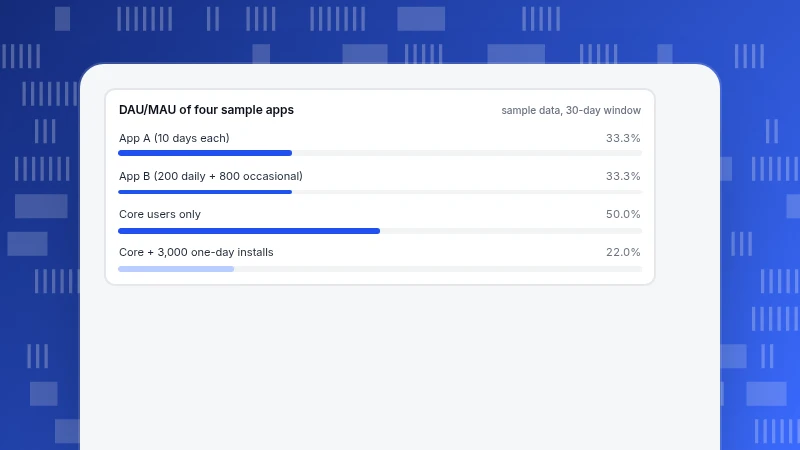
DAU/MAU Ratio: How to Calculate Stickiness and What Is Good
DAU/MAU is average daily active users divided by monthly active users, and it equals the average days per month each user is active divided by 30. Recomputed examples, real filings and a ceiling rule for what a good ratio is.
Read more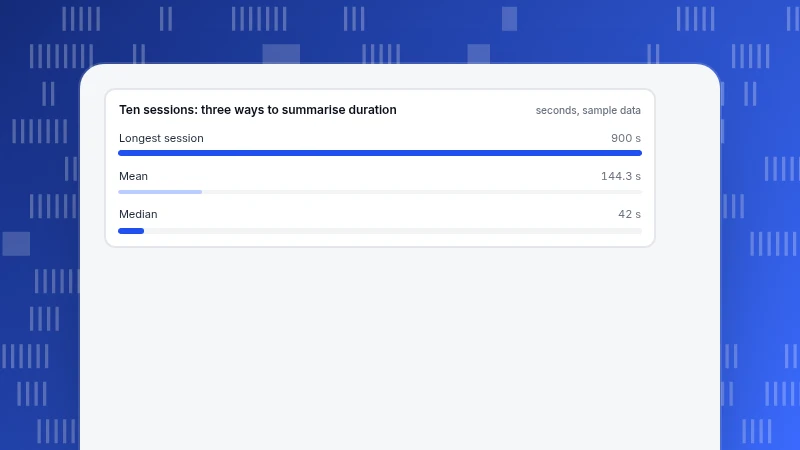
Data Examples: Types of Data With Real Analytics Rows and What You Can Do With Each
One analytics event row classified into eight data types, a table of what each type allows and what to avoid, and a worked example where the mean (144.3 s) and median (42 s) of the same sessions tell different stories.
Read more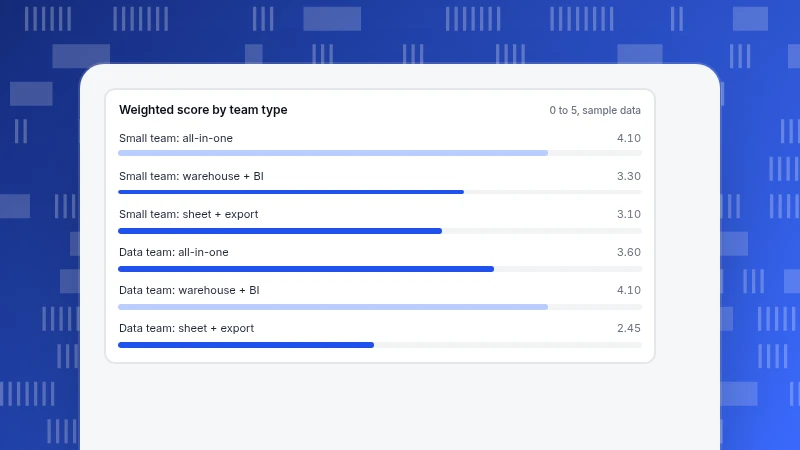
Data Analytics Platform: Layers, Shapes and How to Choose One
Six layers from collection to governance, three common shapes, and a weighted scorecard whose winner flips with team context, plus the export, retention and volume limits to check before you commit.
Read more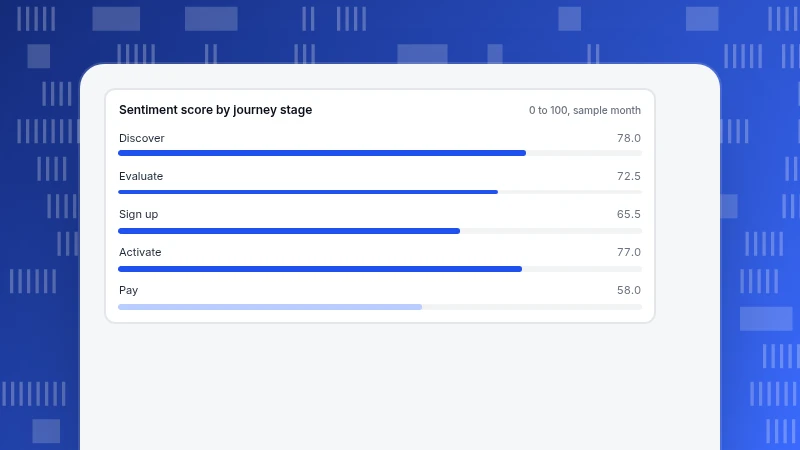
Customer Experience vs Customer Journey: How They Differ and Connect
The journey is the path; the experience is how it felt. A stage-to-metric table and a worked five-stage example show how the two views point at different problems and how to use them together.
Read more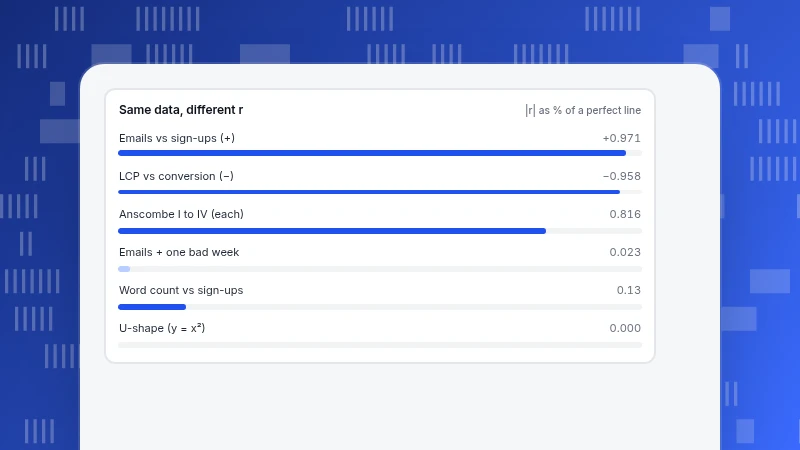
Correlation Examples: Positive, Negative and Zero, With r Computed
Three small datasets with the raw numbers and r recomputed, plus Anscombe's quartet, an outlier that erases a correlation and a zero r that hides a strong pattern.
Read more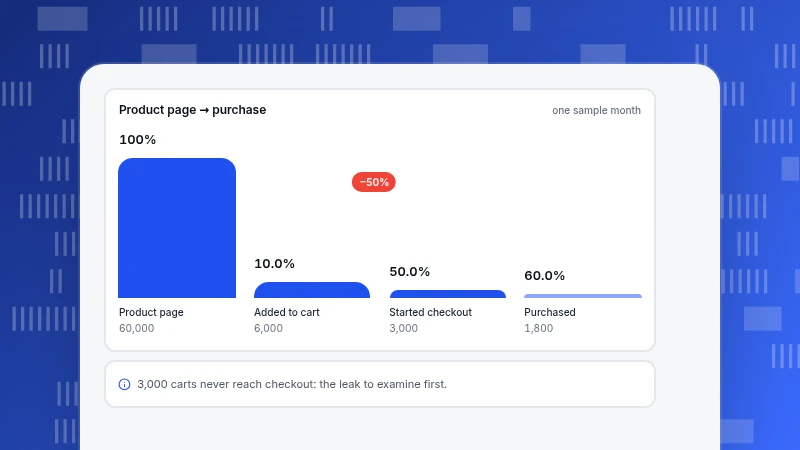
CRO (Conversion Rate Optimization): A Step-by-Step Cycle With a Worked Test Plan
Conversion rate optimization as a six-step loop: find the biggest leak in your funnel, rank test ideas by expected extra purchases, compute each test's sample and weeks, and decide with a rule written beforehand.
Read more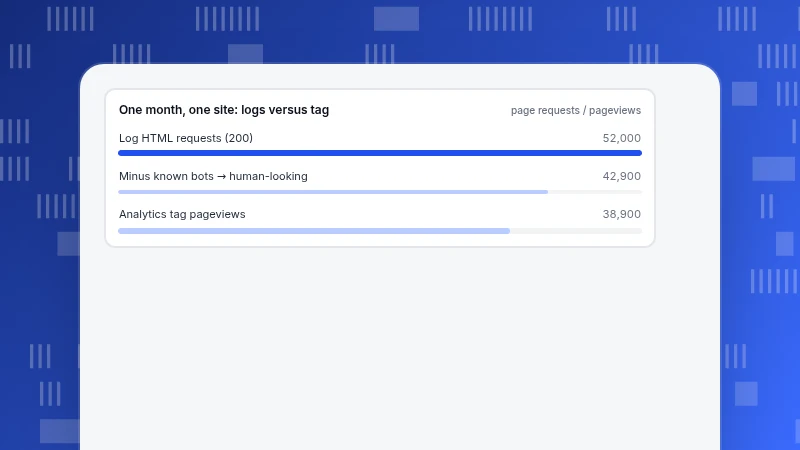
Website Traffic Analysis Tools: What Each Type Answers
Website traffic analysis tools come in four types: on-site analytics, server logs, search console data and panel estimates. A question-by-type matrix, a recomputed one-month reconciliation and a rule for which number to trust.
Read more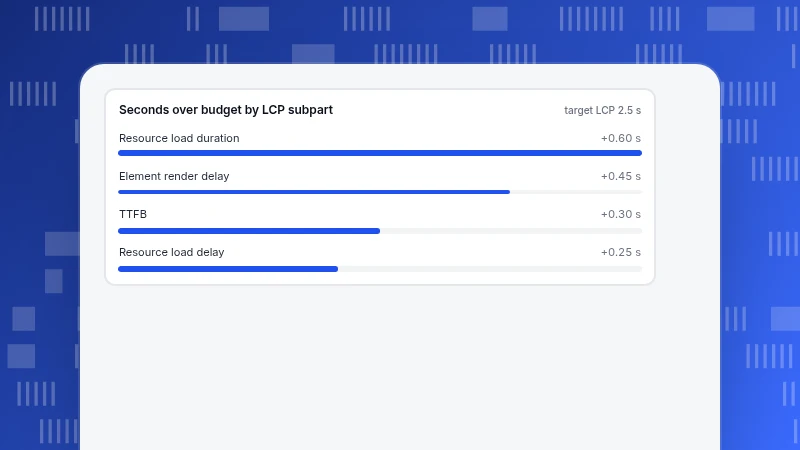
Website Performance Optimization: Measure First, Then Fix in This Order
Website performance optimization starts with real-user P75 data, splits LCP into four subparts and fixes the largest overshoot first. Worked example, prioritised fix table, INP and CLS rules, and how to verify a fix.
Read more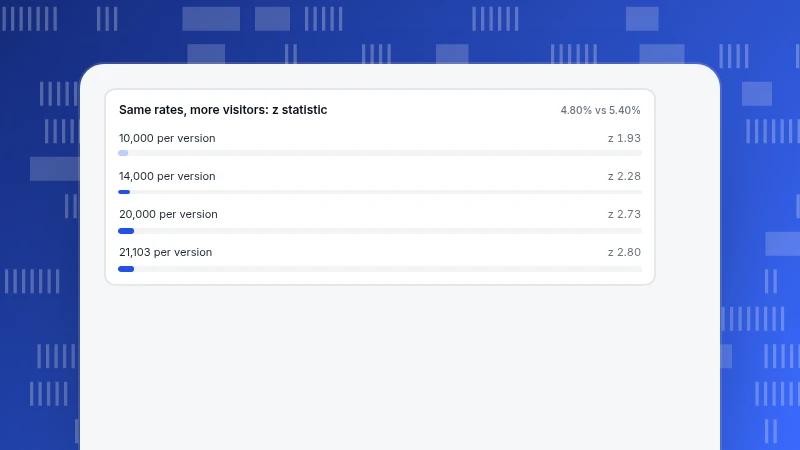
Statistical Significance Example: A Full A/B Test Calculation
A complete statistical significance example for an A/B test: counts, pooled rate, z statistic, p-value, confidence interval, sample size and a ship decision, all recomputed.
Read more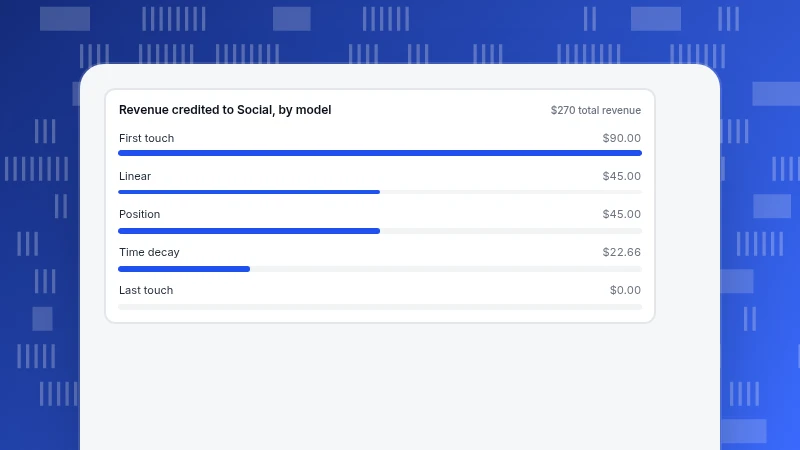
Revenue attribution: how five models credit the same three orders
Revenue attribution splits each order's value across the touches before it. Three orders worth $270 credited under first, last, linear, position and time-decay models show which channels start and which close, and how to decide budget from the range.
Read more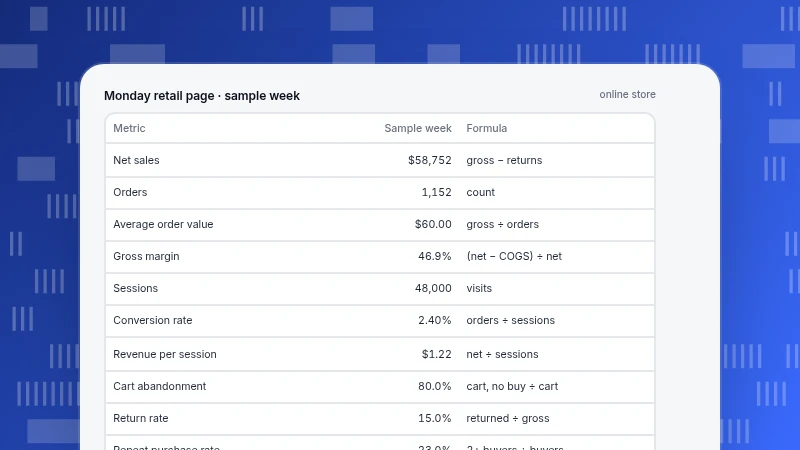
Retail Analytics Dashboard: A 10-Metric Layout With Formulas
A retail analytics dashboard layout in three bands with ten metrics, their formulas and one recomputed sample week, plus a way to decompose a bad week into sessions, conversion and order value.
Read more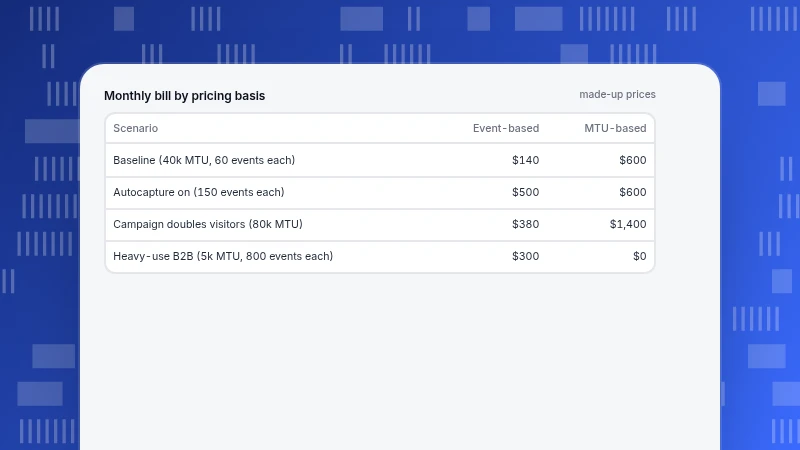
Product Analytics Tools: What to Compare Before You Pick One
How to compare product analytics tools: a five-row matrix (identity, retention, funnels, session replay, pricing basis), a trial test for each row, a worked funnel-counting example and a recomputed events-versus-users pricing table.
Read more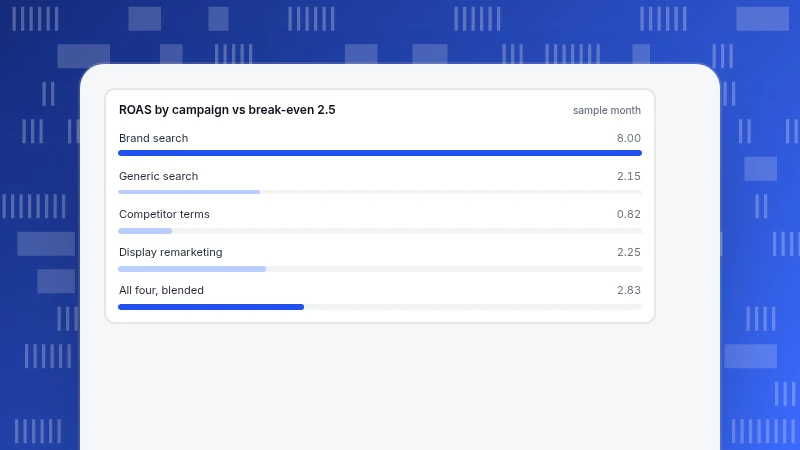
PPC Dashboard: The Metrics, Formulas and Layout That Drive Decisions
What a PPC dashboard should show, with Google Ads definitions for CPC, conversion rate and ROAS, a four-campaign worked example, break-even ROAS rules and a layout you can copy.
Read more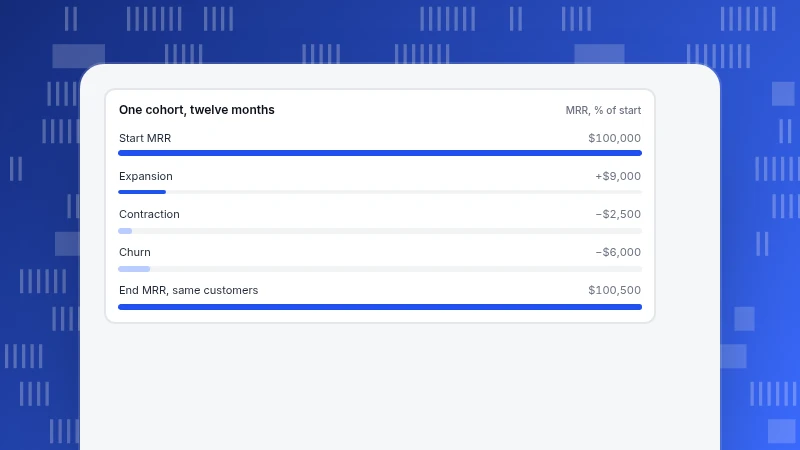
NRR vs GRR: net and gross revenue retention on one worked cohort
NRR counts expansion, GRR does not. One 40-customer cohort recomputed under both formulas shows how a 100.5% NRR can hide a 91.5% GRR, why one account can swing it, and why monthly figures must be compounded.
Read more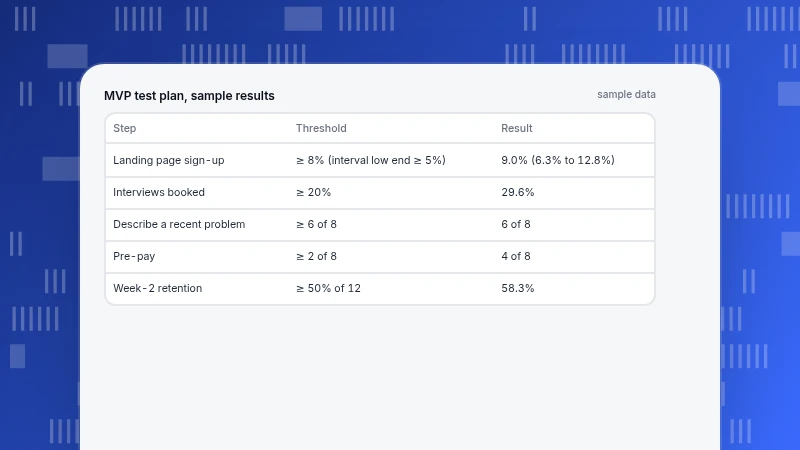
MVP Test: How to Validate an MVP With Real Users, Step by Step
How to run an MVP test with real users: pick the riskiest assumption, choose a test type, write a plan with hypothesis, metric, threshold and decision, and read small samples with confidence intervals.
Read more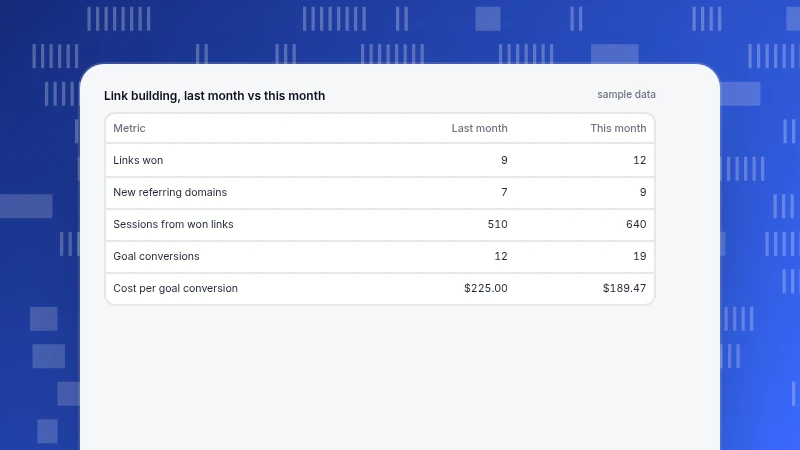
Link Building Report: Metrics to Include and a Template With Sample Numbers
What a link building report should contain: a filled-in monthly template (links won, referring domains, referral sessions, conversions, cost), the limits of Google's Links report and how to label paid links.
Read more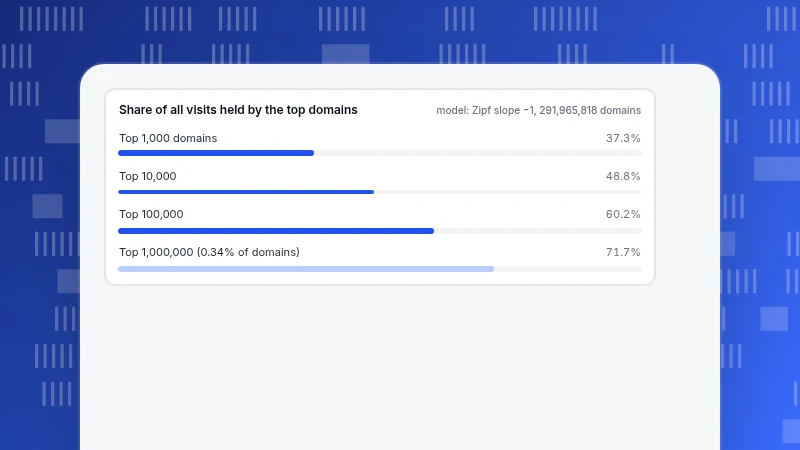
How Many Visitors Does a Website Get? A Rank-to-Traffic Model
Website traffic follows a steep curve: 96.55% of pages get no Google traffic while a few sites get billions of visits. A rank-to-traffic model, the noise at each size, and how to count your own visitors.
Read more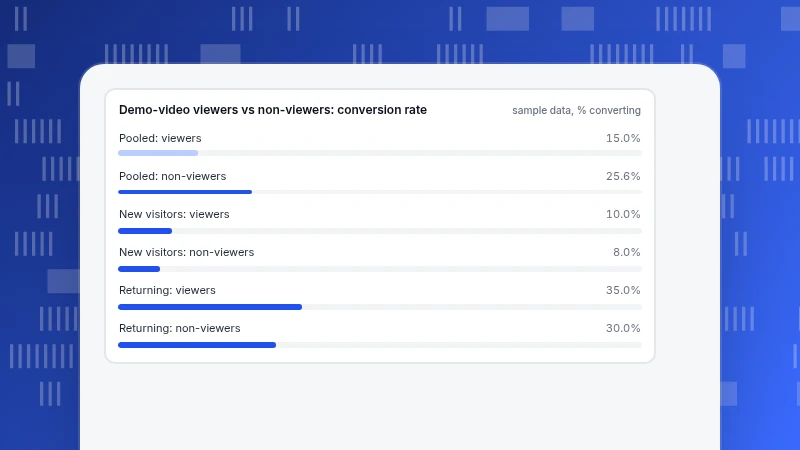
Confounding vs Lurking Variable: The Difference, With Worked Examples
A confounding variable is a measured third factor; a lurking variable is the same thing nobody measured. Two sample-data tables and the 1973 Berkeley admissions counts show how each one reverses or shrinks a headline gap.
Read more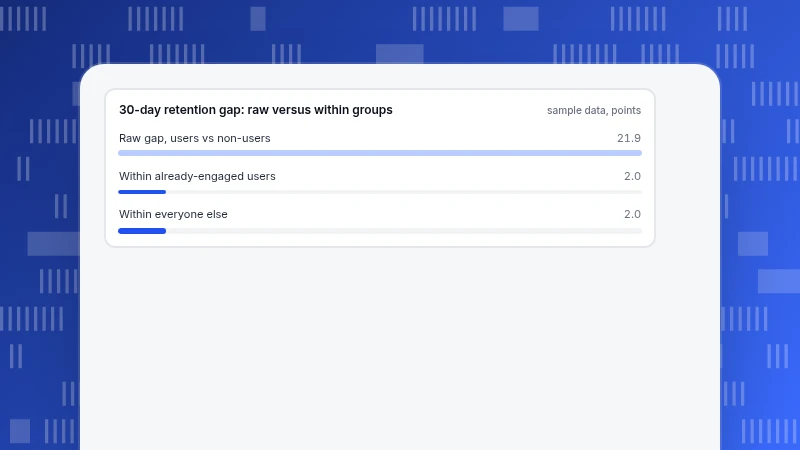
Causation Examples: What Evidence Separates a Cause From a Coincidence
Examples of causation from a randomized hormone trial, Bing's headline experiment and Facebook's ad studies, plus a worked product-analytics case where a 21.9-point retention gap is really 2 points, and a checklist for what you can claim.
Read more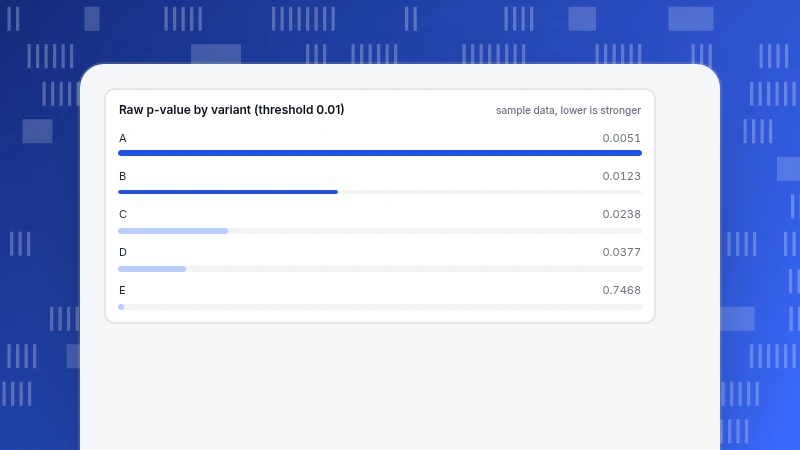
Bonferroni Correction Example: Five Variants and Adjusted Alpha
A worked Bonferroni correction example with a control and five variants: raw versus adjusted p-values, the 0.01 threshold, the extra traffic it costs, and how Holm keeps one more winner.
Read more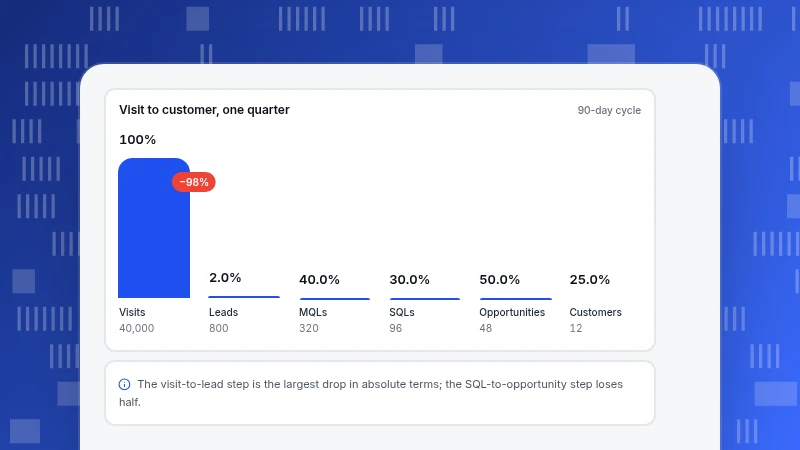
B2B Marketing Analytics: Metrics by Funnel Stage, With Formulas and Sample Numbers
B2B marketing analytics from visit to customer: one funnel table with formulas and sample numbers, CAC and payback, sales velocity, account-level metrics, attribution across a long cycle and the cohort trap in monthly reports.
Read more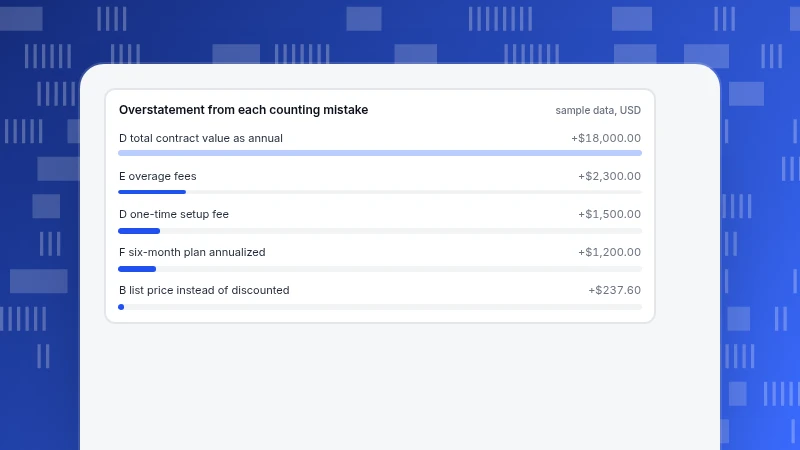
ARR Means Annual Recurring Revenue: How to Calculate It With Examples
ARR is the yearly value of the subscription revenue you expect to repeat. A seven-customer worked example handles discounts, monthly versus annual plans, multi-year deals and churn, and shows how each wrong choice inflates the number.
Read more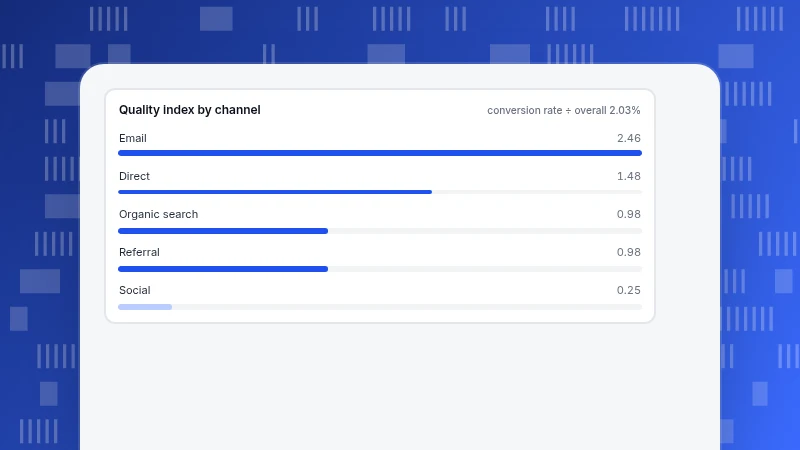
Website Traffic Analysis: A 3-Pass Method With a Worked Example
How to analyse website traffic in three passes: split visits by source, judge each source by engagement and conversion, then compare periods to see what moved. One sample you can recompute, a weekly routine and common mistakes.
Read more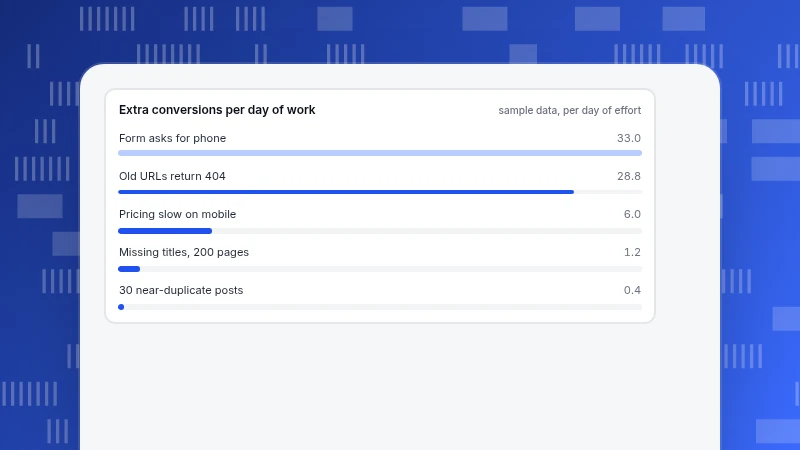
How to Audit Your Website: Technical, Content and Conversion Checks
How to audit your website in three layers, technical, content and conversion, then rank findings by expected extra conversions per day of work. Scope rules, a check table for each layer and a worked prioritisation example.
Read more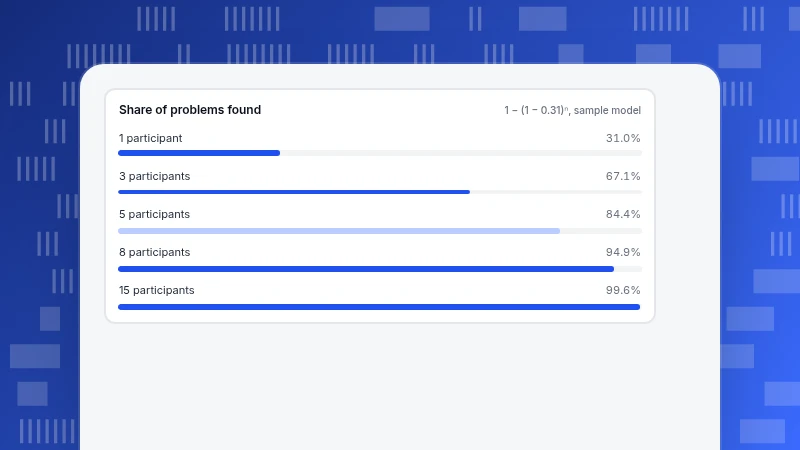
UX Testing: Which Method to Use, With How Many People
UX testing means watching real people attempt real tasks. Learn the three axes of methods, how many participants find problems versus measure them, and how to combine tests with behaviour data.
Read more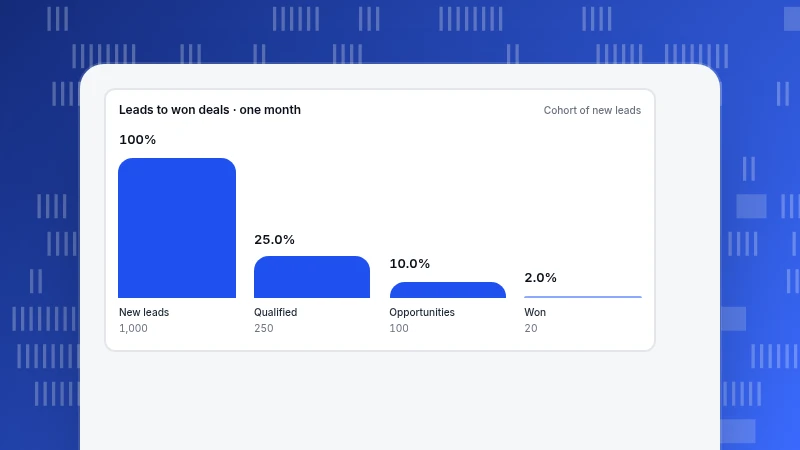
Sales Dashboard: The Four Metric Groups That Drive Action
What to put on a sales dashboard: four groups of metrics (leads, conversion, cycle, amount), formulas, a recomputable monthly example, a pipeline coverage calculation and views for rep, manager and executive.
Read more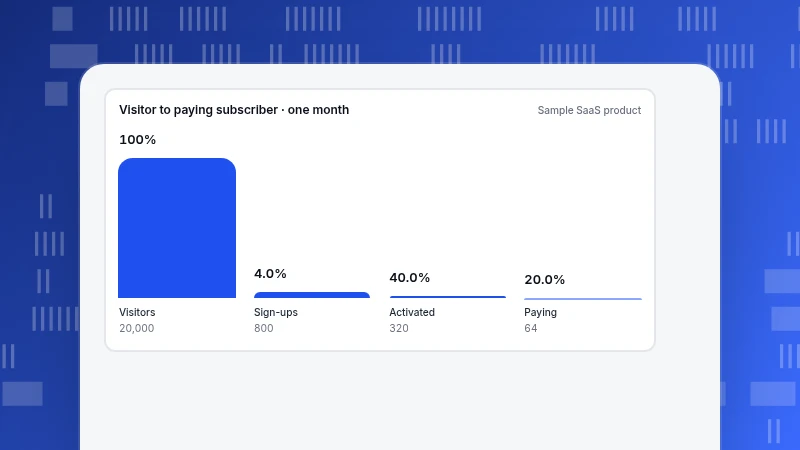
SaaS Analytics: Read Acquisition, Activation, Retention and Revenue in Order
SaaS analytics measures a subscription business in four stages with a few numbers each. One recomputable month of data, a cohort retention curve, net and gross revenue retention, and how to join product and billing data.
Read more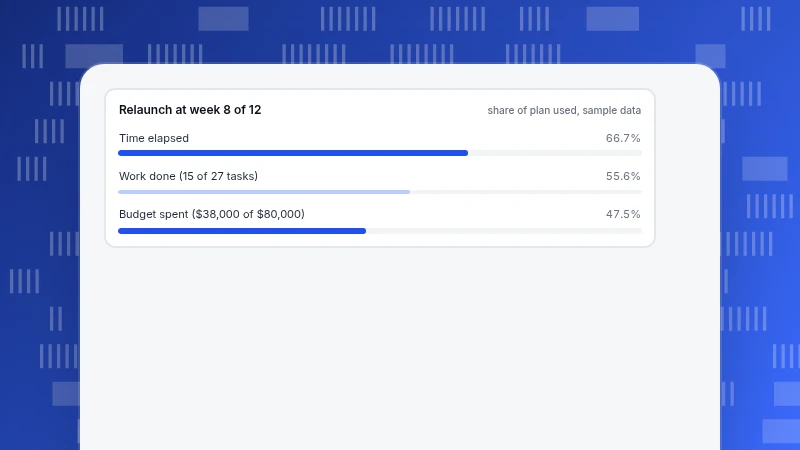
Progress Report: How to Write One People Read in a Minute
A progress report is a short update on work in progress. Put the status, decision and risk first, then the numbers. See a worked example at week 8 of 12 and a template you can copy.
Read more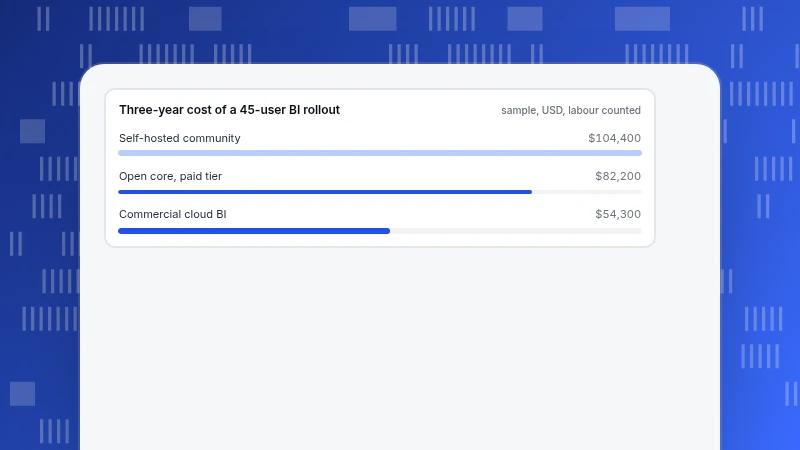
Open Source BI: The Hidden Costs of Sources, Permissions and Operations
Open source BI fits teams that have someone to maintain it. A ten-capability checklist, the hidden costs of data sources, permissions and operations, and a three-year cost that flips depending on whose hours are counted.
Read more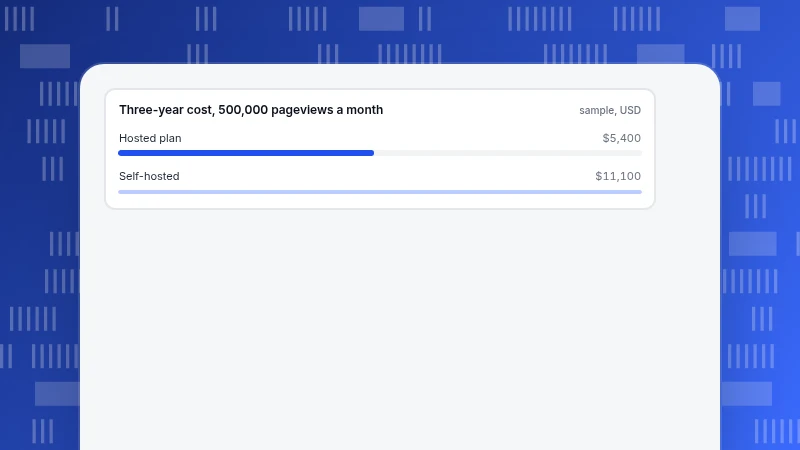
Open Source Analytics: Licence, Hosting and Data Protection Costs
Open source analytics saves licence fees but moves deployment, upgrades and data protection to you. A recomputable self-hosted vs hosted cost with a break-even, licence checks, GDPR duties and a five-step project check.
Read more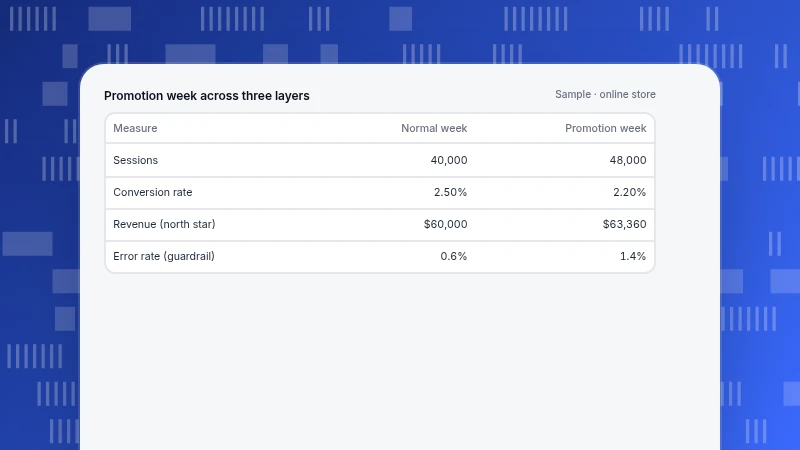
Metrics Dashboard: Arrange Metrics in Three Layers, Not One Wall
How to design a metrics dashboard: one north star, three to five input metrics that add up to it, and guardrails with thresholds. A recomputable promotion-week example, layout rules and common mistakes.
Read more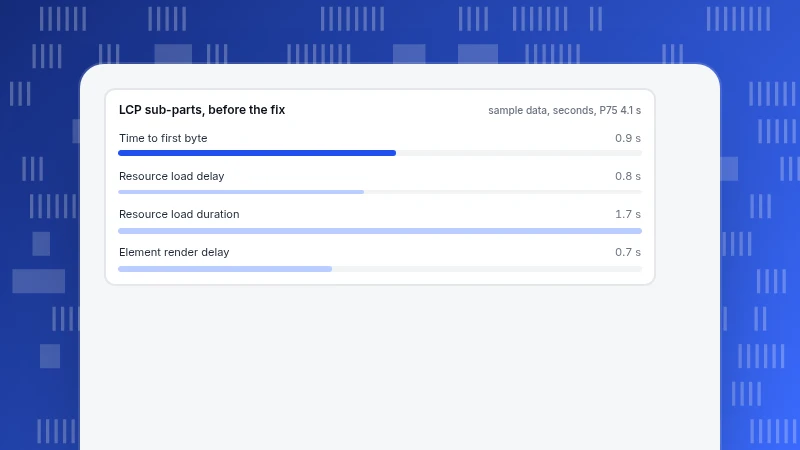
How to Optimize Website Performance: Measure, Find the Slow Part, Fix It
How to optimize website performance in a fixed order: measure real users at P75, rank pages, split LCP into four parts, fix only the part that is out of proportion and verify. Recomputed example included.
Read more
Funnel Analytics Tools: Criteria That Change Your Funnel Numbers
How to choose funnel analytics tools by three capabilities: flexible step definitions, group splits and drill-down. A criteria table, two recomputed examples and a 14-day trial plan.
Read more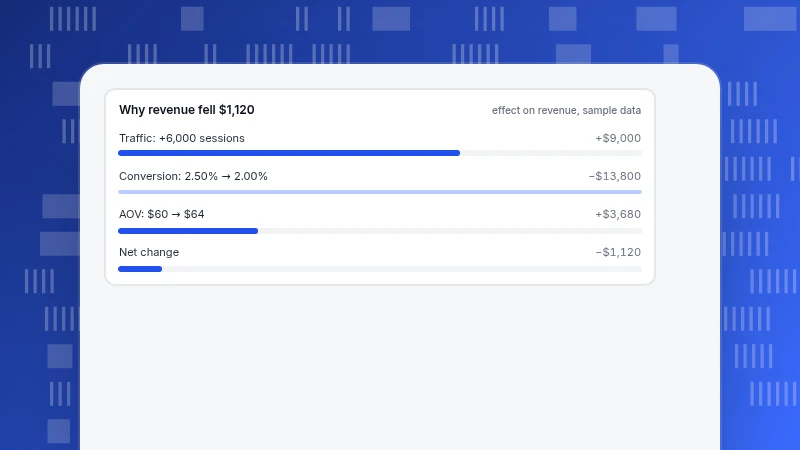
Ecommerce Data Analytics: Four Metric Families That Explain Revenue
Ecommerce data analytics comes down to traffic, conversion, basket size and repeat purchase. See how they multiply into revenue, with a sample revenue drop split by factor and channel.
Read more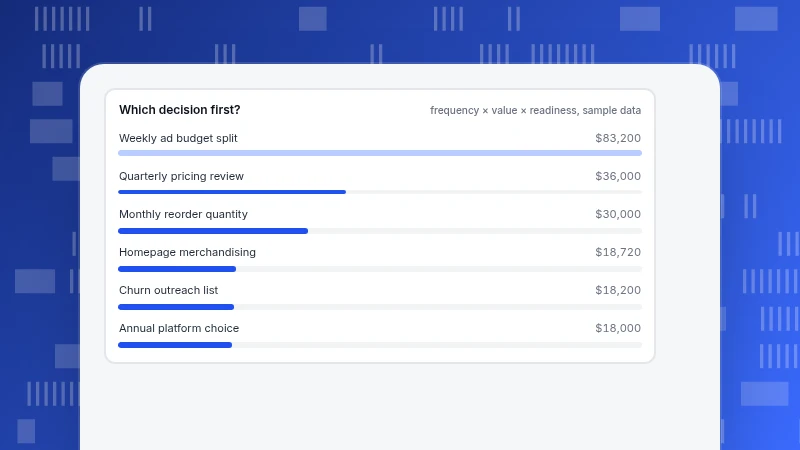
Data Analytics Strategy: A One-Page Plan Built Around Decisions
A data analytics strategy answers which decisions analytics serves, who owns each number and how you know it works. See a scored decision list, owner roles and a decision log you can copy.
Read more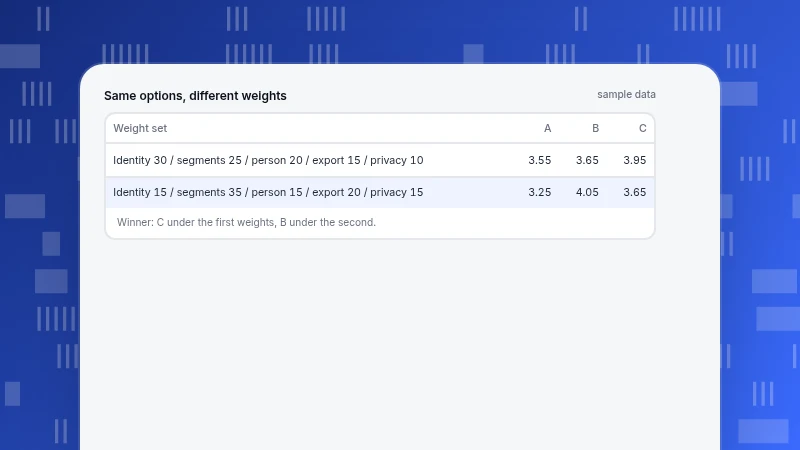
Customer Analytics Software: What to Check Before You Choose
Customer analytics software works on people, not page views. Check identity merge, segmentation and drill-down to one person, and see how weights can flip a scoring result.
Read more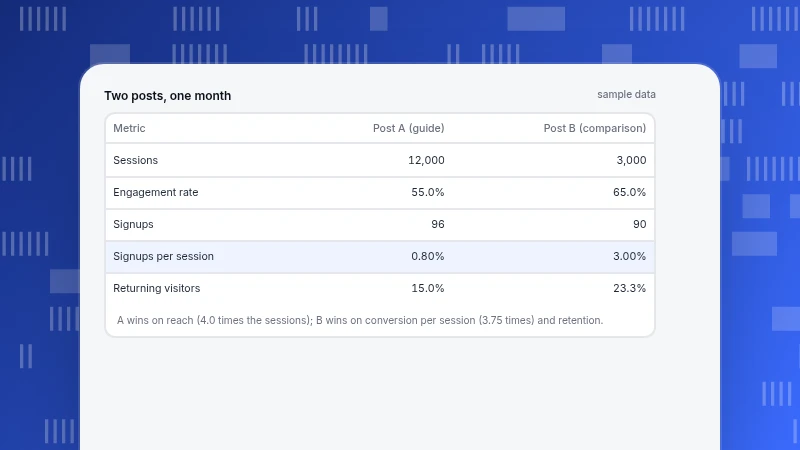
Content Metrics: Which Numbers to Use for Which Purpose
Content metrics fall into four purposes: reach, engagement, conversion and retention. Learn to pick one primary metric per piece, with a worked example of two posts that each win a different purpose.
Read more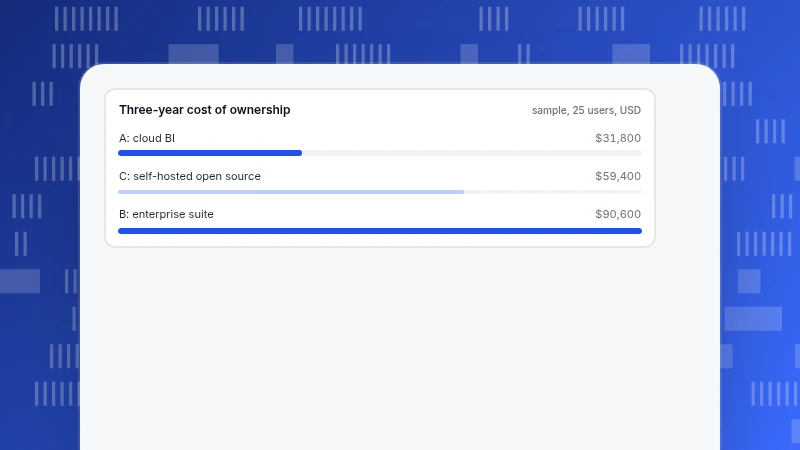
Business Analytics Software: How to Choose With 4 Criteria and a Scorecard
How to choose business analytics software on four criteria: data connection, modeling, collaboration and three-year cost. A recomputable cost table, a weighted scorecard that flips with the weights, and a two-week trial.
Read more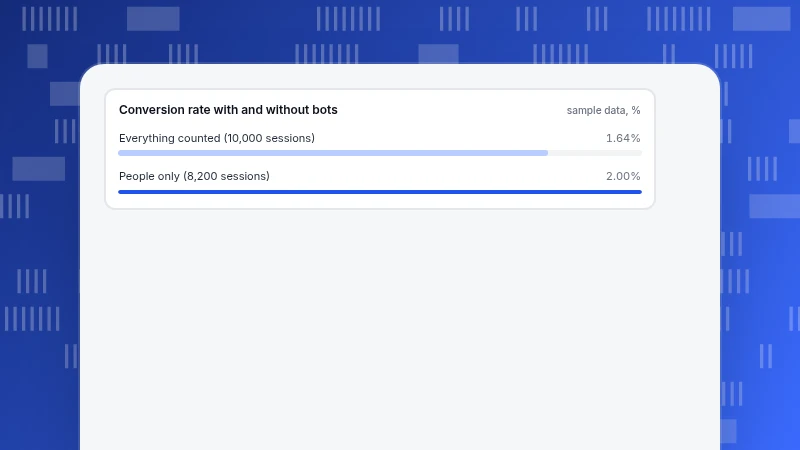
Website Traffic Statistics: How to Read the Numbers Behind Visitors, Sessions and Bots
Website traffic statistics depend on definitions: what counts as a visitor, how a session is cut, and whether bots are in. Worked examples on daily sums, bot inflation, session timeouts and noise, plus a test for published statistics.
Read moreOther categories
Each category answers a recurring question we hear from customers. Start with the one closest to your job.
Growth & Marketing
Acquisition, marketing, site and app operations, and how to pick the one stage worth fixing first.
238 articlesLive Chat
Proactive invites, translation and turning support conversations into conversions.
78 articlesAI Search
GPTBot, ClaudeBot, PerplexityBot: who fetches your pages, what the files say and what comes back.
39 articlesProduct News
What shipped, why we built it that way, and how to turn it on.
64 articles