Try it on your own data
Every report in this article is in the free plan. One snippet for web and apps, up to 10 sites.
Start freeAn example of causation is a randomized test: show a new checkout button to a random half of visitors and see higher sales in that half. Random assignment makes the groups alike apart from the change, so the difference can be attributed to it. This guide sets out the evidence ladder, three published cases where experiments and observation disagreed, and a worked example in which a 21.9-point retention gap turns out to be 2 points.
What you will learn
- Only a randomized test (or a close equivalent) justifies the word cause; adjusted and raw comparisons justify weaker wording
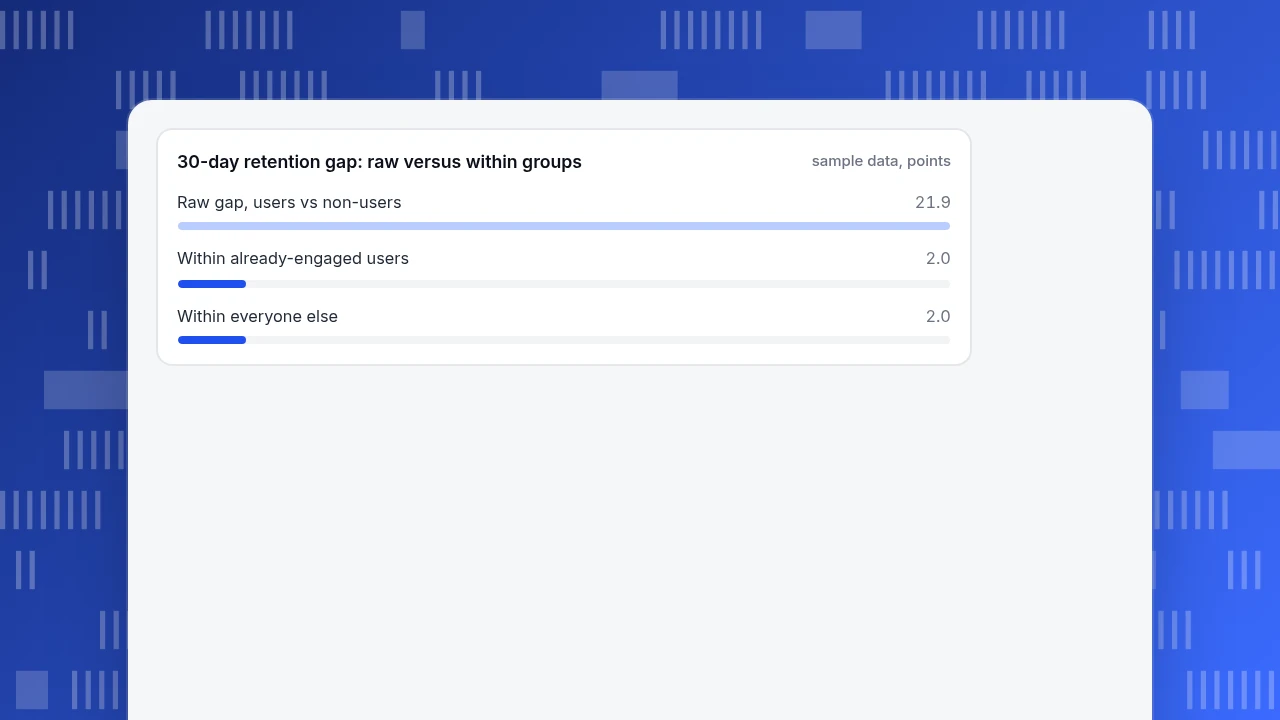
- In the sample, feature users retained 21.9 points better, but within comparable groups the effect was 2 points, a 10.9x overstatement
- Check order, third factors, who chose the exposure, chance and mechanism before writing caused
What counts as causation, and what evidence shows it?
Causation means that changing X, with everything else held equal, changes Y. A shop's checkout button turning green and sales rising the same week is a correlation. Showing the green button to a random half of visitors and finding more sales in that half is evidence of causation, because the random split makes the two halves alike in everything except the button.
This guide is about the evidence, not the vocabulary. For the difference between the two ideas and a list of confusing pairs, see correlation vs causation examples and the causation glossary entry. Here we take real cases, one product-analytics example you can recompute, and a short test for telling a cause from a coincidence.
The evidence ladder
| Evidence | What it rules out | Example in a product team |
|---|---|---|
| Randomized experiment | Confounders, selection, reverse causation (assignment is random and comes first) | Show the new onboarding to a random 50% of new sign-ups |
| Holdout or natural experiment | Most confounders, if assignment is as good as random | A feature launched to one country first, a region chosen by a coin flip |
| Observational data with adjustment | Only the confounders you measured | Comparing feature users with non-users within the same activity level |
| Raw correlation | Nothing | "Users of feature X retain better" |
Moving down the table, the claim you are allowed to make gets weaker. Everything in this guide is about what happens when people use a lower rung and speak as if they stood on the top one.
| Evidence | What it rules out | Example |
|---|---|---|
| Randomized experiment | Confounders, selection, reverse causation | Show new onboarding to a random 50% |
| Holdout or natural experiment | Most confounders if assignment is near random | Feature launched to one country first |
| Adjusted observational data | Only the confounders you measured | Compare users and non-users at the same activity level |
| Raw correlation | Nothing | Users of feature X retain better |
The claim you may make weakens as you move down the table.
Example 1: hormone therapy, randomized trial versus years of observation
The Women's Health Initiative randomized 16,608 healthy postmenopausal women to estrogen plus progestin or placebo. The trial was stopped early, after a mean of 5.2 years, because the treatment increased the risks of coronary heart disease, stroke, pulmonary embolism and invasive breast cancer. The authors concluded that overall risks exceeded benefits and that the regimen should not be started to prevent heart disease (Rossouw et al., JAMA 2002). The trial was run because observational evidence alone had left the balance of risks and benefits uncertain.
What makes this a causal example is the design: women were assigned by chance, so the groups did not differ in health habits, income or access to doctors. That is the property raw comparisons lack.
Example 2: a headline change measured at Bing
A small change to how ad headlines were displayed at Bing sat in the backlog until an engineer ran a quick online controlled experiment. It found a revenue lift of 12%, which would be more than $100 million a year in the United States alone, without hurting key user-experience metrics (Kohavi and Thomke, Harvard Business Review). The book by Kohavi and colleagues adds that Bing runs over 10,000 experiments a year and that a simple change with such a big effect happens only once every few years (Trustworthy Online Controlled Experiments).
Two lessons. First, nobody could have guessed from dashboards that this change mattered; a controlled test measured it. Second, most ideas do nothing, which is why you want the control group.
Example 3: when observational ad measurement disagreed with experiments
Gordon, Zettelmeyer, Bhargava and Chapsky compared observational methods with randomized experiments on the same advertising campaigns. They used 15 US experiments at Facebook with 500 million user-experiment observations, treated the experiments as the benchmark, and found that commonly used observational approaches often failed to measure the true effect of advertising (Marketing Science, 2019). Some studies came close and others did not, and the authors note that even fairly comprehensive data may be insufficient.
The point for marketers is not that observational data is useless. It is that you cannot tell from the observational result alone whether it is one of the close ones.
Example 4: a feature and retention, worked from numbers
Sample data: 10,000 new users, a new "saved views" feature, and 30-day retention. Users who are already engaged are much more likely to try the feature, and they also stay anyway.
| Group | Users | Tried the feature | 30-day retention, users | 30-day retention, non-users |
|---|---|---|---|---|
| Already engaged | 2,000 | 1,600 (80%) | 70% | 68% |
| Everyone else | 8,000 | 1,600 (20%) | 25% | 23% |
| All | 10,000 | 3,200 | 47.5% | 25.6% |
Compare feature users with non-users across the whole base and the gap is 47.5% − 25.6% = 21.9 points. Compare them within each group and the gap is 2 points in both (70% vs 68%, 25% vs 23%). The raw gap overstates the effect by a factor of 10.9, because engaged users are over-represented among feature users (1,600 of 3,200) and under-represented among non-users (400 of 6,800).
A randomized holdout, where a random 10% of users are not shown the feature, would balance the engaged users across both groups, so the measured difference would be expected to land near 2 points. The correlation in the dashboard is real. The causal claim "the feature lifts retention by 22 points" is not.
30-day retention gap: raw versus within groups
sample data, pointsWhen you cannot randomize: Hill's nine viewpoints
When randomized trials are impossible, evidence is built from several directions. Austin Bradford Hill listed nine "viewpoints" to ask of an association in his 1965 address, and he stressed that none can bring indisputable proof and none is a required checklist item (Hill, Proceedings of the Royal Society of Medicine, 1965). They translate well to product questions:
| Hill's viewpoint | Question for a product team |
|---|---|
| Strength | How large is the effect compared with ordinary noise? |
| Consistency | Does it show up in different segments, countries and months? |
| Specificity | Does the feature move the metric it should, and not everything? |
| Temporality | Did usage start before retention improved? |
| Biological gradient | Do heavier users of the feature retain better? |
| Plausibility | Can you explain the mechanism in one sentence? |
| Coherence | Does it fit what you already know about your users? |
| Experiment | Has anyone actually withheld the feature and measured? |
| Analogy | Do similar changes elsewhere behave this way? |
Five "yes" answers from observational data build a case; they do not replace the "experiment" row.
A quick test for cause versus coincidence
Before you write "caused", work through these checks in order:
- Order. Did X happen before Y? If Y came first, you may have reverse causation (churning users stop opening the app, so "less usage predicts churn" is partly the churn itself).
- Third factor. Is there something that makes both X and Y more likely? Engaged users in Example 4 are the pattern.
- Who picked X? If people chose the feature themselves, assume selection until a random assignment says otherwise.
- Chance. How many comparisons did you run before finding this one? Many tests make a lucky result likely, and a correction such as Bonferroni shows how much.
- Dose. Does more of X go with more of Y?
- Replication. Does it hold in a second period or segment?
- Mechanism. Can you tell the story of how X moves Y in one sentence?
If checks 1–3 fail, stop. The remaining four only matter when the first three pass.
Words to match the evidence
| Evidence you have | Safe wording | Avoid |
|---|---|---|
| Randomized test, enough sample | "The change increased conversion by X points (95% interval …)" | "Proves" without an interval |
| Holdout or natural experiment | "The change likely increased …" | Overstating how random the split was |
| Adjusted observational | "Is associated with, after adjusting for …" | "Causes", "drives" |
| Raw comparison | "Users who did X had Y" | Any forward-looking claim ("will lift") |
Dashboards, chat transcripts and slide decks are where wording drifts; fix it at the source.
What TapCub can and cannot tell you about cause
Use the saved-views example. TapCub shows who used the feature and who stayed; the causal step is a design decision outside it.
- See the raw gap. Build a retention report in All-platform analytics › Behavior › Behavior analysis for people who did the feature event and those who did not. This reproduces the 47.5% versus 25.6% comparison and nothing more.
- Compare within activity levels. Add a segment or breakdown for already-engaged users from All-platform analytics › Users › Segments & tags and repeat. A gap that shrinks is a sign of a confounder.
- Mark the launch. Add a date annotation under Configuration › Annotations so launches, campaigns and price changes sit on the chart next to the metric.
- Treat explanations as explanations. All-platform analytics › Operations › AI Assistant has a change-attribution view that breaks a metric change down by channel, referrer domain, country, device and landing page. It shows where a change happened, not why.
- Read chat conversion carefully. Live chat › Reports › Conversion attribution compares visitors who chatted with those who did not, and shows relative lift. It warns when fewer than 30 visitors chatted. People who start a chat are often already closer to buying, so the lift is an upper bound, not a causal estimate.
TapCub does not run experiments, split traffic or hold out users. Assign the holdout in your own code, send the group as an event property, and use TapCub to compare outcomes.
FAQ
What is an example of causation?
Giving a random half of visitors a new checkout button and seeing higher sales in that half is causal evidence, because random assignment makes the groups alike apart from the button. A hormone-therapy trial that randomized 16,608 women and found higher stroke and breast cancer risk is another.
How do you prove causation?
Randomize who gets the change and compare outcomes. When you cannot, combine several lines of evidence: the cause precedes the effect, the effect grows with exposure, it holds across groups, and a mechanism makes sense. Hill's 1965 viewpoints are the classic list, and none is a guarantee.
What is the difference between correlation and causation?
Correlation means two measures move together. Causation means changing one moves the other. The feature-and-retention example shows the gap: users of the feature retained 21.9 points better, yet within comparable groups the difference was 2 points, because engaged users both adopt and stay.
Can observational data show causation?
Sometimes, with care. Adjusting for known confounders and checking consistency and dose-response can strengthen a case, but unmeasured factors stay unaddressed. In Facebook's 15 advertising experiments, common observational methods often failed to match the randomized result, which is why a holdout is worth running.
Does a significant p-value prove causation?
No. A p-value tells you how surprising the data would be if there were no effect. It says nothing about why two things move together. A significant difference between self-selected groups can come entirely from who chose to be in each group.
Sources
- Rossouw, J. E. et al. (2002), Risks and benefits of estrogen plus progestin in healthy postmenopausal women, JAMA 288(3), 321–333. Checked 2026-11-20.
- Kohavi, R. and Thomke, S. (2017), The Surprising Power of Online Experiments, Harvard Business Review; and Kohavi, Tang and Xu, Trustworthy Online Controlled Experiments, chapter 1. Checked 2026-11-20.
- Gordon, B. R., Zettelmeyer, F., Bhargava, N. and Chapsky, D. (2019), A Comparison of Approaches to Advertising Measurement: Evidence from Big Field Experiments at Facebook, Marketing Science 38(2), 193–225. Checked 2026-11-20.
- Hill, A. B. (1965), The environment and disease: association or causation?, Proceedings of the Royal Society of Medicine 58, 295–300.
Was this article helpful?
We use your answers to fix and expand this page.
Couldn’t send. Please try again in a minute.
Thanks for the feedback. We’ll use it to improve this page.You’ve already sent feedback on this page. Thanks.

Product Experience Specialist
Writes about product experience, practical workflows, and growth, turning complex processes into clear steps for everyday decisions.