Try it on your own data
Every report in this article is in the free plan. One snippet for web and apps, up to 10 sites.
Start freeThe best way to learn correlation vs causation is by examples, and the useful ones come from your own data. Below are ten from product, marketing and support, each with the likely third factor and a test, plus two worked cases: site-search users who convert 5.8 points higher, of which 72% was returning visitors, and 90.6% odds that random metrics throw up a false pair.
What you will learn
- For every example, ask whether a third factor pushes both numbers or whether the arrow runs backwards
- In the sample, a 5.8-point conversion gap shrank to 1.6 points after splitting by new vs returning visitors; it did not vanish, and it is still not proof
- Ten random metrics tracked for 20 weeks produce at least one false significant pair 90.6% of the time, so pick the pairs before you look
What does correlation without causation look like in real data?
It looks like a good chart. Two numbers rise together, someone says "so doing A raises B", and the story is plausible enough that nobody checks. The check is one question, asked of every example below: is there a third factor that pushes both numbers, or does B push A? The concept comparison, with definitions of both terms, is in correlation vs causation, and causation defines what would count as proof. This page is the practice set.
Every case falls into one of three patterns:
- A third factor pushes both (a confounder): returning visitors both search more and buy more.
- The arrow runs backwards: valuable customers use the product more, so usage "predicts" value without creating it.
- Chance: with enough pairs of metrics, some will line up in a short period for no reason at all. The second worked example below counts how many.
| Pattern | What happens | Typical test |
|---|---|---|
| Third factor pushes both | Returning visitors search more and buy more | Split by the suspected factor and compare inside each group |
| Reverse direction | Valuable customers use the product more | Check time order; define the outcome window after the cause |
| Chance | Some of many metric pairs line up for no reason | Choose pairs in advance; confirm in a second period |
The three patterns behind every example in this article.
Which ten correlation vs causation examples come up most in product and marketing data?
These are common patterns to test, not findings: each "likely explanation" is a hypothesis you would check in your own data with the test in the last column.
| # | What the data shows | A likely third factor or direction | How to test it |
|---|---|---|---|
| 1 | Visitors who use site search convert more | Returning visitors search more and buy more (confounder) | Compare search users and non-users within new and within returning visitors |
| 2 | Users who turn on notifications retain better | Engaged users opt in; opting in is a symptom of engagement (selection) | Compare within the same first-week activity level; or test showing the prompt to a random half |
| 3 | Visitors who chat buy more | People who already intend to buy start chats (selection) | Compare by entry page and intent signals; hold out a random group from the chat invite |
| 4 | Email subscribers spend more | Existing, loyal customers subscribe (selection) | Compare each person's spend before and after subscribing against non-subscribers over the same dates |
| 5 | Longer pages rank higher in search | Older, better-linked pages tend to be longer; or topic type drives both | Compare within one page type and one age band |
| 6 | Ad spend and revenue rise together | Budget is set as a share of revenue (reverse), and both rise in peak season | Look at the lag (does spend rise before revenue?); run a region holdout |
| 7 | Customers who contact support churn more | A bug or a bad experience drives both contacts and churn (common cause) | Compare within the same issue category |
| 8 | Customers who have stayed 12 months rate the product higher | Unhappy customers already left, so only satisfied ones remain to be asked (survivorship) | Include those who left; see survivorship bias |
| 9 | Faster pages convert better | Possibly a real cause, but slow pages are also older phones, weak networks and some countries | Compare by device and country; test a speed fix on part of traffic |
| 10 | Traffic and sales both rise in December | Seasonality drives both | Compare with the same weeks last year; look at the share, not the totals |
Example 9 is the useful reminder that "third factor" does not mean "no effect". Speed may well cause conversion; the point is that the raw gap overstates it and a test sizes it.
Worked example: do site-search users convert because of search?
Sample data: 10,000 visitors in a month. 3,000 used site search; 7,000 did not.
| Group | Visitors | Conversions | Conversion rate |
|---|---|---|---|
| Used search | 3,000 | 318 | 10.6% |
| Did not use search | 7,000 | 338 | 4.8% |
| Gap | +5.8 points |
At face value, search users convert more than twice as often. Now split by one candidate third factor, whether the visitor had been to the site before:
| Visitor type | Group | Visitors | Conversions | Rate |
|---|---|---|---|---|
| Returning (4,000) | Used search | 2,400 | 288 | 12.0% |
| Returning | Did not use search | 1,600 | 176 | 11.0% |
| New (6,000) | Used search | 600 | 30 | 5.0% |
| New | Did not use search | 5,400 | 162 | 3.0% |
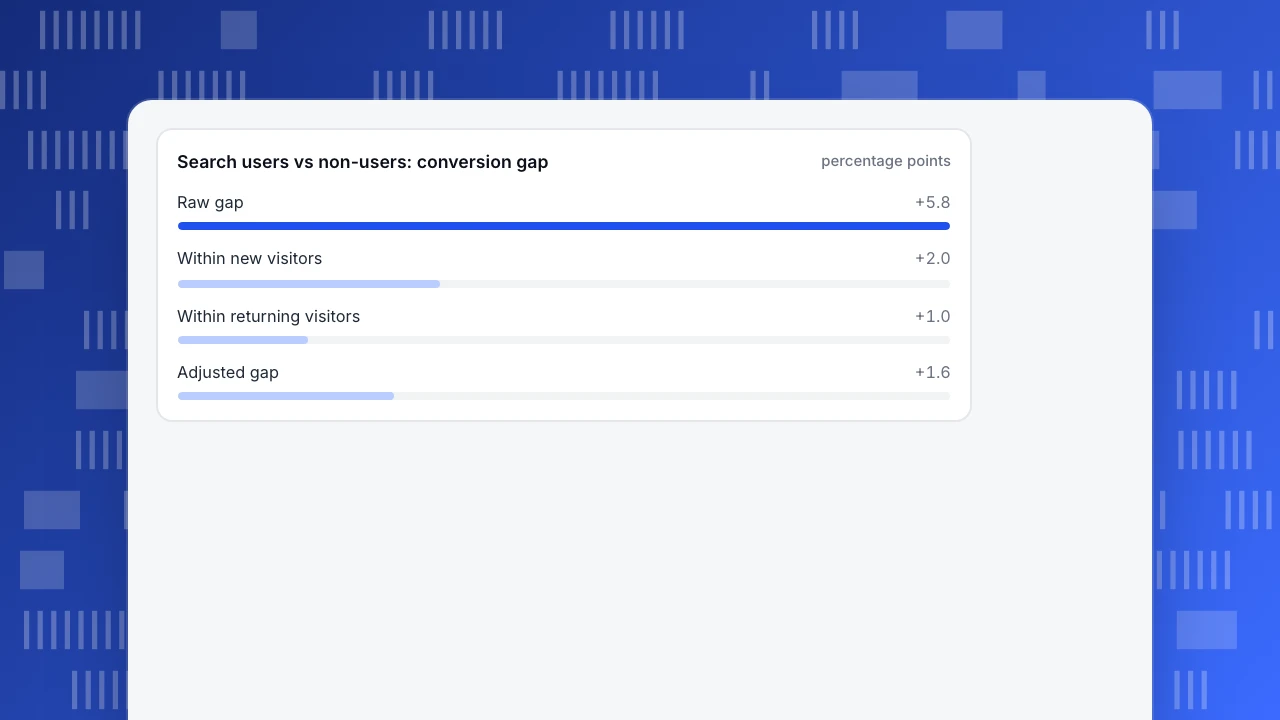
Within returning visitors the gap is +1.0 point; within new visitors it is +2.0 points. Weighted by the mix of the 10,000 visitors (40% returning, 60% new), the adjusted gap is 0.4 × 1.0 + 0.6 × 2.0 = +1.6 points, so about 72% of the headline gap disappears. The reason is visible in the mix: 80% of search users were returning visitors (2,400 of 3,000), against 23% of non-search users (1,600 of 7,000). Returning visitors convert at 11% to 12% whether or not they search.
The remaining 1.6 points is still not proven to be caused by search. It controls for one factor, and the people who search may differ in other ways, such as arriving with a product in mind. It is a better estimate than 5.8 points, and a good reason to run a cheap test of a more prominent search box.
Search users vs non-users: conversion gap
percentage pointsWorked example: how many "relationships" appear by chance?
The third pattern deserves numbers. Sample data (simulated): a dashboard tracks 10 metrics, each as 20 weekly values, and all of them are random noise with no relationship to each other.
- 10 metrics give 10 × 9 ÷ 2 = 45 pairs.
- With 20 weeks (18 degrees of freedom), a correlation counts as statistically significant at the 5% level when |r| is above about 0.444.
- If there are no real relationships, 5% of pairs should still cross that line: 45 × 0.05 = 2.25 pairs on average.
- In a simulation of 3,000 such dashboards, the average number of "significant" pairs was 2.3, and 90.6% of dashboards had at least one.
So a dashboard with 10 metrics will usually show at least one "significant" relationship that means nothing. The practical rules that follow:
- Decide which pairs to look at before opening the data. A hypothesis you wrote down beats a correlation matrix you scanned.
- Keep a second period. A pattern found in weeks 1–20 should still be there in weeks 21–40 before anyone acts on it.
- Ask for a mechanism. If you cannot say how A would change B, treat the pair as a lead, not a finding.
- Raise the bar when you scan many pairs. The threshold should be stricter the more pairs you look at.
How do you test a suspected causal link?
Pick the cheapest method that rules out the explanation you worry about most:
| Method | What it rules out | Cost |
|---|---|---|
| Split by the suspected third factor | That factor as the cause of the gap | Low: one extra breakdown |
| Check the order in time | The reverse direction | Low: define the outcome window after the cause |
| Compare before and after, with a comparison group | A shared trend or seasonality | Medium: needs a comparable group |
| Dose-response (more A, more B) | Some chance and selection explanations | Low if the data exist |
| Holdout or A/B experiment | Everything, if assignment is random | High: traffic, time, sometimes tooling |
Run them in this order. Most "causal" claims in dashboards fail at the first row.
What mistakes make correlation vs causation examples go wrong?
- Using only the famous examples. Ice cream and drowning are easy to see through. The dangerous ones are plausible: the feature "everyone loves", the channel that "converts best".
- Splitting by a variable the cause works through. If a discount works by raising visits, controlling for visits erases part of the real effect.
- Declaring the effect zero after one split. The gap shrank from 5.8 to 1.6 points, not to zero.
- Reading a chart's shape as proof of direction. A line that goes up together says nothing about which one moves first.
- Averaging across groups of very different size. Compare rates inside groups, and weight them deliberately.
How do you use TapCub to check examples like these?
Take the site-search example. TapCub gives you the splits and the order in time; it does not give you the experiment.
- Define the group. In All-platform analytics › Users › Segments & tags, create a rule segment from the search event within a time window. Segments can be used as a group in other analyses, so "search users" means the same thing everywhere.
- Split by the suspected third factor. In All-platform analytics › Behavior › Behavior analysis, build a funnel from first visit to your goal event and break it down by channel or another property; breakdown keeps the 10 largest groups. Retention has no breakdown, so filter it one value at a time.
- Check whether a chat-style example is selection. In Live chat › Reports › Conversion attribution, compare visitors who chatted with those who browsed and did not chat, with the relative lift (chatted rate ÷ no-chat rate − 1) and the pages where chats started. It flags a sample under 30 chatted visitors. Treat the lift as a comparison of two self-selected groups, not as proof that chat caused the sales.
- Ask what moved. In All-platform analytics › Operations › AI Assistant, the Why did it change tab splits a metric's change across channel, referrer domain, country, device and entry page. It shows where the change sits, not why it happened.
- Run the test elsewhere. TapCub does not run A/B experiments or feature flags; it only measures. If you run an experiment in your own tool, send the variant as an event property and compare the groups here.
FAQ
What is a good example of correlation without causation?
Site-search users converting at 10.6% against 4.8% for non-users, in the sample here. Most search users were returning visitors, who convert at 11% to 12% anyway. After splitting by new and returning, the gap fell from 5.8 to 1.6 points.
What is the classic example of correlation vs causation?
Ice cream sales and swimming-pool use both rise in warm weather, so one does not cause the other. It is a clean teaching case, but product data is usually harder, because the third factor is something you did not think to measure.
Can two variables be correlated and also causal?
Yes. Correlation is needed for most causal claims, and a real cause usually shows up as one. The problem is that correlation is not enough, so you also need the right time order and other explanations ruled out.
How do you prove causation?
A randomised experiment is the strongest way, because chance decides who gets the change. Without one, you can narrow the explanations by splitting by third factors, checking time order and comparing before and after with a comparison group.
Why do random metrics sometimes correlate?
With many pairs and few data points, some pairs will cross the significance line by chance. In the simulation here, 10 random metrics over 20 weeks produced at least one "significant" pair 90.6% of the time.
Sources
- Hill, A. B. (1965). The Environment and Disease: Association or Causation? Proceedings of the Royal Society of Medicine, 58(5), 295–300.
- Pearl, J. (2009). Causal inference in statistics: An overview. Statistics Surveys, 3, 96–146.
- Greenland, S., et al. (2016). Statistical tests, P values, confidence intervals, and power: a guide to misinterpretations. European Journal of Epidemiology, 31, 337–350.
Was this article helpful?
We use your answers to fix and expand this page.
Couldn’t send. Please try again in a minute.
Thanks for the feedback. We’ll use it to improve this page.You’ve already sent feedback on this page. Thanks.

Technical Engineer
Focuses on tracking code, SDKs, and API integrations, with practical guidance on implementation checks and troubleshooting.