Try it on your own data
Every report in this article is in the free plan. One snippet for web and apps, up to 10 sites.
Start freeA link building report is a periodic table of the links you won, the sites they came from and what they did for the business: links won, new referring domains, links lost, referral sessions, goal conversions and cost per link, per domain and per conversion. Put last month beside this month so every number has context, and add a one-paragraph narrative. Below: the template with sample numbers, where each metric comes from and what not to claim.
What you will learn
- Report outcomes beside outputs: referral sessions, conversions and cost per conversion, not only the number of links won
- State Google Links report limits in the footer: a sample of links, tables capped at 1,000 rows, and no nofollow flag
- Log every link when it goes live and mark paid placements with rel="sponsored" so the monthly report is a summary, not a reconstruction
What is a link building report for?
A link building report answers one question for whoever pays for the work: did the links we earned or bought this period make the site more findable and bring people who did something useful? Counting links answers only the first half. A report that lists 40 new URLs and nothing else is an activity log, not a report.
The report has three readers, and each wants different rows:
- The person doing the outreach wants to know which tactics produced links and what each cost.
- The person owning SEO wants to know whether new referring domains are different sites, not more links from the same ones.
- The person approving budget wants to know whether the links produced visits and conversions, and what each cost.
The template below puts all three in one table. For how to win the links in the first place, see how to get backlinks; for the definition of what you are counting, see backlink.
What goes into a link building report template?
Build the report as a table with the previous period beside the current one, so every number has context. Sample data, one month:
| Metric | Last month | This month | Change | What it tells you |
|---|---|---|---|---|
| Links won | 9 | 12 | +33% | Output of the outreach work |
| New referring domains | 7 | 9 | +29% | Links from sites that did not link before |
| Links lost or removed | 1 | 2 | +1 | Whether earlier work is holding |
| Total referring domains (month end) | 148 | 156 | +8 | 148 + 9 new − 1 lost |
| Paid placements | 1 of 9 | 2 of 12 | 11% → 17% | Share you must label as paid |
| Sessions from won links | 510 | 640 | +25% | Whether links bring visitors |
| Goal conversions from those sessions | 12 | 19 | +58% | Whether visitors do something useful |
| Conversion rate of those sessions | 2.35% | 2.97% | +0.62 pts | Quality of the traffic |
| Spend | $2,700 | $3,600 | +33% | Budget used |
| Cost per link | $300 | $300 | 0% | Efficiency of the work |
| Cost per new referring domain | $385.71 | $400.00 | +4% | Cost of reaching a new site |
| Cost per goal conversion | $225.00 | $189.47 | −16% | Cost of an outcome |
How the derived rows are computed: conversion rate = goal conversions ÷ sessions (19 ÷ 640 = 2.97%); cost per link = spend ÷ links won ($3,600 ÷ 12 = $300); cost per new referring domain = spend ÷ new referring domains ($3,600 ÷ 9 = $400); cost per goal conversion = spend ÷ goal conversions ($3,600 ÷ 19 = $189.47). Last month: $2,700 ÷ 12 goals = $225.00.
| Metric | Where to get it | Pitfall |
|---|---|---|
| Links won | Your outreach log | Log wins as they happen |
| Referring domains | Search Console Links report | A sample, grouped by root domain |
| Paid status | Your log and the link's rel attribute | Links report does not show nofollow |
| Referral sessions | Analytics, by referring host | Missing referrers fall into direct |
| Conversions | Goals in analytics | Compare with the site average |
| Cost | Invoices and hours | Include staff time |
Sample monthly values are in the template table above.
Which link building metrics are worth reporting, and where does each come from?
| Metric | Where to get it | Pitfall |
|---|---|---|
| Links won | Your own outreach log: URL, date, anchor text, tactic, cost | Do not rely on a tool to discover your wins; log them when they happen |
| Referring domains | Google Search Console's Links report, grouped by root domain | Counts include links found over time that may since have been removed |
| Paid or sponsored status | Your log, plus the link's rel attribute on the page | The Links report does not show whether a link is nofollow |
| Referral sessions | Your analytics, by referring host | Session counts follow your analytics tag, not the other site's own numbers |
| Conversions | Goals in your analytics | Compare with the site average, not with zero |
| Cost | Invoices and hours | Include staff time or the cost per link is understated |
Do not put authority scores or third-party "domain rating" numbers at the top of the report. They are tool-specific, not something Google publishes, and they can move without anything you did. If a client wants one, show it in a footnote with the tool's name.
Worked example: reading the sample month
The table gives three findings that a link count alone would miss.
- Efficiency was flat; outcomes improved. Cost per link stayed at $300 in both months, but cost per goal conversion fell 16%, from $225.00 to $189.47, because the visits converted better: 2.35% to 2.97%.
- The links reached new sites, but slightly more expensively. Nine of the 12 links were from new domains (75%); the other three were from domains that had already linked. Cost per new referring domain rose 4%, from $385.71 to $400.00.
- Traffic from links converted better than the average visitor. Suppose the site-wide conversion rate is 2.1%. Then 2.97% ÷ 2.1% = 1.41, so visits from won links converted about 41% better. That is a reason to keep the tactic, but note that 640 sessions and 19 conversions are small numbers: one more or one fewer conversion moves the rate by about 0.16 percentage points.
A short narrative under the table does the rest: "Won 12 links (8 editorial, 2 paid and marked sponsored, 2 directory listings). Two earlier links were removed. Referral sessions from won links rose 25%; 19 converted." Say what changed and what you will do next month, not what the tool counted.
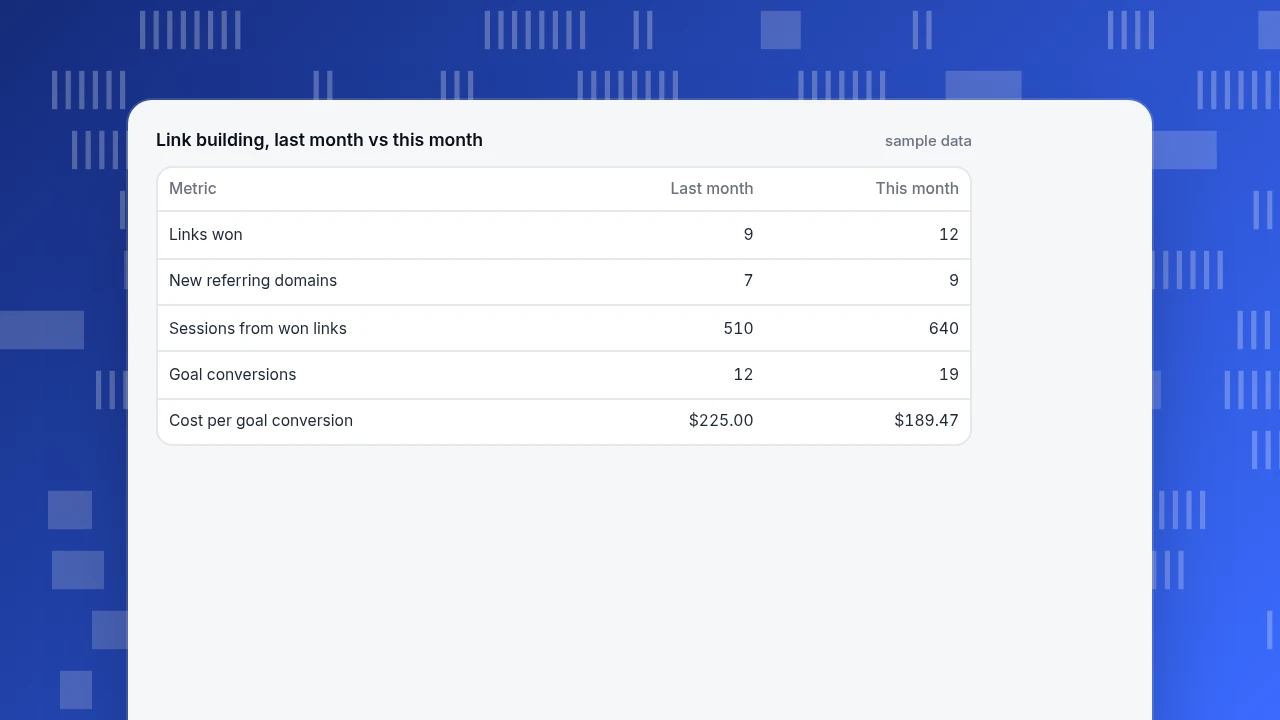
Link building, last month vs this month
sample data| Metric | Last month | This month |
|---|---|---|
| Links won | 9 | 12 |
| New referring domains | 7 | 9 |
| Sessions from won links | 510 | 640 |
| Goal conversions | 12 | 19 |
| Cost per goal conversion | $225.00 | $189.47 |
What does Google's Links report show, and what are its limits?
The Links report in Search Console is the free first-party source for your referring domains. Google documents four tables (Search Console Help):
- Top linked pages (external): which of your pages have the most backlinks.
- Top linking sites (external): which sites contain the most links to you, grouped by root domain.
- Top linking text (external): which anchor text is used.
- Internal links: which pages are linked most from within your own site.
The documentation also states the limits you should repeat in the report footer: tables are limited to 1,000 rows; the report shows a sample of links, so some URLs may be omitted; links Google found over time may since have been removed; and the report does not indicate whether a link is marked nofollow. Exports can reach 100,000 rows through the "Latest links" and "More sample links" slices. A report that says "Search Console shows 156 referring domains" should add "(sample, root-domain grouping)".
What should a link building report not claim?
- Do not count bought links as earned. Google's spam policies define link spam as links created primarily to manipulate search rankings, and list buying or selling links for ranking purposes (Google Search Central). Paid links are not forbidden as advertising, but they need to be qualified.
- Mark paid placements. Google's guidance is to use
rel="sponsored"for paid placements or advertisements,ugcfor user-generated content such as comments, andnofollowwhen the other values do not apply (Google Search Central). The report row "paid placements" exists to show you are keeping this clean. - Do not promise rankings. The report shows what links were won and what visitors did. A ranking change has many causes; report it separately, with dates.
- Do not hide lost links. Two removed links belong in the table next to twelve new ones.
How often should you report, and what should it be compared with?
Monthly is a sensible default: link wins arrive in lumps, and a week of outreach can show zero. Compare with three baselines:
- Last period, as in the template.
- The same period a year earlier, if seasonality matters.
- The target set at the start, such as "10 links and 6 new referring domains a month at a cost per link under $350". The sample month beat it on all three.
Put the targets in the first column. A number without a target forces the reader to guess whether it is good.
How to report link building results with TapCub
TapCub does not find backlinks, crawl other sites or give authority scores. Use Search Console or your link tool for discovery. What TapCub measures is the part after the click: who arrived from each linking site and what they did.
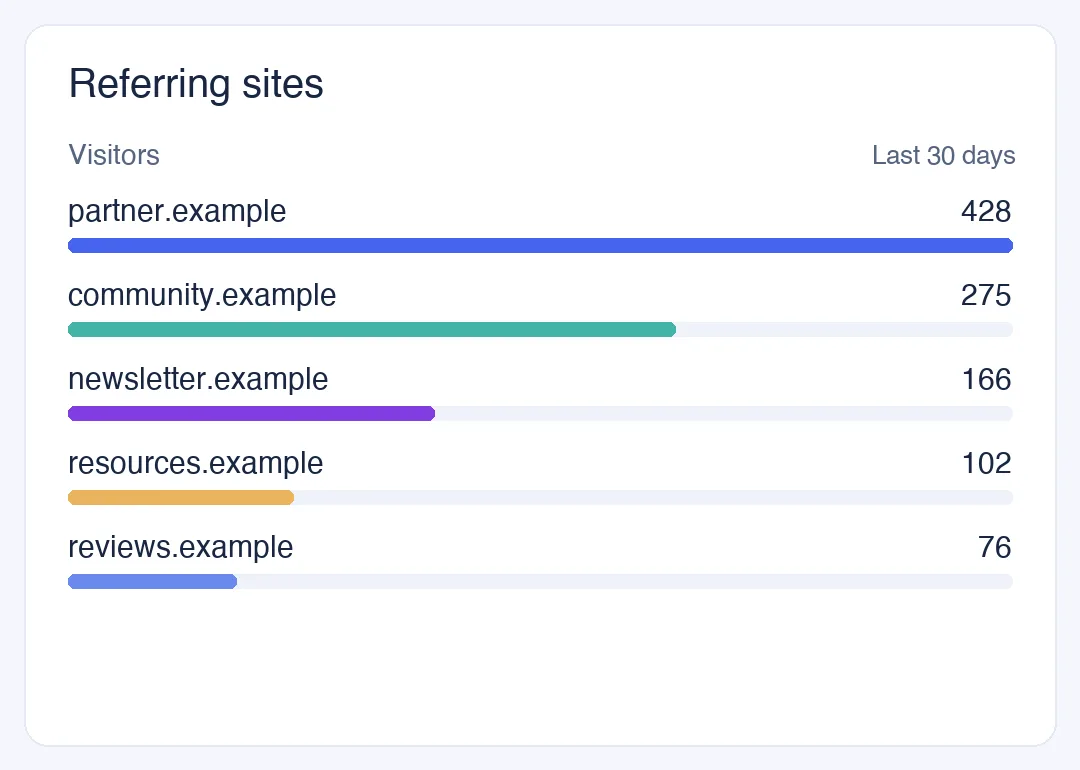
- See which linking sites sent people. In Web analytics › Sources, the Referrers tab lists referring sites with visitors, sessions, pageviews, bounce and duration. Switch the counting method between First source of session (the default) and Every arrival depending on whether mid-session arrivals matter to you.
- Filter to one site. Click a row to add that referrer as a filter; other reports narrow with it, so you can see which pages the visitors landed on.
- Count conversions. Define a goal in Web analytics › Goals (a page or an event). Its conversion rate divides by unique visitors in the range. The channel table in Sources also shows conversions per channel.
- Tag outreach you control. For paid placements and newsletters you can put
utm_source,utm_mediumandutm_campaignon the link, then read them on the UTM tab. Plain editorial links cannot be tagged, so they arrive as referrals. - Check search impressions on the linked page. Once Google Search Console is connected, Monitoring › Search performance shows clicks, impressions, click-through rate and average position by page, with data usually one to three days late. Use it as supporting evidence, not as proof that a link caused a change.
One boundary to state in the report: in-site hops are internal, not referrals, so a click from your own pages never inflates the link numbers.
FAQ
What is a link building report?
A link building report is a periodic summary of the links you won, the sites they came from and what they did for the business: referring domains, referral visits, conversions and cost. It compares the current period with the last one, so the reader can see change, not just totals.
What metrics should a link building report include?
Links won, new referring domains, links lost, paid or sponsored share, sessions from the linking sites, goal conversions and cost per link, per new domain and per conversion. Add a short narrative: what changed, why and what happens next month. Leave tool-specific authority scores in a footnote.
How do you measure the traffic a backlink brings?
Use your analytics referrer report: filter sessions by the linking site's host, then count goal conversions among them. For links you control (sponsorships, newsletters), add UTM parameters. Note that the referrer is missing when a browser or app strips it; those visits fall into direct traffic.
Does Google Search Console show all my backlinks?
No. Google's documentation says the Links report shows a sample of links, tables are limited to 1,000 rows, and links it found over time may since have been removed. The report also does not show whether a link is nofollow. Treat the numbers as a sample for trend, not an audit.
How often should link building be reported?
Monthly for most programmes, because link wins come in clumps and weekly numbers swing. Keep a running log of every link as it goes live, with its date, anchor, tactic and cost, so the monthly report is a summary of the log rather than a reconstruction.
Sources
- Google Search Console Help. Links report — the four tables, the 1,000-row limit, sampling, and that nofollow status is not shown. Checked 2026-11-20.
- Google Search Central. Spam policies for Google web search — the link spam definition and buying or selling links. Checked 2026-11-20.
- Google Search Central. Qualify your outbound links to Google —
sponsored,ugcandnofollow. Checked 2026-11-20.
Was this article helpful?
We use your answers to fix and expand this page.
Couldn’t send. Please try again in a minute.
Thanks for the feedback. We’ll use it to improve this page.You’ve already sent feedback on this page. Thanks.

Data Engineer
Writes about event design, data quality, and collection workflows, with verifiable implementation methods for reliable analytics.