Try it on your own data
Every report in this article is in the free plan. One snippet for web and apps, up to 10 sites.
Start freeExecutive reporting is a short, regular summary that tells leaders how the business moved, why, and what you need from them. The format that works fits on one page: a headline sentence, five KPIs compared with last month and last year, a checked cause, actions with owners and one ask. Below is the structure, a worked sample report from web analytics, and how to compare periods and set a cadence.
What you will learn
- Five KPIs, one per decision area, each with a single written definition and a comparison
- Write the "why" only after four checks: real, human, mix, event
- Cut KPIs before cutting the narrative, and end every report with one ask
What is executive reporting, and what should it do?
Executive reporting is the regular, short summary that tells senior people three things: how the business moved, why, and what you need from them. It is not a smaller version of the analyst's dashboard. An analyst report answers "what are all the numbers?"; an executive report answers "what should we decide this month?"
The test for every line on the page: would a decision change if this number moved? If not, it belongs in the appendix or nowhere. Most executive reports fail by showing 20 metrics with no point of view, so the reader has to do the analysis. The structure below fits on one page, uses five numbers and ends with a decision. For longer periodic documents, see business report; for a leader whose job is marketing, see CMO dashboard.
What goes on a one-page executive report?
Five blocks, in this order, because executives read from the top and stop when they have what they need:
| Block | Size | What it contains |
|---|---|---|
| 1. Headline | 1 sentence | The one thing that changed and whether it is good: "Revenue +6.3% month on month; conversion slipped 0.1 points after a slower site" |
| 2. Five KPIs | 5 rows | Current value, previous period, change, same period last year, change |
| 3. Why | 2–3 sentences | The cause, with the check that supports it |
| 4. Action and owner | 1–3 bullets | What is being done, by whom, by when |
| 5. Ask | 1 line | What you need from the reader: a decision, a budget, an unblock |
If the page is longer than one screen when printed, remove KPIs, not the narrative. The narrative is the part only you can write.
How do you choose the five KPIs?
Apply four rules, in order:
- One per decision area. Revenue (are we growing), traffic (is demand there), conversion (is the site turning demand into orders), order value (is each order worth more), and one health measure (is anything breaking). More than that is a dashboard.
- One definition, written once. "Visitors" must mean the same thing in every report: for example, human visitors only, with bots reported separately. When a definition changes, say so on the page.
- A mix of leading and lagging. Revenue lags; page speed and conversion lead it. Include at least one that can warn you before the money moves.
- Rates and absolutes together. Conversion fell 0.1 points while revenue rose 6.3%, because traffic grew. Either number alone misleads.
| KPI | Decision it informs | Definition to write once |
|---|---|---|
| Revenue | Are we growing? | Orders × average order value, in one currency |
| Human visitors | Is demand there? | Visitors excluding recognised bots |
| Conversion rate | Does the site turn demand into orders? | Orders ÷ human visitors, in points |
| Average order value | Is each order worth more? | Revenue ÷ orders |
| Mobile LCP, 75th percentile | Is anything breaking? | Real-user Largest Contentful Paint, P75 |
One KPI per decision area; if you cannot name the decision, remove the KPI.
What does a finished sample report look like?
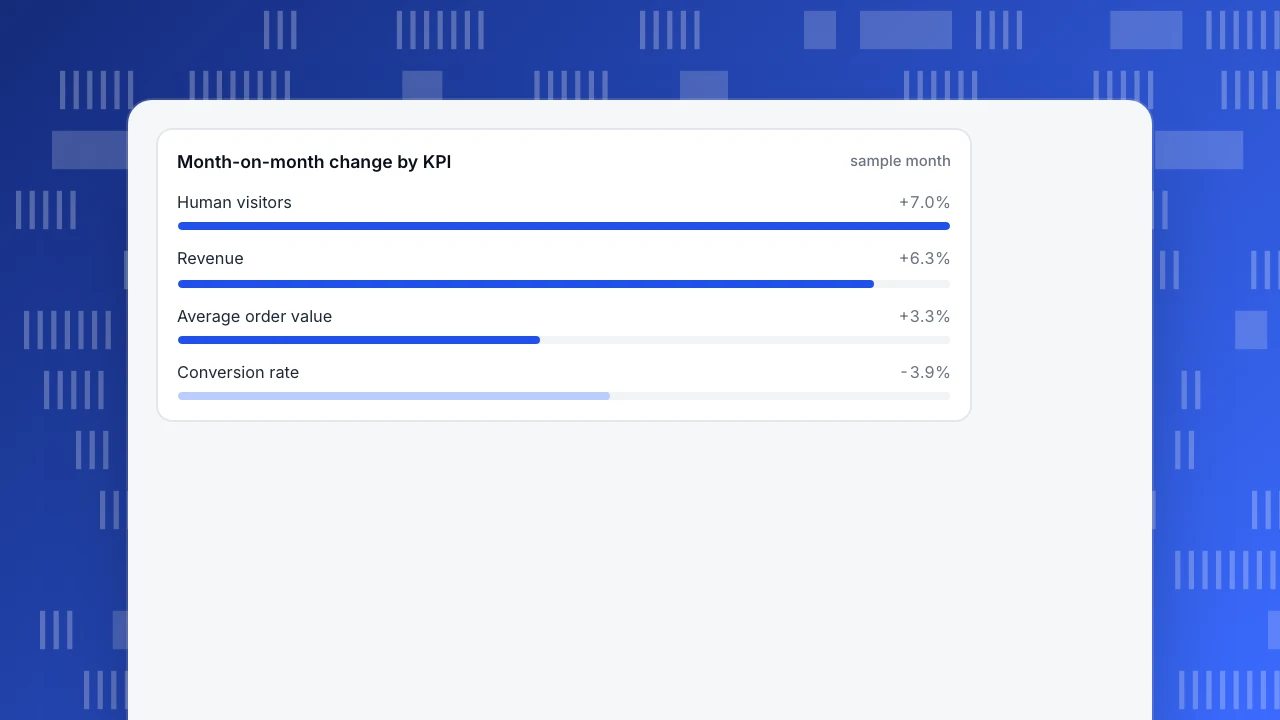
Sample data for one month. The five KPIs, with the current month against the previous month and the same month last year:
| KPI | This month | Last month | Change | Same month last year | Change |
|---|---|---|---|---|---|
| Revenue | $66,030 | $62,100 | +6.3% | $46,806 | +41.1% |
| Human visitors | 42,600 | 39,800 | +7.0% | 35,100 | +21.4% |
| Conversion rate | 2.50% | 2.60% | −0.10 pts | 2.30% | +0.20 pts |
| Average order value | $62.00 | $60.00 | +3.3% | $58.00 | +6.9% |
| Mobile LCP, 75th percentile | 2.7 s | 2.4 s | +0.3 s | 2.9 s | −0.2 s |
Recompute: revenue is orders × average order value, so 1,065 × $62.00 = $66,030, 1,035 × $60.00 = $62,100 and 807 × $58.00 = $46,806. Conversion is orders ÷ visitors: 1,065 ÷ 42,600 = 2.50%, 1,035 ÷ 39,800 = 2.60%, 807 ÷ 35,100 = 2.30%. Revenue growth month on month (+6.3%) is roughly visitors (+7.0%) and order value (+3.3%) pushed up and conversion pulled down.
Narrative, in the three sentences the page needs.
- Headline: "Revenue grew 6.3% on the month and 41.1% on the year, but conversion slipped 0.1 points."
- Why: "Mobile load time (75th percentile) crossed the 2.5-second threshold to 2.7 seconds after the 12 November homepage video release. The release is marked on the chart."
- Action and ask: "Compress the hero video and re-test by 5 December (owner: web lead). No budget needed; we need approval to remove the video from mobile if it is not fixed by then."
The 2.5-second threshold is the "good" limit for Largest Contentful Paint at the 75th percentile in Core Web Vitals; naming the standard keeps the reader from asking whether 2.7 seconds is bad.
Month-on-month change by KPI
sample monthHow do you write the "why" so the reader believes it?
An unchecked explanation is the weakest line on the page. Before writing the "why", run four checks and keep the result in the sentence:
| Check | What you look at | What you can then write |
|---|---|---|
| Is it real? | Sample size and whether the change is bigger than a normal week-to-week swing | "Conversion moved 0.1 points; weekly swings this quarter were within 0.15 points, so treat it as a watch item" |
| Is it people or bots? | Human-only visitors versus all requests | "Visitors are human-only; crawler traffic was flat" |
| Is it mix? | Split by device and channel, the same two periods | "Both desktop and mobile conversion rose; the blended rate fell because mobile share grew" |
| Is it an event? | Releases, campaigns, outages on the period | "Mobile LCP crossed 2.5 s after the 12 November release" |
Write one of these per KPI that moved, and say "not yet checked" when it is true. In the sample report the conversion dip is small: 0.10 points, or about 3.9% of 2.60%. It earns a place on the page only because two checks agree: the speed measure crossed a threshold in the same week as the release. If only one check had pointed at it, the honest line would be "watching, no action yet".
How should you compare periods?
Two comparisons cover almost everything, and they answer different questions:
- Against the previous period (month on month) shows momentum, but mixes in seasonality.
- Against the same period last year removes the seasonal pattern but is slow to show turning points.
Seasonality is not a footnote. The US Census Bureau publishes quarterly e-commerce share both ways: for the third quarter of 2026 it is 17.9% seasonally adjusted and 17.2% unadjusted (Census Bureau, Quarterly Retail E-Commerce Sales, released 19 November 2026). The same quarter reads 0.7 percentage points apart depending on adjustment, which is 4.1% of the lower figure. For rates, report the change in percentage points (2.60% to 2.50% is −0.10 pts); for counts and money, report percent. Never write "conversion fell 4%" when you mean 0.1 points.
Mark any one-off event on the period, such as a promotion, an outage or a release, so the reader knows whether a comparison is clean.
How often should each report go out?
| Cadence | Length | What it holds | Who reads it |
|---|---|---|---|
| Weekly flash | 5 numbers, no narrative | Same five KPIs, week on week, flagged if outside a range | Team leads |
| Monthly one-pager | One page | The structure above | Executives |
| Quarterly review | 2–3 pages | Trends over 12 months, results of past actions, decisions needed | Leadership team |
The weekly flash exists so the monthly page never contains a surprise. If a number moves enough to matter between reports, send it then rather than waiting.
What are the common mistakes?
- Twenty KPIs. The reader will pick the ones they like. Five numbers with a view beat twenty with none.
- No comparison. "2.5%" without last month and last year has no meaning.
- Bots in the numbers. If crawlers count as visitors, traffic looks healthy and conversion looks poor. Say whether the number is human-only.
- Explaining without checking. "Because of the holiday" is a guess unless you compare to the same holiday last year.
- Hiding bad news. A page that always says "on track" stops being read. Lead with the number that got worse.
- No ask. A report with no request is a status update, and status updates get skimmed.
How do you build and send this report in TapCub?
Using the sample report above as the target:
- Pull the five numbers. In Web analytics › Reports turn on Show change and compare with the previous period. The data report compares with the previous period or the same period last week; for the same month last year, set the date range to last year's month and record the values. Recognised bots are counted separately, so visitors and conversion are human-only. Mobile LCP comes from Monitoring › Performance at P75; that page does not show a previous-period comparison, so note last month's value when you publish it.
- Mark the event. Add the 12 November release in Configuration › Annotations so the dip has an explanation on the chart. For "why did it change", the AI Assistant (All-platform analytics › Operations › AI Assistant) can split a change by channel, source domain, country, device and landing page.
- Send it on a schedule. In Configuration › Settings › Notifications set up daily, weekly or monthly subscribed reports (the plan has to include scheduled reports). The report carries visitors, pageviews, sessions, bounce rate and average duration with period change, plus conversions for enabled goals; weekly goes out on Monday and monthly on the 1st. That is a good base for the weekly flash, and the monthly one-pager you still write, because the narrative is yours.
- Share a read-only view. In Configuration › Settings › Public sharing create a read-only link, optionally with a password and a limit on how many days back can be seen, for the modules you choose (overview, pages, sources, audience, bots). Visitor lists and sessions cannot be shared publicly.
TapCub does not write the narrative or decide which five KPIs matter; it supplies consistent numbers, comparisons and annotations so the page can be assembled in minutes.
FAQ
What is executive reporting?
It is the recurring short summary that tells leaders how the business moved, why, and what is being done or needed. It differs from operational reporting by being brief, comparative and decision-oriented.
What should an executive report include?
A headline, about five KPIs with a period comparison, a short explanation of the cause with its supporting check, the actions with owners and dates, and one ask. Anything that would not change a decision belongs in an appendix.
How many KPIs should an executive report have?
Around five: one each for revenue, demand, conversion, order value and a health measure. If you cannot say what decision each one informs, remove it.
How long should an executive report be?
One page for the monthly report, which prints on a single sheet, with a weekly flash of five numbers and a quarterly review of two to three pages. Cut KPIs before cutting the narrative.
How often should executives get a report?
Monthly for the one-pager, plus a weekly five-number flash so the monthly never holds a surprise. Quarterly for the trend and decisions.
Sources
- U.S. Census Bureau: Quarterly Retail E-Commerce Sales, 3rd quarter 2026, checked 2026-11-21
- web.dev: Web Vitals, checked 2026-11-21
Was this article helpful?
We use your answers to fix and expand this page.
Couldn’t send. Please try again in a minute.
Thanks for the feedback. We’ll use it to improve this page.You’ve already sent feedback on this page. Thanks.

Data Engineer
Writes about event design, data quality, and collection workflows, with verifiable implementation methods for reliable analytics.