Try it on your own data
Every report in this article is in the free plan. One snippet for web and apps, up to 10 sites.
Start freeTo prevent fake accounts, judge sign-ups by what they do afterwards, not by what they type. Count how many behavioral signals each sign-up triggers, such as no prior visit, a form sent in seconds or zero events in 7 days, then match friction to the count: let zero through, confirm email at one, hold at two or more.
What you will learn
- A fake sign-up shows in its behavior after signing up: no visit before, seconds to submit, zero events after
- In the sample, sign-ups with 2 or more signals activated at 0.0% against 44.7% for zero signals, and 12% of sign-ups were held
- Match friction to evidence and watch the false-positive cost: blocking the one-signal tier would lose 15 real activated people
What counts as a fake account, and why measure it first?
A fake account is a registration created to be used, not to be a customer: to claim a free trial again and again, to post spam, to launder reviews, or to probe your login form. OWASP's Automated Threat Handbook calls the automated version OAT-019 Account Creation: bulk accounts created through your normal sign-up process, later used for spam, cash or goods laundering, malware distribution, reputation damage and manipulation of reviews or surveys.
The scale can be large even for companies with serious defences. Meta's annual report for 2023 estimates that false accounts may have represented about 4% of its worldwide monthly active users in the fourth quarter, and says the true number could differ significantly from the estimate. If a company with that much detection effort can only give a rough percentage, a small SaaS team should not expect a precise number either. What you can do is measure how your sign-ups behave afterwards and act on the gap.
That is the idea of this guide: a fake signup is easier to recognise by what it does not do after signing up than by what it types into the form. Names and email addresses are cheap to invent. A realistic visit before the form, a few page views after it and a first real action are expensive to fake at volume.
Which behavioral signals separate fake signups from real ones?
Each signal below is something your analytics can already see. None of them proves a signup is fake on its own, which is why the next section combines them.
| Signal | What it looks like in your data | Why people trip it by accident |
|---|---|---|
| No browser visit before the signup | A sign-up event arrives from your server with no page view, session or referrer for that device | Sign-ups through a mobile app or a partner API that you never instrumented |
| Form submitted in seconds | Less than 5 seconds from first page view to submit; no scroll, no clicks | Password managers and browser autofill are fast, but still leave a page view and some interaction |
| Zero events after signup | No page view or event in the 7 days after the sign-up | Real people who signed up and forgot; they come back later, so measure at day 7 or day 14 |
| Burst from one network | Many sign-ups in one hour from one network range (ASN) or one email domain | A company or school signing up a class at the same time |
| Disposable or patterned email | Throwaway domains, or sequences like name+1, name+2 | Privacy-minded users who use aliases on purpose |
| Same device, many accounts | One device ID bound to several sign-ups in a day | Shared computers in offices and libraries |
Notice the right-hand column. Every signal has an innocent explanation, so a single signal should lead to a mild step, such as an email confirmation, never a block.
How do you score and tier signups?
Count how many signals each sign-up triggers, then look at what each group did afterwards. The count is the score, and the later behaviour tells you whether the score means anything.
Sample data: 3,000 sign-ups in one month. A sign-up counts as activated if the person completed the product's first key action within 7 days.
| Signals triggered | Sign-ups | Activated | Activation rate |
|---|---|---|---|
| 0 | 2,250 | 1,005 | 44.7% |
| 1 | 390 | 15 | 3.8% |
| 2 or more | 360 | 0 | 0.0% |
| All | 3,000 | 1,020 | 34.0% |
Two results matter. First, the headline activation rate of 34.0% is dragged down by the last two rows: remove the 360 sign-ups with 2 or more signals and it rises to 1,020 ÷ 2,640 = 38.6%; keep only the zero-signal group and it is 1,005 ÷ 2,250 = 44.7%. A team that tries to improve onboarding against the 34.0% figure is chasing a problem that is partly not people.
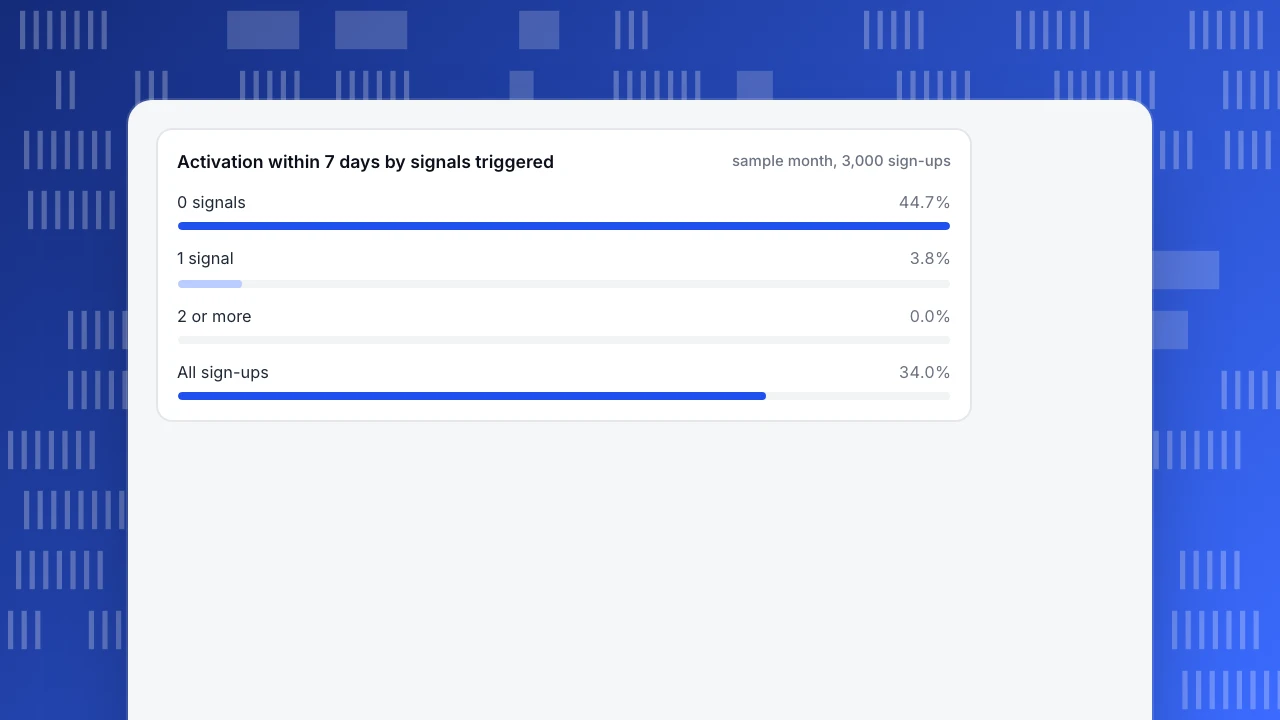
Second, the score separates the groups cleanly. Nobody in the 2-or-more group activated, and only 3.8% of the one-signal group did, against 44.7% for the rest. A score is useful only if the groups it creates behave differently afterwards, so run this table on your own data before you decide any thresholds.
Activation within 7 days by signals triggered
sample month, 3,000 sign-upsWhat should you do with each tier?
Match the friction to the evidence. The sample's tiers translate into three rules:
- 0 signals: let through. Do nothing extra. Adding friction here costs real sign-ups and gives you nothing back.
- 1 signal: step-up check. Ask for email confirmation before the account can invite others, send messages or start a trial. A real person clears this in a minute; a script that never reads mail does not.
- 2 or more signals: hold for review or block at your backend. In the sample this is 360 of 3,000 sign-ups (12%) and none activated. Hold them for a short review window instead of deleting them, so you can check a few by hand.
The checks themselves, such as email confirmation, rate limits, CAPTCHAs or blocking a network range, happen in your own application or your fraud tooling. Analytics supplies the evidence for where to set the thresholds; it does not stop the sign-up.
| Signals triggered | Action | Sample sign-ups |
|---|---|---|
| 0 | Let through | 2,250 (75.0%) |
| 1 | Email confirmation before inviting, messaging or trialing | 390 (13.0%) |
| 2 or more | Hold for review or block at your backend | 360 (12.0%) |
Sample data: 3,000 sign-ups in one month; the action is carried out by your application, not by analytics.
How do you avoid blocking real people?
Every threshold trades fake sign-ups caught against real ones lost, and the sample lets you put numbers on both. The 15 activated people in the one-signal tier are the real customers you would lose if you blocked that tier outright, 15 of 1,020 activated sign-ups, or 1.5%. Blocking it would catch 375 non-activating sign-ups. A step-up email check is the better price: it keeps most of the 15, because a real person completes it, and still stops scripts.
Three habits keep the false-positive rate honest:
- Review a sample of every tier. Open 20 accounts from the 1-signal tier each month. If more than a few look like real people, the signal is too noisy.
- Wait long enough before calling an account inactive. Measure at day 7 or later; a person who signs up on Friday evening may not return until Monday.
- Watch the group you remove. Compare month-over-month support tickets and replies to your onboarding emails; if real people complain they could not join, loosen the rule.
Which numbers show prevention is working?
Track these numbers monthly, each with its denominator written down:
| Metric | Formula | Sample result |
|---|---|---|
| Activation rate | Activated within 7 days ÷ accounts let through | 34.0% before holding; 38.6% after holding the 360 (1,020 ÷ 2,640) |
| Held share | Held sign-ups ÷ all sign-ups | 360 ÷ 3,000 = 12.0% |
| Activated accounts held | Activated sign-ups in the held group ÷ all activated sign-ups | 0 ÷ 1,020 = 0.0% |
| Step-up pass rate | Confirmed email ÷ step-up requests | Measure it; far below 90% suggests mail landing in spam or an annoying step |
| Sign-up support tickets | Tickets mentioning sign-up ÷ sign-ups | Measure it before and after; this is the guardrail |
The third row is the one that tells you the rule is safe: if real, activated people start appearing in the held group, loosen it. The last row catches the harm the first rows cannot see, people who never became an account because the step-up check put them off. If activation rises while sign-up complaints rise sharply too, you are blocking real people.
How do you do this in TapCub?
Take the sample month above. This is how you would rebuild the table with TapCub data. TapCub measures sign-ups and their behaviour; it does not verify emails, rate-limit forms or block accounts, so the actions stay in your own backend.
- Send the sign-up from your server and identify the person. Report the sign-up as a server-side event, and call
tapcub.loginin the browser once the account exists. The first login backfills that browser's anonymous history onto the person, so a sign-up with a normal visit shows page views before it, and one without shows none. Server-side events do not count as activity by default; set the sign-up event to Counts under All-platform analytics › Data › Events & properties if you want it to count as the user showing up. - Build the sign-up funnel. In All-platform analytics › Behavior › Behavior analysis, make a funnel from the sign-up event to your activation event with a 7-day window, and break it down by source. A source whose activation rate is a fraction of the others is the first place to look.
- Save the suspicious group as a segment. In All-platform analytics › Users › Segments & tags, create a rule segment: did the sign-up event, did not do any page view in the 7 days after. Anonymous visitors never enter segments, so this works for people you have identified.
- Check the bot layer and replay a few. Web analytics › Bots shows how TapCub's five detection layers (user agent, headers, client signals, network and frequency) classify automated traffic, which is separate from sign-ups that bypass your pages entirely. Session replay is off by default; if you turn it on, open a few sessions from the 1-signal tier to see what those people did.
- Alert on bursts. Under All-platform analytics › Operations › Monitors, point a monitor at a saved metric of unique sign-up events per hour or day. Use the dry run to see how often it would have fired in the past 30 days. TapCub only notifies; it does not change anything.
FAQ
How do you detect fake accounts?
Look at what accounts do after signing up. Fake sign-ups tend to arrive without a normal visit, submit the form in seconds, never fire another event, cluster on one network or reuse one device. Count how many signals each account triggers and check that the high-count group really behaves differently.
How do you prevent fake account creation without hurting real users?
Scale friction to evidence: let zero-signal sign-ups through, ask for email confirmation when one signal fires, and hold or block only when several fire together. Review a sample of each tier monthly and watch sign-up support tickets as a guardrail.
What percentage of accounts are fake?
It varies widely and is hard to measure. Meta estimated in its 2023 annual report that false accounts may have been about 4% of worldwide monthly active users in Q4 2023, and cautioned that the real figure could differ significantly. For your product, measure the share of sign-ups with zero events after 7 days.
Is a CAPTCHA enough to stop fake accounts?
Rarely on its own. A CAPTCHA raises the cost of scripted sign-ups but does not catch people who are paid to complete them or attackers who go through an API. Combine it with behavioural signals and an email check, and measure whether activation improved.
Sources
- OWASP, OAT-019 Account Creation, Automated Threat Handbook — definition and the later misuse of bulk accounts. Checked 2026-11-21.
- Meta Platforms, Form 10-K for fiscal 2023 — false accounts estimated at about 4% of worldwide MAU in Q4 2023, with the caveat that the actual figure may vary significantly. Checked 2026-11-21.
Was this article helpful?
We use your answers to fix and expand this page.
Couldn’t send. Please try again in a minute.
Thanks for the feedback. We’ll use it to improve this page.You’ve already sent feedback on this page. Thanks.

Product Experience Specialist
Writes about product experience, practical workflows, and growth, turning complex processes into clear steps for everyday decisions.