Try it on your own data
Every report in this article is in the free plan. One snippet for web and apps, up to 10 sites.
Start freeEnterprise analytics solutions are analytics products a large organisation can run across teams, sites and regions with controlled access and compliance evidence. Compare them on three requirements: scale, governance and privacy. Write hard requirements as pass or fail gates, score only the vendors that pass, and test how much the winner depends on your weights.
What you will learn
- Turn scale into numbers a vendor can confirm: the sample is 240 million events a month, about 93 per second on average and 463 at peak
- Make hard requirements gates (processor contract, region, raw export, single sign-on) and score only the survivors
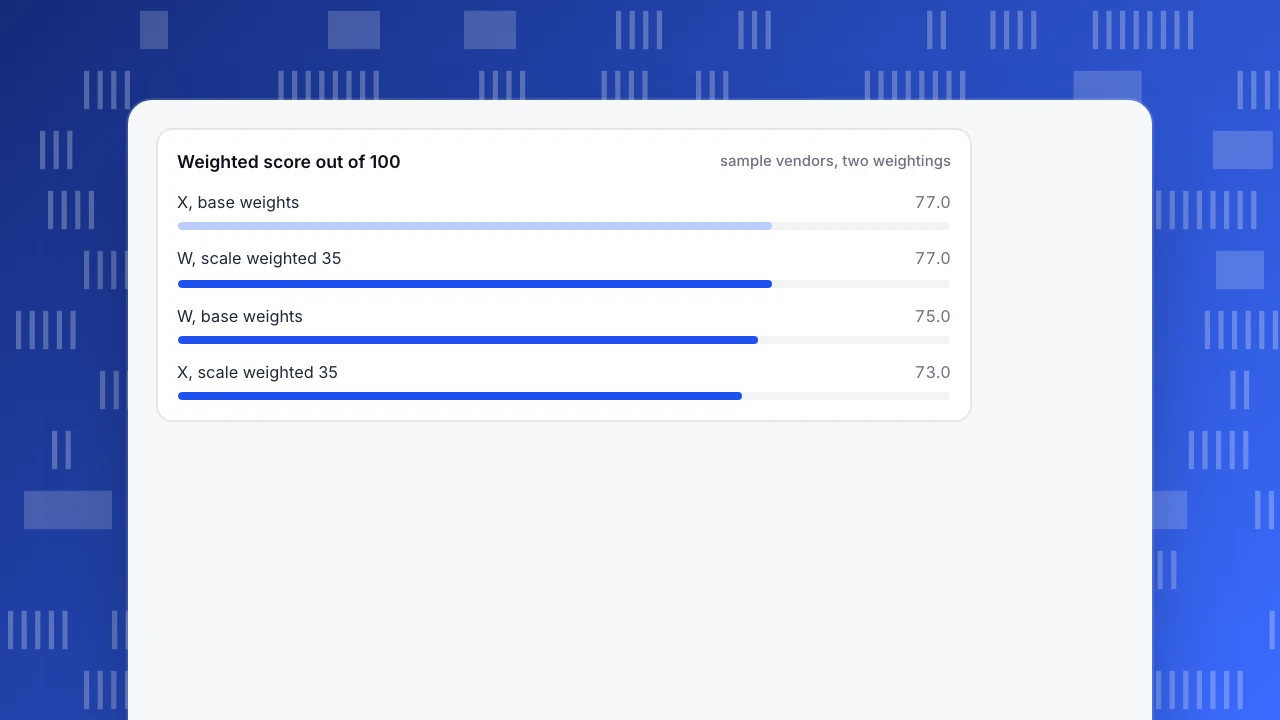
- Weights decide close races: in the sample X wins 77.0 to 75.0, then loses 73.0 to 77.0 when scale counts for 35
What changes when analytics becomes enterprise
Enterprise analytics solutions are analytics products that a large organisation can run across many teams, sites and regions with controlled access and proof of compliance. What separates them from a team tool is not the chart types. It is three requirements that grow with size: scale (how much data and how many people), governance (who can see and change what, and whether definitions stay consistent) and privacy (where data lives and under what contract).
A vendor can be strong on dashboards and still fail one of these three, and the failure usually appears after the contract is signed. For a wider look at platform types, see data analytics platforms and business analytics software. The approach below is to write requirements first, turn the hard ones into pass or fail gates, and score only the vendors that pass. Every number in the worked examples is sample data you replace with your own.
Size the scale you need
Scale is vague until you turn it into numbers a vendor can answer. Sample data: a company with 20 million sessions a month and 12 tracked events per session.
| Quantity | Calculation | Result |
|---|---|---|
| Events per month | 20,000,000 × 12 | 240,000,000 |
| Events per day | 240,000,000 ÷ 30 | 8,000,000 |
| Average events per second | 8,000,000 ÷ 86,400 | about 93 |
| Peak events per second (5× average) | 93 × 5 | about 463 |
| Storage per month at 1 KB (1,000 bytes) per event | 240,000,000 × 1,000 bytes | 240 GB |
| Storage for 25 months of history | 240 GB × 25 | 6.0 TB |
Ask each vendor to confirm in writing that it handles your peak rate, how long raw events are kept, how many projects or sites one account can hold and how long a typical query takes on 25 months of data. The peak rate matters more than the average, because a sale or a launch can send five times the normal traffic for an hour.
Count people as well as data: how many analysts will query, how many only read dashboards, and whether read-only viewers are priced differently.
| Quantity | Calculation | Result |
|---|---|---|
| Events per month | 20,000,000 sessions × 12 | 240,000,000 |
| Average events per second | 240,000,000 ÷ 30 ÷ 86,400 | about 93 |
| Peak events per second (5×) | 93 × 5 | about 463 |
| Storage for 25 months at 1 KB per event | 240 GB × 25 | 6.0 TB |
Sample data: replace sessions, events per session and event size with your own.
Governance: who can see and change what
Governance requirements stop an analytics estate from becoming 40 versions of the same metric. Write each one as a testable sentence.
| Requirement | Test sentence |
|---|---|
| Access control | A regional analyst can see only their region's projects |
| Roles | Viewers cannot edit definitions; owners can |
| Single sign-on | Staff sign in with the company identity provider and are removed when they leave |
| Audit trail | You can see who changed a metric or exported data, and when |
| Shared definitions | A metric defined once appears the same in every report |
| Change control | A planned event list exists, and unplanned events are flagged |
Of these, shared definitions cause the most trouble. When two teams each define "active user", their numbers disagree for months. Look for a tracking plan or data dictionary that records every event and property with an owner, and a way to see events that arrive without being planned.
Privacy: the contract and the controls
Privacy requirements have two halves: what the vendor will sign and what the product can do.
On the contract side, if the vendor processes personal data for you it acts as a processor, and GDPR Article 28 requires a written contract. That contract must cover processing only on documented instructions, confidentiality of the people involved, the security measures of Article 32, authorisation for sub-processors, help with data subject requests, deletion or return of data at the end, and audits. Article 32 lists examples of security measures, including pseudonymisation and encryption, the ability to restore availability after an incident, and regular testing of the measures.
The stakes are real. Under Article 83, breaches of the controller and processor obligations in Articles 25 to 39 can lead to fines of up to 10 million euros or 2% of worldwide annual turnover, whichever is higher, and breaches of the basic principles, consent conditions or data subject rights up to 20 million euros or 4%.
On the product side, ask for: storage region options, collection levels you can set per region, retention periods you can configure, and the ability to act on access and deletion requests for one person. Also ask for a SOC 2 report; AICPA's SOC 2 covers the trust services categories of security, availability, processing integrity, confidentiality and privacy. Ask which categories the report covers and for what period.
Integration and exit
Enterprise buyers often forget to plan the exit. Test these four points before signing:
- Raw export. Can you export event-level data on a schedule, and in what format?
- Query access. Can analysts run SQL on the same events, or only use the vendor's interface?
- Inputs. Can you import history from files and send events from servers as well as browsers and apps?
- Programmatic access. Is there an API and are keys managed per team?
The exit test is simple: ask the vendor to export a month of your data in a trial and load it into your own warehouse. If it cannot, you have a lock-in.
Support and service terms
Write down what happens when something breaks: the response time for a data outage, who your named contact is, and how incidents are reported. Ask whether an availability figure appears in the contract and what you receive if it is missed. A promise in a sales call is not a term. If a figure matters, it must be in the agreement.
Gates first, then a weighted score
A scoring sheet should not rescue a vendor that fails a hard requirement. Separate the two:
Gates are pass or fail. Sample data: four anonymous vendors against four gates.
| Gate | Vendor W | Vendor X | Vendor Y | Vendor Z |
|---|---|---|---|---|
| Signs a processor contract | Pass | Pass | Pass | Fail |
| Stores data in the required region | Pass | Pass | Fail | Pass |
| Exports raw events | Pass | Pass | Pass | Pass |
| Single sign-on | Pass | Pass | Pass | Pass |
| Result | Continue | Continue | Out | Out |
Only W and X go to scoring. Score each area from 1 to 5, multiply by the weight, add up and divide by 5 for a score out of 100.
| Area | Weight | Vendor W | Vendor X |
|---|---|---|---|
| Scale | 25 | 4 | 3 |
| Governance | 25 | 3 | 5 |
| Privacy | 20 | 4 | 4 |
| Integration | 15 | 5 | 3 |
| Support | 10 | 3 | 4 |
| Cost | 5 | 3 | 4 |
| Weighted score | 100 | 75.0 | 77.0 |
X wins by two points. Now test the weights. If scale matters more for this company (weight 35) and governance less (15), W scores 77.0 and X scores 73.0, and the winner changes. A two-point result is a tie; do not choose on it. Decide the weights before the demos, and run a proof of concept to separate close vendors.
Weighted score out of 100
sample vendors, two weightingsA four-week proof of concept
- Week 1: Install on one real site and one app. Compare event counts with your own logs; a gap above 5% is a tracking problem.
- Week 2: Rebuild three reports your teams use today and time how long each takes.
- Week 3: Have a regional analyst and a viewer try the access rules, and send a test deletion request.
- Week 4: Export a month of events into your warehouse and confirm the counts match.
Set pass marks for each week before you start and write down the result.
Cost over three years
Compare total cost, not the list price. Add licence fees, extra seats, data volume overage, implementation work, and the staff time to maintain tracking. Sample data: licence 60,000 a year plus 15,000 overage when volume exceeds the plan, plus 40,000 in the first-year implementation, plus 20,000 a year staff time. Three-year total = 3 × (60,000 + 15,000 + 20,000) + 40,000 = 3 × 95,000 + 40,000 = 325,000. A vendor that looks cheaper per licence can cost more once overage and staff time are counted.
In TapCub
Use this checklist against TapCub's own documentation rather than assuming a row passes. Several rows map to features TapCub documents:
- One script for web, apps and mini programs, with data in one project. SDKs cover iOS, Android, Flutter, React Native and HarmonyOS.
- Privacy: the Configuration › Privacy center sets the collection level, retention and handles data subject requests such as export and deletion.
- Data out and in: All-platform analytics › Data › Data export makes asynchronous raw exports, Data import takes CSV events and logs, and the SQL console in All-platform analytics › Behavior › Metrics & SQL queries events directly. API keys are in Configuration › Settings › API keys.
- Change control: the tracking plan and event inbox flag events that were never planned.
- B2B: All-platform analytics › Users › Accounts groups people by company with a health score.
- Access and audit: project roles (owner, admin, analyst, viewer, agent) and, per member, a scope that limits channels, platforms or hostnames and hides chosen properties, set in Configuration › Settings › Members. Configuration › Settings › Audit log records member changes and privacy changes and exports CSV, NDJSON or JSON, up to 50,000 rows at a time.
The product fact card and the docs checked here do not describe single sign-on or contractual availability terms, so confirm those with the sales team before ticking them.
FAQ
What are enterprise analytics solutions?
They are analytics products that a large organisation can run across many teams, sites and regions, with controlled access, shared definitions and compliance evidence. The differences from a team tool are scale, governance and privacy, not chart types.
What should an enterprise analytics checklist include?
Scale (events per second at peak, retention, query time), governance (roles, single sign-on, audit trail, shared definitions), privacy (processor contract, region, retention, deletion), integration and exit (raw export, SQL, API) and support terms. Turn hard requirements into pass or fail gates.
How do I compare enterprise analytics vendors fairly?
Apply gates first, score the survivors from 1 to 5 against weights you set before demos, and test how sensitive the result is to the weights. If the top two are within a few points, run a four-week proof of concept.
What privacy terms should an analytics vendor sign?
A processor contract under GDPR Article 28: documented instructions, confidentiality, Article 32 security measures, sub-processor authorisation, help with data subject requests, deletion or return at the end and audit rights.
How do I estimate how much data I will send?
Multiply monthly sessions by events per session, divide by 30 for a daily figure and by 86,400 for events per second, then plan for five times the average at peak. In the sample, 20 million sessions and 12 events give about 93 events per second on average and 463 at peak.
Sources
- GDPR-Info.eu, Article 28: Processor (written processor contract terms). Checked 2026-11-21.
- GDPR-Info.eu, Article 32: Security of processing (pseudonymisation and encryption, restoring availability, regular testing). Checked 2026-11-21.
- GDPR-Info.eu, Article 83: Administrative fines (10 million euros or 2%; 20 million euros or 4%). Checked 2026-11-21.
- AICPA, SOC 2 audit and assurance (trust services categories). Checked 2026-11-21.
Was this article helpful?
We use your answers to fix and expand this page.
Couldn’t send. Please try again in a minute.
Thanks for the feedback. We’ll use it to improve this page.You’ve already sent feedback on this page. Thanks.

Customer Experience Consultant
Writes about live chat, visitor conversations, and self-service, sharing practical ways to make customer communication clearer and more effective.