Try it on your own data
Every report in this article is in the free plan. One snippet for web and apps, up to 10 sites.
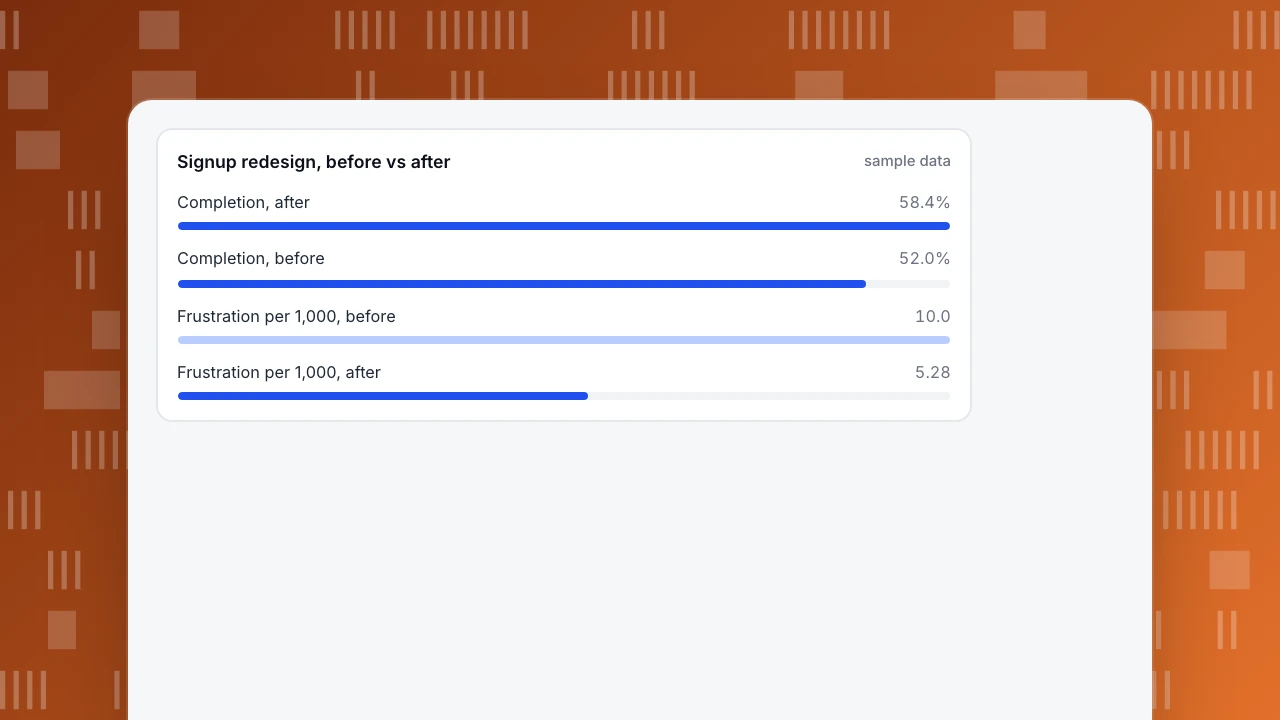
Start freeEmotional design shapes how a product looks, behaves and feels at three levels, visceral, behavioral and reflective, and each leaves traces you can measure. Emotion itself is not visible in analytics, but rage clicks, form completion and return visits are. In the sample below, completion rose 6.4 points (p < 0.001) while the 2.5-point retention gain was not yet established (p ≈ 0.09).
What you will learn
- Tie each level to a trace: first-look exits, rage clicks and completion, return visits and retention
- Attractive design buys the benefit of the doubt for small problems only; behavior still decides
- Report sample sizes and test noise; in the sample, completion is significant and retention is not yet
What is emotional design?
Emotional design is the practice of shaping a product so that the way it looks, behaves and feels produces the emotional response you want: confidence, delight, calm, trust. The term is most associated with Don Norman, who describes three levels at which people react to a product: visceral (the immediate response to how it looks and feels), behavioral (the response to how well it works in use) and reflective (the conscious judgement about what it means and what owning or using it says about you) (Nielsen Norman Group, "The 3 Levels of Emotional Processing", checked 2026-11-21).
The usual guidance stops there, with principles and pretty examples. This article adds the missing half: how to tie each level to behaviour you can measure, so that "we made it feel friendlier" becomes a claim you can check. The honest position is that emotion itself is not directly visible in analytics. What you can see are its traces: whether people hesitate, hit things repeatedly, finish, come back. For the measurement vocabulary around this, see UX metrics, and for the small moments that carry much of the feeling, microinteractions.
How do the three levels turn into design decisions and measurable signals?
Each level has typical design moves and typical traces in the data.
| Level | What people react to | Typical design moves | Behaviour you can measure |
|---|---|---|---|
| Visceral | First look and feel | Clear visual hierarchy, consistent spacing and type, calm colour, no clutter | Bounce rate and early exits on a landing page; share of sessions that go past the first screen |
| Behavioral | Using it | Instant feedback on every tap, forgiving forms, sensible defaults, helpful empty states | Rage clicks, error clicks, form completion, time between steps |
| Reflective | What it says about me and the brand | Honest wording, a sense of progress, small rewards at real milestones, quality in details | Return visits, repeat use, retention, referrals |
Read the middle row carefully, because it is where measurement is strongest. A product that gives no feedback when someone taps a button invites a second and third tap. A form that wipes input after an error invites abandonment. Both produce events that tracking can count.
| Level | Typical design moves | Behavior you can measure |
|---|---|---|
| Visceral | Clear hierarchy, calm colour, no clutter | Early exits, share passing the first screen |
| Behavioral | Instant feedback, forgiving forms | Rage clicks, completion, time between steps |
| Reflective | Honest wording, progress, real milestones | Return visits, retention, referrals |
Measurement is strongest in the behavioral row.
Why does the feeling of a design change behaviour?
Two well-documented findings explain why emotional design is not decoration.
People rate attractive things as easier to use. In a study at Hitachi, Kurosu and Kashimura (1995) tested 26 variants of an ATM interface with 252 participants and found that ratings of how attractive a design looked correlated more strongly with how easy people thought it was to use than with how easy it actually was (Nielsen Norman Group, "Aesthetic-Usability Effect", checked 2026-11-21). The same source adds the limit: an attractive design can forgive minor usability problems, not major ones, and it can mask problems in usability testing, because people comment on the colours rather than the trouble they had.
People judge credibility partly on looks. In Stanford's 2002 study, 2,684 participants evaluated live websites, and the look of the site was the most frequently mentioned factor, appearing in 46.1% of comments about credibility (Fogg et al., "How Do People Evaluate a Web Site's Credibility?", October 2002, checked 2026-11-21). The study counted comments, not purchases, so it shows what people say they notice, not what drives conversion directly.
Together these mean that good visual and interaction design buys you the benefit of the doubt, and that you cannot assume the benefit will last if the behavioral layer fails. A beautiful screen that loses people's input will still be abandoned.
What does a before-and-after measurement look like?
Sample data: a signup screen was redesigned with three changes aimed at the behavioral and reflective levels: instant feedback on every field (inline checks instead of an error page), a progress indicator and a friendlier empty state in the first project. We compare two periods of similar length.
| Metric | Before | After | Change |
|---|---|---|---|
| Page views of the signup flow | 12,000 | 12,500 | +4.2% |
| Rage clicks | 96 | 45 | — |
| Error clicks | 24 | 21 | — |
| Frustration per 1,000 page views | 10.0 | 5.28 | −47.2% |
| People who started signup | 3,000 | 3,100 | — |
| Completed signup | 1,560 (52.0%) | 1,810 (58.4%) | +6.4 points |
| Still active on day 7 | 328 (21.0% of completers) | 425 (23.5% of completers) | +2.5 points |
How to recompute: frustration per 1,000 page views is (rage clicks + error clicks) ÷ page views × 1,000, so (96 + 24) ÷ 12,000 × 1,000 = 10.0 and (45 + 21) ÷ 12,500 × 1,000 = 5.28; the change is (5.28 − 10.0) ÷ 10.0 = −47.2%. Completion is 1,560 ÷ 3,000 = 52.0% and 1,810 ÷ 3,100 = 58.4%. Day-7 activity is 328 ÷ 1,560 = 21.0% and 425 ÷ 1,810 = 23.5%.
Now check which changes are more than noise. A two-proportion test on completion gives z ≈ 5.0 (p < 0.001): the +6.4 points is very unlikely to be chance. The same test on day-7 activity gives z ≈ 1.7 (p ≈ 0.09): the +2.5 points is suggestive but not established. The frustration rate fell by almost half, but it is based on 120 and 66 events, so treat the exact percentage loosely and the direction as the useful part.
The honest summary for this sample: completion and frustration improved clearly, retention moved in the right direction but needs another period, and none of it proves the redesign was the cause, because other changes may have happened at the same time. Annotate the launch date and keep watching.
Signup redesign, before vs after
sample dataHow do you measure emotional design in practice?
A workable routine:
- Pick one screen or flow, not the whole product. Emotional changes are easiest to read where there is a clear task, such as signup, checkout or first project.
- Choose one frustration signal, one completion signal and one return signal. For example rage clicks per 1,000 page views, form completion and next-week return.
- Take a baseline of at least two full weeks, so weekday patterns average out.
- Change a small number of things and note the launch date.
- Compare equal-length periods and report the sample size with each rate, so readers can judge noise, as in the example.
- Add qualitative evidence. Analytics shows that people struggled, not why they felt something. Short interviews, open comments and watching a few recorded sessions supply the why.
Be wary of one trap in particular. Because the aesthetic-usability effect makes attractive designs seem easier to use, a stakeholder test of "does it feel better" can say yes while behaviour says no. Let the behaviour have the last word.
How do you do this in TapCub?
Take the signup redesign above and run its measurement in TapCub.
- Find the frustration. Open Monitoring › Errors, where the frustration table lists pages with rage clicks (at least 3 clicks on the same element within 500 milliseconds) and error clicks (a script error within 1 second after a click). A page is listed only if it has at least 20 page views and a rage or error click above zero, and the rate per 1,000 page views is exactly the figure used in the example.
- See where people click. All-platform analytics › Behavior › Heatmaps shows clicks on the page, including rage clicks, so you can see which element invited the repeat taps. Open Session replay (off by default and enabled per project) to watch a few of the sessions.
- Measure completion. In All-platform analytics › Behavior › Behavior analysis build the signup funnel and read the rate against the previous step, the largest drop and the median time between steps.
- Measure return. Use retention in the same area to see whether people who completed signup come back on day 7.
- Watch a stage over time. In All-platform analytics › Business › Journey maps each stage shows a sentiment score from 0 to 100 that takes error, frustration and exit shares into account (100 minus 1.5 times the error rate, 1.5 times the frustration rate and 0.5 times the exit rate). An event-only stage scores those shares as zero, so its score sits high and says nothing.
- Mark the launch. Add a date annotation (Configuration › Annotations) so the before-and-after comparison has a visible line.
TapCub does not run surveys or A/B tests. It will show that frustration fell and completion rose; it will not tell you how people felt, so pair it with interviews or your own survey tool.
What mistakes undermine emotional design work?
- Treating it as decoration. If the behavioral layer fails, no visual polish rescues it.
- Claiming a feeling you did not measure. "Users love it" needs a source other than the team's opinion.
- Using one metric. Completion up with frustration up means people got through despite the design.
- Comparing unequal periods. A launch week against a quiet month proves nothing.
- Ignoring sample size. A change in 120 events is a direction, not a precise number.
- Forgetting accessibility. Delight that excludes people with low vision or motor limits is a regression.
FAQ
What is emotional design?
Emotional design shapes how a product looks, behaves and feels so that it produces a desired response such as confidence or trust. Don Norman describes three levels: visceral, the immediate reaction to appearance; behavioral, how well it works in use; and reflective, the conscious judgement about meaning.
What are the three levels of emotional design?
Visceral is the first reaction to how something looks and feels. Behavioral is the experience of using it, including how well it works and how much feedback it gives. Reflective is the longer-term judgement about what it means and says about the user.
Can you measure emotional design?
Not emotion directly, but its traces. Rage clicks, error clicks, form completion, time between steps and return visits are measurable, and interviews or surveys supply the feeling itself. Compare equal-length periods and report sample sizes so you can tell a real change from noise.
What is the aesthetic-usability effect?
It is the tendency to see attractive products as more usable. In a 1995 study of 26 ATM interface variants with 252 participants, looks correlated more strongly with perceived ease of use than with actual ease. It forgives small problems, not large ones.
What is an example of emotional design in a product?
Inline checks that tell people a field is fine as they type, a progress indicator during setup, or a friendly example project in an empty state. Each reduces uncertainty and effort, and each has measurable effects such as lower rage clicks and higher form completion.
Sources
- Nielsen Norman Group: The 3 Levels of Emotional Processing, checked 2026-11-21
- Nielsen Norman Group: Aesthetic-Usability Effect, checked 2026-11-21
- Fogg et al.: How Do People Evaluate a Web Site's Credibility? (Stanford Persuasive Technology Lab, 2002), checked 2026-11-21
Was this article helpful?
We use your answers to fix and expand this page.
Couldn’t send. Please try again in a minute.
Thanks for the feedback. We’ll use it to improve this page.You’ve already sent feedback on this page. Thanks.

Technical Engineer
Focuses on tracking code, SDKs, and API integrations, with practical guidance on implementation checks and troubleshooting.