Try it on your own data
Every report in this article is in the free plan. One snippet for web and apps, up to 10 sites.
Start freeEcommerce strategies work when each is tied to a funnel stage and the one metric it moves: traffic mix for acquisition, product view rate for browsing, add-to-cart rate for product pages, checkout rate for the cart and completion for payment. Fix the stage where a small gain in points buys the most orders.
What you will learn
- Five funnel stages, each with one strategy family and one metric to watch
- In the sample, a 10% relative lift at any stage adds the same 186 orders; one point is worth 186 orders at add to cart and 30 at product view
- Compare your funnel with your own past, not a blog's average: the sample's 70.0% cart abandonment sits next to a 70.22% mean that spans 55% to 84%
Strategies belong to a funnel stage
A list of ecommerce tips (email, SEO, reviews, free shipping, loyalty) tells you what to do, not where it will show up. A strategy only matters if you know which number it moves. The simplest map is the shopper's path:
- Acquire: people arrive. Metric: sessions and orders per 100 sessions, by channel.
- Browse: they look at products. Metric: product view rate (sessions with a product view ÷ sessions).
- Consider: they decide on one. Metric: add-to-cart rate (adds ÷ product views).
- Cart: they consider paying. Metric: checkout start rate (checkouts ÷ carts).
- Pay: they complete. Metric: completion rate (orders ÷ checkouts).
- Retain: they return. Metric: repeat purchase rate.
Each strategy below attaches to one of these. If you cannot say which metric a strategy is meant to change, do not start it.
One sample funnel
Sample data for one month of one store:
| Stage | Count | Rate |
|---|---|---|
| Sessions | 100,000 | |
| Product views | 62,000 | 62.0% of sessions |
| Add to cart | 6,200 | 10.0% of product views |
| Checkouts started | 3,100 | 50.0% of carts |
| Orders | 1,860 | 60.0% of checkouts |
Orders per 100 sessions: 1.86. Revenue at a $70 average order value: 1,860 × $70 = $130,200, or $1.30 per session. Cart abandonment: 1 − 1,860 ÷ 6,200 = 70.0%.
Baymard Institute's average of 50 cart abandonment studies is 70.22%, with documented rates ranging from 55% to 84%. The sample sits on the average, which tells you nothing about whether it is good: the range is wide because stores, products and definitions differ. Your reference is your own last quarter.
Same relative lift, same orders: choose by points and effort
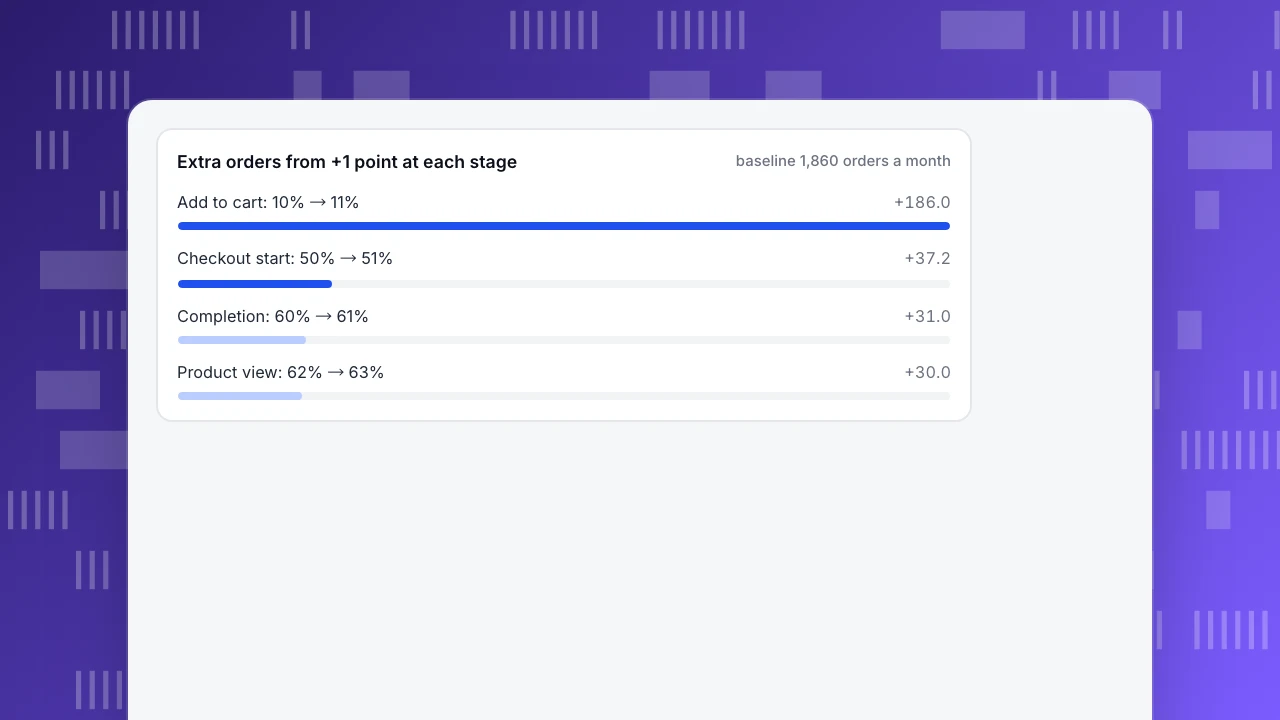
Orders are the product of the stage rates, so a 10% relative lift at any stage raises orders by 10%, which is +186 orders and +$13,020 a month here. The stage does not matter for the size of the prize. It matters for how hard the lift is. Convert to percentage points:
| Stage | Baseline | Points for +10% | Extra orders from +1 point |
|---|---|---|---|
| Product view | 62% | +6.2 | +30.0 |
| Add to cart | 10% | +1.0 | +186.0 |
| Checkout start | 50% | +5.0 | +37.2 |
| Completion | 60% | +6.0 | +31.0 |
Add-to-cart needs one point to give the same prize as six points at product view. That is the stage with the least slack in absolute terms, so a one-point gain is more plausible there. It does not mean it is easier: it means you should compare how many points a strategy can credibly add with its effort. A strategy that credibly adds one point at add to cart beats one that needs six at product view.
Extra orders from +1 point at each stage
baseline 1,860 orders a monthStrategy-to-metric table
| Funnel stage | Strategy family | Metric it moves | Sample value |
|---|---|---|---|
| Acquire | Channel mix, search, partnerships | Orders per 100 sessions by channel | 1.86 overall |
| Browse | Navigation, on-site search, merchandising | Product view rate | 62.0% |
| Consider | Product pages, reviews, delivery information | Add-to-cart rate (of product views) | 10.0% |
| Cart | Total cost up front, saved carts, chat for questions | Checkout start rate (of carts) | 50.0% |
| Pay | Guest checkout, payment methods, fewer fields | Completion rate (of checkouts) | 60.0% |
| Retain | Post-purchase messages, replenishment, service | Repeat purchase rate | measure it |
Two points about acquisition. Measure it by orders per 100 sessions per channel or cost per order, not sessions: a channel with half the visitors and double the conversion rate is the better channel. And keep bots out of the denominator, or every rate in the table is understated.
| Funnel stage | Strategy family | Metric it moves | Sample value |
|---|---|---|---|
| Acquire | Channel mix, search, partnerships | Orders per 100 sessions by channel | 1.86 overall |
| Browse | Navigation, on-site search, merchandising | Product view rate | 62.0% |
| Consider | Product pages, reviews, delivery information | Add-to-cart rate (of product views) | 10.0% |
| Cart | Total cost up front, saved carts, chat for questions | Checkout start rate (of carts) | 50.0% |
| Pay | Guest checkout, payment methods, fewer fields | Completion rate (of checkouts) | 60.0% |
| Retain | Post-purchase messages, replenishment, service | Repeat purchase rate | measure it |
Sample data: 100,000 sessions, 62,000 product views, 6,200 add to cart, 3,100 checkouts, 1,860 orders at $70 average order value.
Context from outside your store
Three public figures give you a sense of scale; none replaces your own baseline.
- Market: the U.S. Census Bureau estimates Q3 2026 retail e-commerce sales at $347.3 billion seasonally adjusted, 17.9% of total retail sales (released 19 November 2026). Online is a large and still growing part of retail, so comparisons with last year need to account for season (see below).
- Abandonment: Baymard's 70.22% mean over 50 studies, with a 55% to 84% range, is a reason not to over-read a single number.
- Speed: a Google and Deloitte study on web.dev, with 37 sites and more than 30 million sessions at the end of 2019, linked a 0.1 second faster mobile load to an 8.4% higher retail conversion rate. Use it as a reason to measure your own Core Web Vitals, not as a promise.
A 90-day order of work
- Days 1-14: measure. Build the funnel above for the last 90 days, by device and by channel. Exclude bots. Write the baseline rates down.
- Days 15-45: fix the cheapest big gap. Typically a one-line change near the add-to-cart button (delivery date, returns, total cost) or a broken step in checkout found in the funnel.
- Days 46-75: fix the biggest stage gap by device. If mobile completion is 10 points below desktop, that is the next change.
- Days 76-90: retention. Look at who bought twice and what the second purchase had in common; then decide whether a post-purchase message or a replenishment reminder is worth the effort.
- Throughout: one change per release, an annotation on the date, and a comparison of the same weeks.
Decision rules
- No strategy without a metric and a baseline.
- Rank by points you can credibly add, divided by effort, not by the biggest percentage.
- Measure acquisition in orders per 100 sessions, not visits.
- Check device and channel splits before deciding: a blended rate hides the stage that is actually leaking.
- Ask a pre-sale question channel (chat or help pages) where shoppers hesitate, and see whether chatters convert differently from non-chatters.
- Stop a strategy that cannot show movement in its own metric after two clear windows.
Split the funnel by device before you decide
A blended funnel can point at the wrong stage. Take the same month and split it. Sample data:
| Device | Sessions | Checkouts started | Orders | Conversion | Completion |
|---|---|---|---|---|---|
| Desktop | 40,000 | 1,400 | 1,000 | 2.50% | 71.4% |
| Mobile | 60,000 | 1,700 | 860 | 1.43% | 50.6% |
| Total | 100,000 | 3,100 | 1,860 | 1.86% | 60.0% |
The blended 60.0% completion rate looks middling. The split shows desktop completing 71.4% of checkouts and mobile 50.6%, a 20.8-point gap. If mobile reached desktop's rate, 1,700 checkouts would produce 1,700 × 71.4% = 1,214 orders, which is 354 more than today (+19.0% on 1,860). That is nearly twice the +186 orders from a 10% lift on any single blended stage, and it comes from fixing one problem.
Before you act, ask why mobile completes less. Check the checkout step funnel by device, payment methods offered on mobile, form fields, errors on the payment page and load speed. The point is that the segment that leaks most is often invisible in the blend. Do the same split by channel and by new versus returning visitors.
Do not skip retention
Acquisition and conversion get the attention because their numbers move quickly. Repeat purchases are slower and often cheaper. Measure them in three steps:
- Repeat purchase rate: customers with two or more orders ÷ customers, over a fixed window such as 90 days.
- Gap to second order: the median days between a first and a second order. This tells you when a reminder or follow-up would arrive on time.
- What repeat buyers have in common: the first product, the channel and the delivery experience.
Sample data: 1,500 customers made their first order in a quarter; 330 ordered again within 90 days, so the repeat rate is 330 ÷ 1,500 = 22.0%. If a post-purchase message could lift that to 24.0% (360 customers), that is 30 more repeat customers a quarter. Compare 30 customers with the effort of the change before committing, the same way as for any other stage.
Mistakes that make strategies look better or worse than they are
- Judging on sessions. More sessions from a low-converting channel can lower your conversion rate and raise your revenue; look at orders and cost per order.
- Comparing partial periods. A funnel for the last four days of a month against a full previous month overstates every drop.
- Counting bots. Automated visits sit in the denominator of every stage rate and make all of them look worse.
- Changing two things at once. If you add a delivery date and cut shipping cost in the same release, you cannot say which did the work.
- Reading a benchmark as a target. Baymard's 70.22% mean spans 55% to 84%; being near it says nothing about whether your checkout is good.
The fix is routine rather than clever: one change per release, complete periods, human traffic only, and a comparison with your own previous quarter.
How to track these stages in TapCub
Use the sample funnel above.
- In All-platform analytics › Behavior › Behavior analysis, build a funnel from product view to add to cart, checkout and order, and split it by device. This gives you the rates in the table.
- Open Web analytics › Sources for conversions by channel and UTM, and All-platform analytics › Business › Channel ROI to import spend by day, channel, source or campaign; it shows cost per click and cost per acquisition. TapCub does not buy or optimise ads; it measures what they return.
- If you use several attribution models, All-platform analytics › Behavior › Behavior analysis lets you select first, last, linear, position and time decay side by side, so a channel that mostly assists is easy to see.
- Offer chat on the product and cart pages: Live chat › Chat settings › Appearance switches it on without changing site code. In Live chat › Reports › Conversion attribution, compare goal conversion for visitors who chatted with those who did not, and see which pages conversations start on.
- Save groups of buyers in All-platform analytics › Users › Segments & tags (RFM groups are built in) to study repeat purchasers, and annotate releases in Configuration › Annotations.
TapCub does not run A/B tests, send email campaigns or take payments. It measures the stages and shows which one deserves the next change.
FAQ
What are the best ecommerce strategies?
The ones that move the metric of your weakest funnel stage at reasonable effort. For one store that is a delivery date beside the add-to-cart button; for another it is guest checkout. Measure the funnel before choosing.
How do I know which stage to fix first?
Build the funnel by device and channel, then estimate extra orders for one credible point of gain at each stage and divide by effort. Highest orders per effort goes first.
What is a good ecommerce conversion rate?
It varies by product, price and traffic. Compare with your own past quarters and by channel. The sample's 1.86% means little outside its context; a rate that is falling or a channel that is far below the others matters more.
Should I focus on acquisition or conversion?
Check conversion first. Buying more traffic into a leaky funnel multiplies the leak. Once the funnel is stable, add traffic and measure orders per 100 sessions by channel.
How do I measure retention in ecommerce?
Use repeat purchase rate (customers with two or more orders ÷ customers) over a fixed window, and look at the time between first and second orders. Segment buyers so you can compare the groups.
Sources
Was this article helpful?
We use your answers to fix and expand this page.
Couldn’t send. Please try again in a minute.
Thanks for the feedback. We’ll use it to improve this page.You’ve already sent feedback on this page. Thanks.

Product Adoption Consultant
Explores customer onboarding, live conversations, and self-service, turning common usage questions into practical guidance and improvements.