Try it on your own data
Every report in this article is in the free plan. One snippet for web and apps, up to 10 sites.
Start freeThe best UX tools are the ones that answer a question you are actually asking, so choose by job, not by product list. Analytics shows where people drop; heatmaps and session replay show what they did; surveys, interviews and usability tests explain why; prototyping proposes a fix; performance and error monitoring rule out technical causes. Five test users find about 84% of the problems in a round. Start with the question, then pick one tool per job.
What you will learn
- Write the question first, then pick the kind of evidence (counts, traces, reasons, timings) and only then a tool
- Five test users find about 84% of the problems in one round; three rounds of five beat one round of fifteen
- Own one tool per job; small teams start with analytics, a few real conversations and performance monitoring
How do you choose the best UX tools? Start from the question, not the category
A UX tool is worth owning only if it answers a question you are actually asking. "Where do visitors leave?" is answered by analytics. "What did they try to click?" is answered by heatmaps and session replay. "Why did they leave?" needs people: interviews, a survey or a moderated test. "Is the page slow or broken for some of them?" is answered by performance and error monitoring. And "what should we build next?" is a design and prototyping question.
Most roundups list 15 to 20 products and leave you to work out which one fits. That order is backwards. The reliable sequence is:
- Write the question as a sentence ("Why do 38% of mobile shoppers stop at the address step?").
- Decide which kind of evidence answers it: counts, behavior traces, spoken reasons or timings.
- Only then pick a tool of that kind.
This guide is organised by that sequence. It covers the six jobs a UX toolkit has to do, what each answers, how many test users you need for the people-based jobs, which jobs a team of one, ten or fifty should cover first, and a pre-purchase checklist. Product names are left out on purpose; the categories change much more slowly than the vendors. If you only need the analytics half, UX analytics goes deeper, and heatmap tools compares that one category.
| If your question is… | Start with |
|---|---|
| How many people drop at this step? | Analytics and funnels |
| What did they try to click? | Heatmaps and session replay |
| Why did they leave? | Interviews, a one-question survey or a moderated test |
| Is the page slow or erroring? | Performance and error monitoring |
| What should we build instead? | Prototyping and design tools |
One tool per job; each job leaves a gap that the next one fills.
The six jobs a UX toolkit does
| Job | Question it answers | Evidence type | Typical output | Gap it leaves |
|---|---|---|---|---|
| Product and web analytics | How many people do this, and where do they drop? | Counts and rates | Funnels, retention, sources | Cannot say why |
| Heatmaps and session replay | What did they do on this page? | Behavior traces | Click and scroll maps, recordings | Small samples, privacy care needed |
| Surveys and feedback | Why did they do it? | Stated reasons | Short answers, ratings | People report what they remember, not always what they did |
| Usability testing and interviews | Can someone complete this task? | Observed tasks | Task success, problem list | Few participants, lab conditions |
| Prototyping and design | What could we build instead? | Mock-ups | Clickable prototypes, specs | Says nothing about real usage |
| Performance and error monitoring | Is it fast and does it work for everyone? | Timings and exceptions | Load times, error groups | Does not judge whether the design makes sense |
Two rules follow from the table.
- No job replaces another. Analytics tells you a step loses 38% of people; only a person in front of the screen, or a recording of one, tells you the button looked disabled.
- Every job has a gap, and the gap is the next job. Counts raise the question, traces localise it, people explain it, prototypes propose a fix, counts then check whether the fix worked.
A team that owns only analytics has a dashboard full of questions. A team that owns only prototyping and interviews has strong opinions and no measure of whether they were right.
How many test users do the people-based tools need?
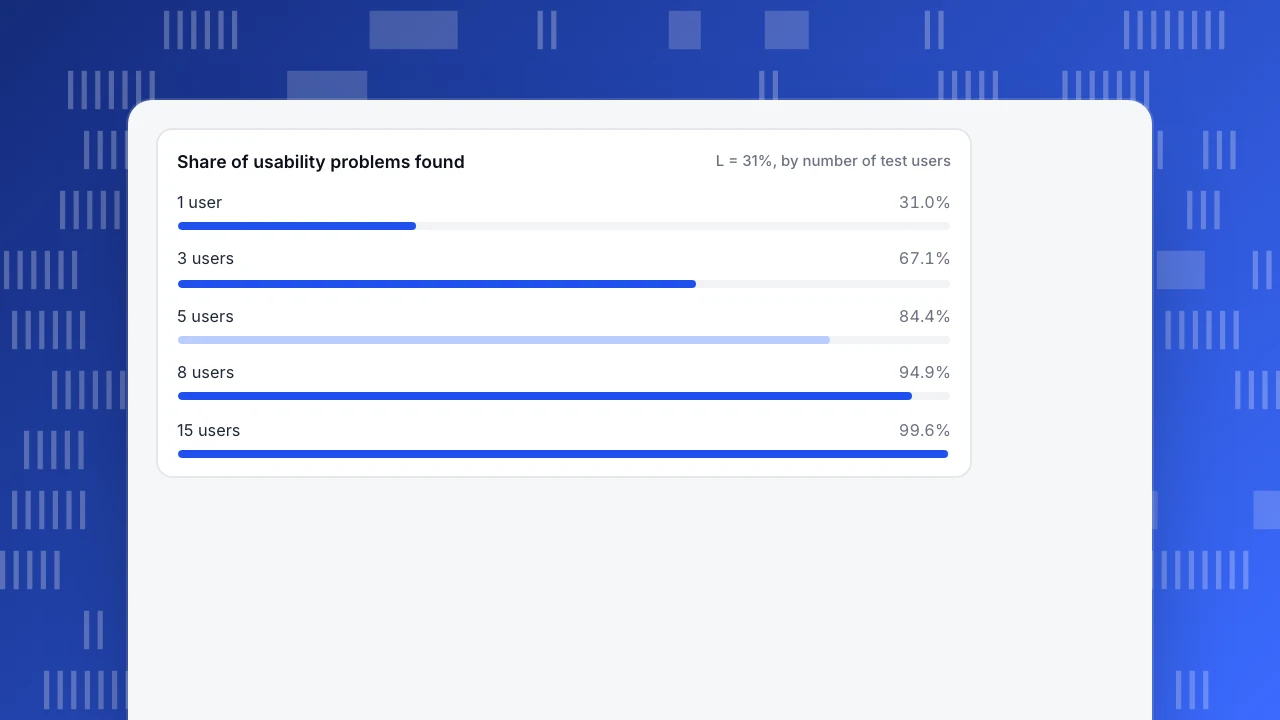
Usability testing and interviews are the jobs where tool buying matters least and method matters most, so it helps to know how little you need. Jakob Nielsen, building on a 1993 model with Thomas Landauer, estimated the share of usability problems found by n test users as:
share found = 1 − (1 − L)^n, where L is the share a single user finds. Nielsen used L = 31%.
Recomputed for L = 0.31:
| Test users (n) | Share of problems found |
|---|---|
| 1 | 31.0% |
| 3 | 67.1% |
| 5 | 84.4% |
| 8 | 94.9% |
| 15 | 99.6% |
Five users find about 84% of the problems a single round can find, which matches Nielsen's own statement that a first study with five participants has found about 85%. The practical reading is not "test five people once". It is "three rounds of five users with a fix in between beat one round of fifteen", because the second round finds problems the first round's problems were hiding.
Two caveats keep this honest. L = 31% is an average from the studies Nielsen drew on; a complicated product with several distinct user groups has a lower L for each group, so test five per group. And the model applies to finding problems, not to measuring how common one is. For "how many people hit this problem", go back to analytics, where the denominator is your whole traffic.
Share of usability problems found
L = 31%, by number of test usersOne problem, four tools: how behavior tools work together
Here is how the first four jobs combine on a single question. Sample data: a store's mobile checkout loses 38% of visitors at the address step.
- Analytics (what and how many). A funnel shows 5,000 mobile sessions reaching the address step and 3,100 going on to shipping: 1,900 lost, which is 38.0%. On desktop the same step loses 14%. So the problem is specific to mobile.
- Heatmap (where). A click map of the address page for mobile shows a cluster of repeated taps on the "Continue" button and a second cluster on the country dropdown.
- Session replay (how). Watching six recordings from the lost group shows the keyboard covering the "Continue" button after the postal code field, and the button staying grey until a field far above the fold is filled.
- Survey or interview (why). A one-question exit prompt, or five mobile test users asked to "buy this item", confirms they thought the form had frozen.
No single tool in that chain was enough. The funnel found the problem but could not see the grey button; the recordings saw the grey button but could not say how many people it affects. The fix (show the required field in red, keep the button active) then goes back to step 1: did the 38% drop?
The rule for the stack: pick one tool per job before adding a second tool for the same job. Two heatmap products give you two sets of numbers that disagree for reasons nobody has time to investigate.
What do performance and error tools add that analytics does not?
A design problem and a technical problem look the same in a funnel: people leave. Performance and error monitoring separates them. The reference points that matter are Google's Core Web Vitals thresholds, measured at the 75th percentile of page loads and segmented by mobile and desktop:
| Metric | Measures | "Good" threshold |
|---|---|---|
| Largest Contentful Paint (LCP) | When the main content is visible | 2.5 seconds or less |
| Interaction to Next Paint (INP) | How fast the page responds to taps and clicks | 200 milliseconds or less |
| Cumulative Layout Shift (CLS) | How much the layout jumps while loading | 0.1 or less |
Why the 75th percentile matters: an average hides the slow quarter of your visitors, and those are often the mobile visitors on weaker connections who also drop out of funnels. A page with a good median LCP and a poor 75th-percentile LCP is slow for a quarter of your traffic.
A useful decision rule: if a funnel step drops sharply for one device class and that class's LCP or INP is outside the good range, fix performance before redesigning. If the timings are good and errors are flat, the problem is the design, and you are back to heatmaps, replay and people.
Which jobs should a team of 1, 10 or 50 cover first?
You do not need all six jobs on day one. Cover them in the order of the question you will be asked first.
| Team | Cover first | Add next | Leave for later | Why |
|---|---|---|---|---|
| Solo or 2-3 people | Analytics, plus five users per quarter in a call | Performance monitoring | Replay at scale, prototyping tools beyond what the designer already uses | Counts and a handful of real conversations catch most obvious problems |
| 5-15 people with a product or growth owner | Analytics and heatmaps | Replay, errors, a short feedback prompt | A dedicated research repository | You now have enough traffic to sample behavior, and someone owns follow-up |
| 30-50 people, several squads | All six, one tool per job | Governance: who may view recordings, retention periods | Duplicate tools per squad | Shared definitions matter more than extra features |
Two practical limits on small teams. First, heatmaps and replay need traffic: a page with 200 visits a month produces a click map that moves every time one person clicks. Treat any map under a few hundred sessions per device type as anecdote. Second, attention is the real budget. A tool nobody opens in the last month is not a UX tool, it is a subscription.
What do UX tool prices actually depend on?
Rather than quoting prices that change quarterly, look at what each category's bill grows with, because that decides which tool stays affordable as you grow.
| Category | Bill usually grows with | Watch for |
|---|---|---|
| Analytics | Tracked events or sessions | Overage when a campaign spikes traffic |
| Heatmaps and replay | Recorded sessions, retention days | Sampling rate, and how long recordings are kept |
| Surveys | Responses collected, seats | Limits on questions or branching |
| Usability testing | Per participant or per test | Cost of recruiting your own users versus a panel |
| Prototyping and design | Seats (editors vs viewers) | Paying for viewers who only need to comment |
| Performance and error monitoring | Page views or error events | A noisy script generating thousands of repeated errors |
When two tools in the same category look similar, choose the one whose cost driver you control. You can limit recording by sampling; you cannot limit how many people visit your site.
What should you check before you buy any UX tool?
Run each candidate through the same six checks and write down the answers:
- Which question does it answer? If you cannot write it as a sentence, stop.
- Where does the data live and for how long? Ask for the retention period and whether you can delete a visitor's data on request.
- What does it collect by default? Form fields, passwords and personal text should be excluded unless you opt in.
- Can it be segmented by device, source and a saved group? A recording or map with no filter is a story, not evidence.
- Who will open it every week? Name a person.
- What happens to the data if you leave? An export you can actually use is part of the price.
Run two tools for two weeks on the same page and compare what you decided because of each. Keep the one that changed a decision.
Where TapCub fits among these tools
Take the mobile checkout example from above and run it with one tool for the first four steps.
- In All-platform analytics › Behavior › Behavior analysis, build the funnel and split it by device. This is the "38% on mobile, 14% on desktop" step.
- Open All-platform analytics › Behavior › Heatmaps for the address page and pick the mobile device filter: click, rage-click and scroll maps and an element share view. Heatmaps need auto-capture to be switched on first, and elements such as password fields are never recorded.
- Open All-platform analytics › Behavior › Session replay (off by default; turn it on first) and watch the sessions from the drop-off group.
- Open Monitoring › Performance for the Core Web Vitals of the same page and Monitoring › Errors for script errors.
TapCub does not run surveys or interviews, A/B tests or prototypes, so jobs 3, 4 and 5 stay in your other tools; TapCub measures what happens after the redesign ships. In native apps there are no click heatmaps, so app teams use screen funnels and the stability report instead.
FAQ
What are the best UX tools for a small team?
Start with web analytics, five real user conversations per quarter, and performance monitoring. Add heatmaps and replay once a key page gets a few hundred sessions per device type, because maps built on fewer clicks are mostly noise.
What is the difference between a UX tool and an analytics tool?
Analytics tools count and compare what people do. UX tools are the wider set: analytics, heatmaps, replay, surveys, usability testing, prototyping and performance. Analytics finds where the problem is; the others explain it or test a fix.
Do I need a separate tool for each UX job?
Not always. Some products cover two or three adjacent jobs, such as analytics with heatmaps and replay. What matters is one tool per job. Keep surveys, interviews and prototyping separate unless a platform clearly does them well.
How many users do I need for a usability test?
Five users find about 84% of the problems a round can find, using Nielsen's L = 31%. Test five per distinct user group, fix what you find, then run another small round rather than one large one.
How do I know a UX tool is worth paying for?
Run it on one page for two weeks and write down each decision it changed. If it led to no decision, either you asked it the wrong question or it is the wrong kind of tool.
Sources
Was this article helpful?
We use your answers to fix and expand this page.
Couldn’t send. Please try again in a minute.
Thanks for the feedback. We’ll use it to improve this page.You’ve already sent feedback on this page. Thanks.

Data Analyst
Explores traffic sources, conversion funnels, and retention, using clear metric definitions and concrete examples to explain what the numbers mean.