Try it on your own data
Every report in this article is in the free plan. One snippet for web and apps, up to 10 sites.
Start freeA campaign tracker is a table with one row per campaign and source that joins the plan (tags, spend) to the results (sessions, conversions, cost per conversion). Build it from three parts: a UTM naming convention, a sheet with plan and result columns, and result numbers pulled from analytics. Because UTM values are case-sensitive, one inconsistent spelling splits a campaign into two rows and can understate it by more than a third.
What you will learn
- Use utm_source, utm_medium and utm_campaign on every tagged link, in lowercase, with medium chosen from a closed list
- Fill plan columns once and pull result columns from analytics weekly; include the final tagged URL and one named goal
- Check tags before reading rates: a Newsletter / newsletter split understated one campaign by 36.7%
What is a campaign tracker, and what does it have to do?
A campaign tracker is a table with one row per campaign and source that joins three things: what you planned to spend, how the visit was tagged, and what the visit did on your site. If it only lists dates and budgets it is a project plan. If it only shows visits it is a traffic report. A tracker earns its name when one row can answer "what did this campaign cost per sign-up?".
Three parts make that possible, and each one fails in a different way:
- A naming convention for the tags on every link (UTM parameters), so the same campaign is always spelled the same way.
- A sheet with a fixed set of columns: plan columns you fill in before launch and result columns you fill in from analytics.
- A join to outcomes: sessions and conversions per tag, taken from your analytics, not typed by hand.
This guide builds each part, shows a filled-in example with every rate recomputed, lists the mistakes that quietly split one campaign into several rows, and ends with a weekly routine. The tag format itself is defined in UTM; for the conventions our own project uses, see naming UTM parameters.
How should you name UTM parameters so rows stay together?
Google's documentation says to always use three parameters on a tagged link: utm_source, utm_medium and utm_campaign. utm_term (paid-search keyword) and utm_content (to tell two links in the same ad or email apart) are optional. The same page makes the point that matters most for trackers: values are case-sensitive, so utm_source=google and utm_source=Google are different values, and the case rule applies to every value you define.
That one sentence is why a convention is the first part of a tracker. Use this one:
| Parameter | What goes in it | Rule | Example |
|---|---|---|---|
utm_source | Who sent the visit | Lowercase, one spelling per sender, no spaces | newsletter, google, linkedin |
utm_medium | The channel type | Pick from a closed list of 5–8 values | email, cpc, paid-social, audio |
utm_campaign | The initiative | topic-period, lowercase, hyphens | spring-sale-2027q1 |
utm_content | Which link or creative | Short label, only when two links in one place differ | header-cta, video-a |
utm_term | Paid keyword | Only for manually tagged paid search | crm-software |
Three habits keep the convention alive:
- Closed list for medium. Analytics tools group traffic into channels by looking at source and medium. For example, Google's default channel group files traffic under Organic Social when the medium is one of
social,social-network,social-media,sm,social networkorsocial media; a link taggedfacebook-postwould not match. Choose a medium from the list you published and never improvise. - Never tag internal links. Putting UTMs on links between your own pages starts a new session and overwrites the real source. Tags belong only on links that sit outside your site.
- One builder, one owner. Keep a shared tag builder (a sheet with a formula that joins the parts and lowercases them) and name one person who approves new medium values.
Which columns does the tracker sheet need?
Split the columns into what you know before launch and what you read afterwards. Fill the first group once; refresh the second weekly.
| Group | Column | Source |
|---|---|---|
| Plan | Campaign name, owner, start and end dates | You |
| Plan | Source, medium, content label (the exact tag values) | Tag builder |
| Plan | Final URL with tags | Tag builder |
| Plan | Budget and actual spend | Invoice or ad account |
| Result | Sessions | Analytics, filtered by the tag |
| Result | Conversions | Analytics, one named goal |
| Result | Conversion rate = conversions ÷ sessions | Formula |
| Result | Cost per session = spend ÷ sessions | Formula |
| Result | Cost per conversion = spend ÷ conversions | Formula |
| Notes | What changed mid-flight (new creative, budget cut) | You |
Two columns are easy to skip and expensive to miss: the final tagged URL (so anyone can check the link that actually went out) and the named goal (so every row counts the same thing as a conversion). If one campaign counts newsletter sign-ups and another counts purchases, the cost-per-conversion column compares unlike things.
| Column group | Columns |
|---|---|
| Plan | Campaign, owner, dates, source, medium, content label, tagged URL, spend |
| Result | Sessions, conversions, conversion rate, cost per session, cost per conversion |
| Notes | What changed mid-flight and what was decided |
Plan columns are typed once; result columns come from analytics.
Worked example: a filled tracker and what it says
Sample data: one quarter, four campaign-source rows, one goal ("started free trial").
| Campaign | Source / medium | Spend | Sessions | Conversions | Conv. rate | Cost per session | Cost per conversion |
|---|---|---|---|---|---|---|---|
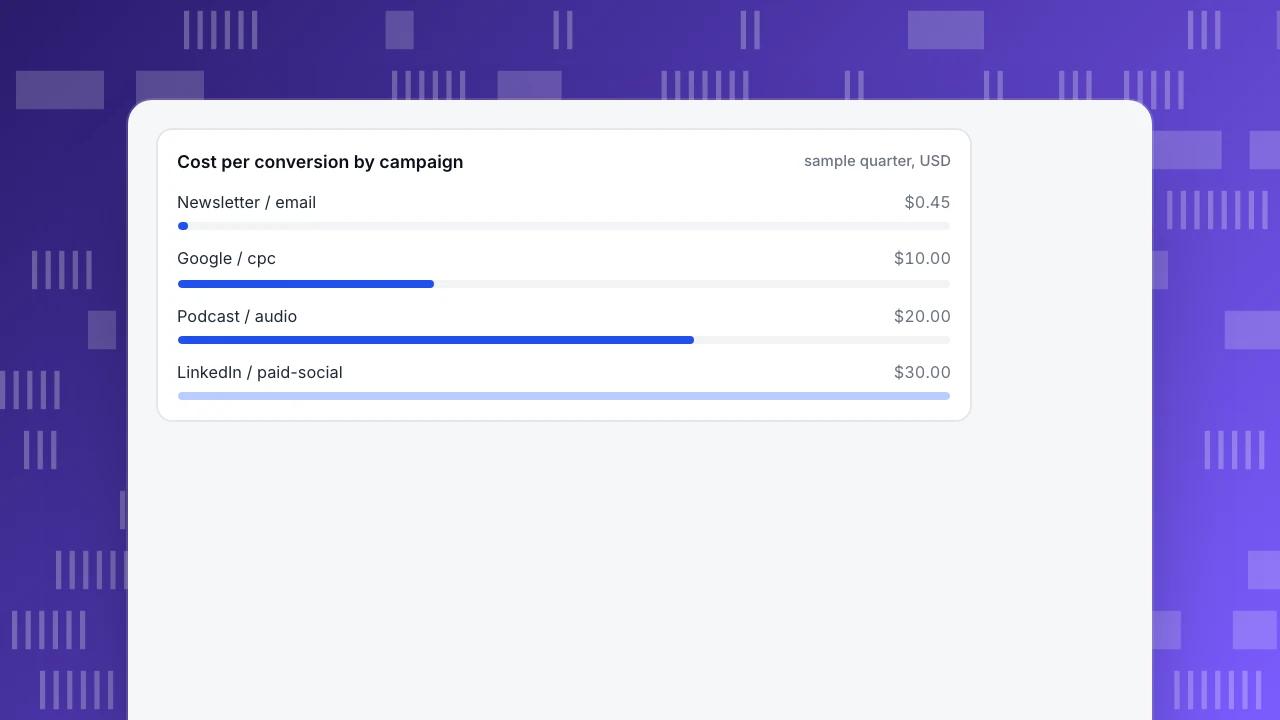
| spring-sale | newsletter / email | $150 | 4,200 | 336 | 8.00% | $0.04 | $0.45 |
| spring-sale | google / cpc | $2,400 | 6,000 | 240 | 4.00% | $0.40 | $10.00 |
| webinar-launch | linkedin / paid-social | $1,800 | 3,000 | 60 | 2.00% | $0.60 | $30.00 |
| podcast-ad | podcast / audio | $900 | 1,500 | 45 | 3.00% | $0.60 | $20.00 |
| Total | $5,250 | 14,700 | 681 | 4.63% | $0.36 | $7.71 |
How each number is computed, so you can check it: email conversion rate 336 ÷ 4,200 = 8.00%; cost per conversion $150 ÷ 336 = $0.45. Search: 240 ÷ 6,000 = 4.00%; $2,400 ÷ 240 = $10.00. LinkedIn: 60 ÷ 3,000 = 2.00%; $1,800 ÷ 60 = $30.00. Podcast: 45 ÷ 1,500 = 3.00%; $900 ÷ 45 = $20.00. Totals: spend 150 + 2,400 + 1,800 + 900 = $5,250; sessions 14,700; conversions 681; blended rate 681 ÷ 14,700 = 4.63%; blended cost $5,250 ÷ 681 = $7.71.
What the table supports, and what it does not:
- The blended $7.71 is a poor guide to any single decision. Search is above it, email far below, LinkedIn four times above.
- Email is cheapest per conversion but has only 4,200 sessions; its list is finite, so you cannot buy more of it. A tracker shows efficiency, not headroom.
- LinkedIn costs $30.00 per trial against $10.00 for search. That is a signal to look at the landing page and audience for that row, not a verdict on the channel, because 3,000 sessions and 60 conversions is a small sample (a swing of ten conversions moves the rate by 0.33 points).
- The tracker uses the tag on the session. A person who saw the podcast ad, searched your name later and converted through search is credited to search. For multi-touch credit use an attribution report, not this sheet.
Cost per conversion by campaign
sample quarter, USDWhat quietly splits one campaign into several rows?
Because values are case-sensitive, drift in spelling creates separate rows. Sample data: two people tag the same spring newsletter link.
| utm_source | Sessions |
|---|---|
| newsletter | 3,800 |
| Newsletter | 2,200 |
| One campaign, as it should read | 6,000 |
Anyone who reads only the first row concludes the newsletter sent 3,800 visits, a 37% undercount (2,200 ÷ 6,000 = 36.7%), and, if conversions split the same way, its cost per conversion looks 58% too high. Other common causes:
- Extra separators.
spring_sale,spring-saleandspringsalebecome three campaigns. - Medium synonyms.
email,e-mailandnewsletteras medium split one channel into three groups. - Retagged links. A link was edited after launch; old sessions carry the old tag and new sessions the new one.
- Missing tags. Untagged social posts and messaging-app links arrive as direct or referral traffic, and no row exists for them.
The fix is a ten-minute check before launch: paste the final URL into the tracker, click it from a clean browser, and confirm in the real-time report that the session shows the exact source, medium and campaign you typed.
How do you read the tracker each week?
Run the same four checks every week, in this order:
- Tags first. Sort the source column and look for near-duplicates. Merge or retag before looking at any rate.
- Compare within a medium. Compare two email campaigns, not email against paid search; audience size and intent differ.
- Check sample size. A row with fewer than about 100 conversions can swing widely week to week; wait before cutting it.
- Decide per row. Keep, fix the landing page, change the audience or stop. Write the decision and the date in the Notes column so next month's reader knows why.
A launch and weekly routine
| When | Task | Time |
|---|---|---|
| Before launch | Build tags with the shared builder and add them to the sheet | 10 min per campaign |
| Before launch | Click each link from a clean browser and check the real-time view | 5 min per link |
| Launch day | Confirm the first sessions appear under the right row | 5 min |
| Weekly | Refresh sessions, conversions and spend; scan for near-duplicate tags | 20 min |
| After the campaign | Freeze the row, write what you would repeat | 10 min |
Doing this in TapCub
Take the four-row example above and run it end to end.
- Tag the links with the convention in the sheet.
- In Web analytics › Sources, filter by UTM source, medium and campaign to read sessions per row. Channel rules can be adjusted, and a click on a row narrows other reports to that tag.
- In Web analytics › Goals, define one goal ("started free trial") and use the same goal in every row. The conversions you read there are the same data as under All-platform analytics › Business › Goals.
- In All-platform analytics › Business › Channel ROI, import spend by day, channel, source or campaign (CSV or row by row). The page shows cost per click (spend ÷ sessions), cost per acquisition (spend ÷ purchases in orders) and return on ad spend, grouped by channel, source or campaign. That replaces the two cost columns you would otherwise calculate by hand.
- For credit across several touches, use All-platform analytics › Behavior › Behavior analysis and select several attribution models side by side.
TapCub does not buy ads, send newsletters or manage campaign tasks; it measures what visitors do after the click, and bots are counted separately so they do not inflate sessions.
FAQ
What is a campaign tracker?
A table with one row per campaign and source that holds the plan (tags, budget), and the results pulled from analytics (sessions, conversions, cost per conversion). It differs from a project plan because every row can be tied to measured outcomes.
What UTM parameters are required?
Google recommends always using utm_source, utm_medium and utm_campaign. utm_term and utm_content are optional. Values are case-sensitive, so decide on lowercase and one spelling per value.
Can I track campaigns without UTM tags?
Partly. Visits from other sites still show up as referral traffic, but email, messaging apps, QR codes and most paid links carry no source unless you tag them. For anything you pay for or send yourself, tag it.
Should I use a spreadsheet or a tool for a campaign tracker?
A spreadsheet is enough for the plan columns and tag builder. Pull the result columns from analytics rather than typing them, or the tracker drifts from reality within weeks.
How many rows should a tracker have?
One per campaign and source combination. If you have more than about 40 live rows, group by campaign in the report view and keep the detail in the sheet.
Sources
Was this article helpful?
We use your answers to fix and expand this page.
Couldn’t send. Please try again in a minute.
Thanks for the feedback. We’ll use it to improve this page.You’ve already sent feedback on this page. Thanks.

Product Experience Specialist
Explores usability, user journeys, and feature adoption through practical examples of onboarding and everyday product use.