Try it on your own data
Every report in this article is in the free plan. One snippet for web and apps, up to 10 sites.
Start freeEcommerce fraud prevention techniques judge payments (card checks, risk scores, review), while web analytics shows the signals around them: attempt spikes, decline surges, small amounts, direct-traffic shifts and funnel breaks. In the sample attack hour, attempts were 13 times normal and 95% were declined. Combine signals, then match each countermeasure to the signal and count what it costs real shoppers.
What you will learn
- Analytics cannot block or approve payments but can warn early: alert when attempts reach 3× the same-hour median and declines reach 40%
- Combine signals rather than relying on one: single-feature blocks such as a country block cost real sales and are easy to dodge
- Count false positives for every rule and apply strict rules only to targeted endpoints during an attack
What analytics can and cannot do against fraud
Ecommerce fraud prevention techniques fall into two groups: tools that judge a payment (card checks, risk scores, manual review) and signals that show something is wrong around the payment (traffic, speed and checkout behaviour). Web analytics belongs to the second group. It does not see card data and it cannot approve or decline an order, but it often notices an attack before the payment dashboard does, because attackers leave a pattern in traffic and funnels.
The scale of the problem is large. The US Federal Trade Commission reported that consumers and companies reported more than $12.5 billion in fraud losses for 2024, up 25% on 2023, and that 38% of people who reported a fraud said they lost money, up from 27%. Online shopping was the second most commonly reported fraud category. Those are consumer-reported figures, not merchant losses, but they show the direction.
This article lists the signals you can read in analytics, a threshold for each, and the countermeasures to match. For the wider set of store reports, see ecommerce analytics; for the traffic side of the problem, see bot mitigation.
Signals worth watching
| Signal | What it looks like | Common cause |
|---|---|---|
| Attempt spike | Payment attempts several times the normal hour | Card testing script |
| Decline surge | Share of declined payments jumps | Stolen or guessed card numbers |
| Small amounts | Many attempts of a few dollars | Card validation |
| Repeated source | Same IP, device or email in many attempts | Automation |
| Channel shift | Checkout sessions arrive as "direct" or from one odd country | Scripts that do not browse |
| Funnel break | Payment submitted but orders confirmed drops | Fraud filters or failed attempts |
Stripe's guidance on card testing lists the same symptoms: a spike in failed or blocked payments, a spike in requests with 402 errors, and a spike in suspicious payments with low amounts, often with nonsensical customer names and emails. It also warns that simple filters on a single feature, such as an IP address, are usually not enough, so combine signals.
A card-testing hour, in numbers
Sample data: the usual 8 pm hour on a store compared with an attack hour.
| Measure | Normal hour | Attack hour |
|---|---|---|
| Payment attempts | 40 | 520 |
| Approved | 36 | 26 |
| Decline rate | 10.0% | 95.0% |
| Median attempted amount | $82 | $1.50 |
| Share of attempts from direct sessions | 12% | 61% |
| Submitted → order confirmed | 90.0% | 5.0% |
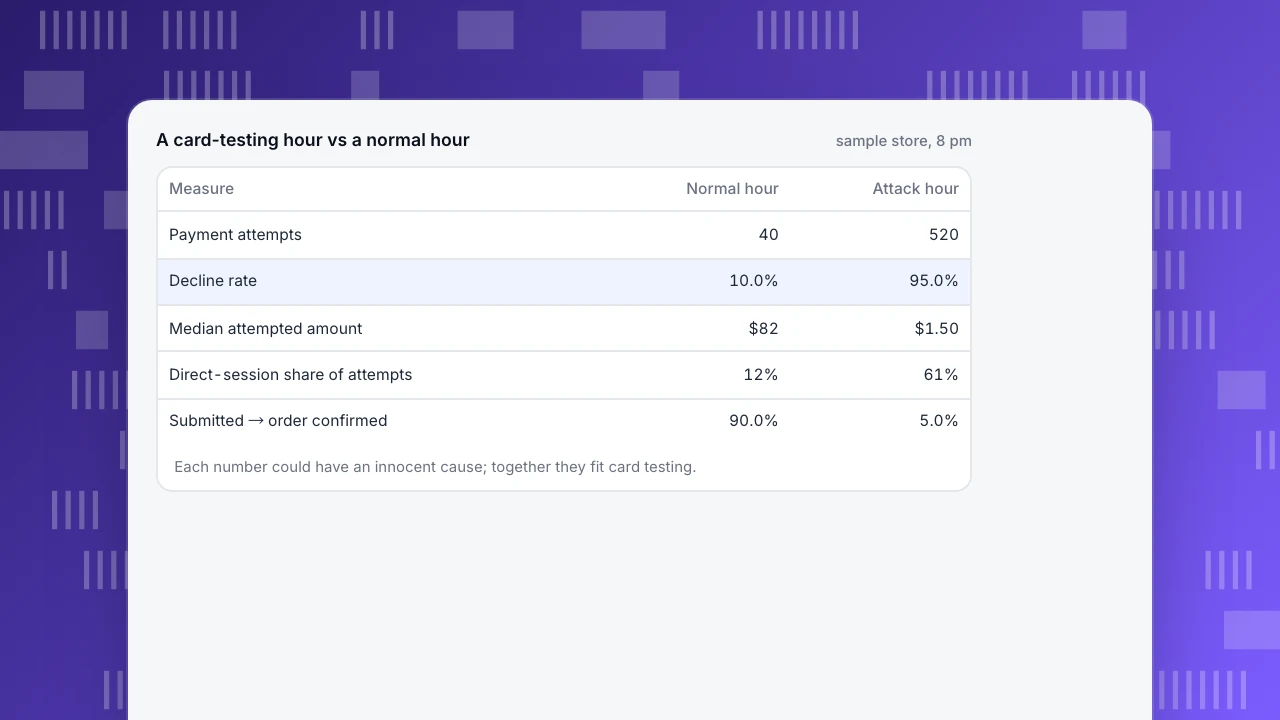
Check the ratios: 520 ÷ 40 = 13 times the attempts; declines 494 ÷ 520 = 95.0%; direct sessions 317 ÷ 520 = 61.0%; confirmed 26 ÷ 520 = 5.0%. Each number alone could have an innocent cause, a payment outage for instance would also raise declines. Together they fit card testing: many attempts, tiny amounts, almost all declined, from sessions that never browsed.
A useful alert rule combines two: attempts at least 3 times the same-hour median of the last four weeks, and a decline rate of at least 40%. The attack hour passes both (13 times, 95%); a normal hour does not.
A card-testing hour vs a normal hour
sample store, 8 pm| Measure | Normal hour | Attack hour |
|---|---|---|
| Payment attempts | 40 | 520 |
| Decline rate | 10.0% | 95.0% |
| Median attempted amount | $82 | $1.50 |
| Direct-session share of attempts | 12% | 61% |
| Submitted → order confirmed | 90.0% | 5.0% |
Each number could have an innocent cause; together they fit card testing.
Velocity: how many times from one place
Velocity checks count repeated actions by the same actor in a window. Typical limits, to tune against your own data:
| Check | Starting rule |
|---|---|
| Payment attempts per IP address | More than 5 in an hour |
| New customer accounts per IP | More than 3 in a day |
| Different cards on one account | More than 3 in a day |
| Orders of the same product to one address | More than 5 in a day |
Stripe suggests similar limits, for example capping how many cards can be added to an account and how many customers one IP address can create in a day. Calibrate each by reading a normal month first: if a real office shares one IP and places 6 orders in an hour, a limit of 5 will block it.
| Check | Starting rule |
|---|---|
| Payment attempts per IP address | More than 5 in an hour |
| New customer accounts per IP | More than 3 in a day |
| Different cards on one account | More than 3 in a day |
| Orders of the same product to one address | More than 5 in a day |
Starting points to tune against a normal month of your own data.
Bots at checkout
Real shoppers browse; scripts go straight to the payment endpoint. In analytics, look for checkout sessions that have no product page view before them, sessions with no scrolling or events, a sudden rise in "direct" traffic to checkout, and a single odd country or hosting provider. In the sample hour, the direct share of attempts went from 12% to 61%.
Keep bot traffic out of your normal reports as well, so it does not distort conversion rates or the hourly baselines that your alerts depend on.
Funnel anomalies after the payment step
The step from "payment submitted" to "order confirmed" is normally steady. In the sample it fell from 90.0% to 5.0%. Two different causes can look alike: attackers failing at your gateway (many attempts, low value) and your own filters blocking real shoppers (normal attempts, falling approval). Tell them apart with attempt volume and amounts: if attempts are flat and the confirm rate falls, suspect your rules or the gateway rather than an attack.
Country and time-of-day signals
Two more signals are cheap to read. The first is a country you rarely see. Sample data: country X normally supplies 0.5% of checkout sessions, and in the attack hour it supplies 18% (about 94 of 520 attempts). If you do not ship there, or your own sales there are close to zero, that is a strong clue, though a single feature should still be combined with the others. The second is time of day: scripted attacks often run at hours when real traffic is low, so a spike at 3 am is more suspicious than one at 8 pm. Compare each hour with the same hour on previous weeks, not with the daily average.
Why single-feature blocks disappoint
Blocking one country, one IP range or one user agent is the quickest response and usually the weakest. Sample data: a store has 24,000 checkouts a month and country X supplies 0.5% of them, so a country block loses 0.5% × 24,000 = 120 real checkouts, about $9,600 of revenue at $80 each, and an attacker who moves to another country is not affected. Stripe's guidance makes the same point about IP addresses: filters on a single heuristic are usually not enough on their own. Use single-feature blocks as a short-term brake while you put combined rules in place.
Countermeasures matched to signals
| Technique | Signal it answers | Friction cost | Note |
|---|---|---|---|
| CAPTCHA on payment and card-save endpoints | Attempt spike, scripts | Low if invisible, higher if visible | Validate server side |
| Rate limits per IP and per account | Velocity | Low | Tune from a normal month |
| Require login or a valid session before payment | Direct-to-endpoint scripts | Medium (guest checkout suffers) | Use on endpoints under attack |
| Limit cards per account | Many cards on one account | Low | |
| Refund suspicious small payments | Disputes | None | Stripe advises refunding to avoid disputes |
| Rotate and protect keys | Abuse of publishable or leaked keys | None | Keep secret keys out of public code |
Stripe's guidance recommends a combination, for example letting the first attempt from an IP succeed and asking for a CAPTCHA on later attempts for the next hours. A combination catches scripts while leaving most real shoppers untouched.
Measure the cost of false positives
Every rule blocks some real customers. Count them. Sample data, a longer attack: a rule blocks 380 fraudulent attempts and also 20 of 1,200 real checkouts. The false-positive rate is 20 ÷ 1,200 = 1.7%.
- Without the rule 90 fraudulent payments would have been approved; with it, 12, a saving of 78. At an assumed $95 each (an $80 order plus a $15 dispute fee) that avoids 78 × 95 = $7,410.
- The 20 blocked real orders cost 20 × $80 = $1,600 of revenue, or $640 of gross profit at a 40% margin.
The rule is worth keeping for the attack. Run the same arithmetic outside an attack: with no fraud, the rule only costs sales, so apply strict rules to the endpoints under attack or for the hours it lasts, not to every checkout indefinitely.
A response routine
- Confirm. Check volume, decline rate, amounts and source together.
- Contain. Turn on CAPTCHA or rate limits for the targeted endpoint.
- Clean up. Refund suspicious small payments.
- Check the baseline. Make sure the attack hour is excluded when you recompute normal levels.
- Review. Count real orders blocked and loosen anything too broad.
In TapCub
TapCub does not approve or decline payments and is not a fraud tool; it shows the traffic and funnel signals around them.
- Open Web analytics › Bots to see recognised bots and AI crawlers counted separately from people, so your visitor numbers and conversion rates stay clean.
- Send events such as
payment_attemptandpayment_failedfrom your checkout (browser or server), then build a funnel in All-platform analytics › Behavior › Behavior analysis to read submitted-to-confirmed rates. - In All-platform analytics › Operations › Monitors, create a check on a saved custom metric such as hourly payment attempts or the failed-payment count, checked hourly. Use the dry run, which tells you how many times it would have fired in the past 30 days. Alerts go to email, WeCom, DingTalk, Feishu or a webhook, and the same alert is not repeated for about 60 minutes.
- Read Web analytics › Sources and Web analytics › Audience to see a sudden rise in direct traffic or one new country.
A monitor only notifies you; it does not block anything. Blocking happens in your payment provider or your own code.
FAQ
What are the most effective ecommerce fraud prevention techniques?
A layered set: CAPTCHA and rate limits on payment endpoints, login or session checks before payment, limits on cards per account, and refunds of suspicious small payments, backed by analytics alerts on attempt spikes and decline rates.
How do I detect card testing?
Look for a spike in failed or blocked payments, many low-value attempts and sessions that never browsed. Stripe lists the same symptoms. Alert when attempts reach 3 times the same-hour median and declines reach 40%.
Can analytics tools stop fraud?
No. They show signals such as velocity, bot traffic and checkout anomalies. Blocking and approval happen in your payment provider or code.
How do I avoid blocking real customers?
Count false positives for each rule, apply strict rules only to targeted endpoints or for the duration of an attack, and combine CAPTCHA with rate limits so that the first attempt passes.
How common is online fraud?
The FTC reported more than $12.5 billion in consumer-reported fraud losses for 2024, up 25% on 2023. These are consumer reports, not merchant losses.
Sources
- U.S. Federal Trade Commission, New FTC data show big jump in reported losses to fraud to $12.5 billion in 2024 (March 2025). Checked 2026-11-21.
- Stripe Docs, Protect yourself from card testing (symptoms, CAPTCHA, rate limits, limiting cards per account). Checked 2026-11-21.
Was this article helpful?
We use your answers to fix and expand this page.
Couldn’t send. Please try again in a minute.
Thanks for the feedback. We’ll use it to improve this page.You’ve already sent feedback on this page. Thanks.

Product Analyst
Focuses on event analysis, conversion funnels, and retention, using clear metric definitions and structured analysis to explain product performance.