Growth & Marketing · Page 2
Frameworks are cheap. These notes are about turning one of them into a measured experiment, with the reports to prove it worked.
Growth articles start from a model (AARRR, a funnel, a retention curve) and end with a concrete experiment and the report that judges it. They also cover acquisition and marketing (SEO, ads, UTM, attribution) and the day-to-day operations of a website, app or mini program. We write them for marketers, growth and product people who have more ideas than engineering time and need a way to rank them.
Articles in Growth & Marketing
69 articles · page 2 of 2
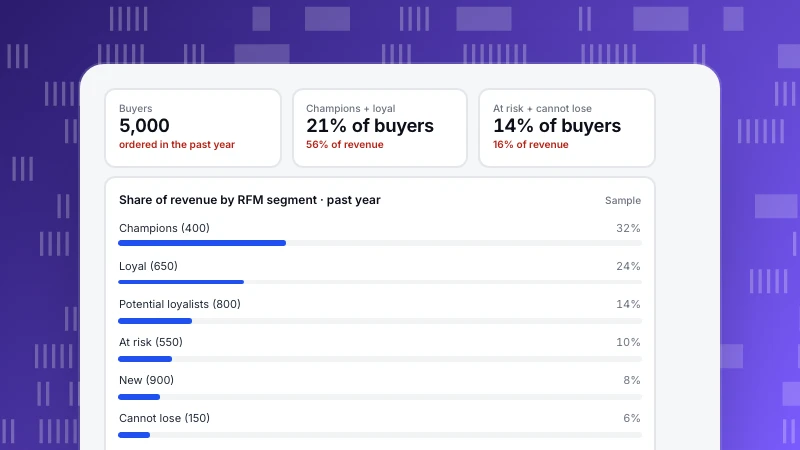
Customer Data Analytics: Five Questions to Answer, With an RFM Example
Customer data analytics turns profile, behaviour and purchase data into decisions about who to win, keep and grow. Five questions to answer, the data each needs, and an RFM example for a store with 5,000 buyers.
Read more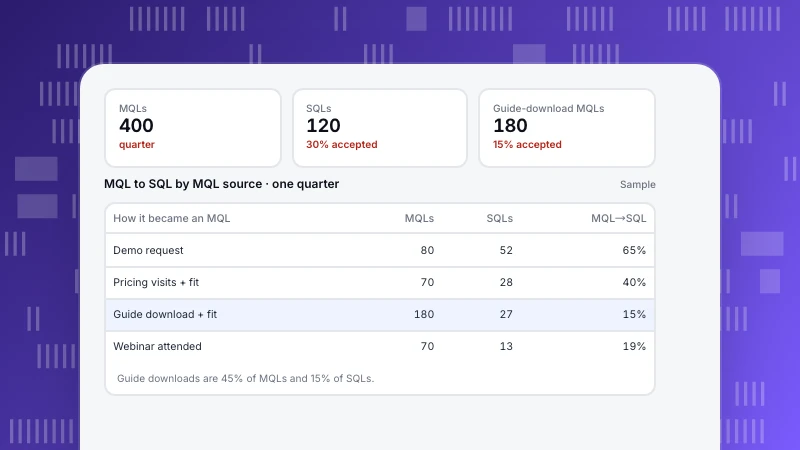
MQL vs SQL: The Difference, and How to Make the Handoff Work
An MQL is a lead marketing judges ready for sales attention; an SQL is a lead sales has accepted as a real buying opportunity. Definitions, a scoring model from fit and behaviour, and MQL-to-SQL rates by source in a worked example.
Read more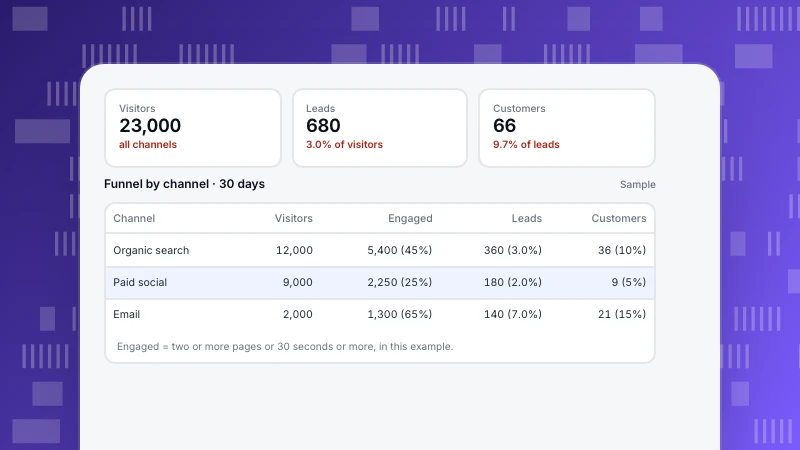
Marketing Funnel: The Stages, and How to Measure Each One
A marketing funnel describes how people move from first hearing about you to buying. The four stages, the metric that belongs to each, a sample funnel split by channel, and the mistakes that make funnel numbers misleading.
Read more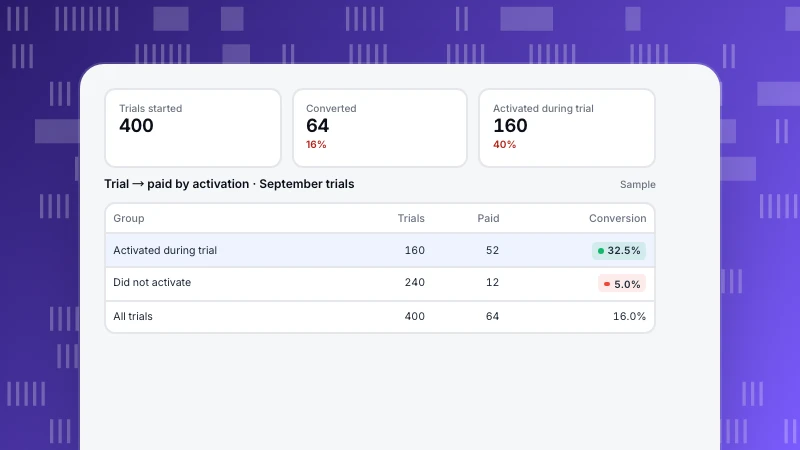
Free Trial Conversion Rate: How to Calculate It and What Moves It
Trial-to-paid conversion looks like a simple ratio, but extensions, early upgrades and different trial types change the answer. How to calculate it by trial-start cohort, and why activation inside the trial is the number that moves it.
Read more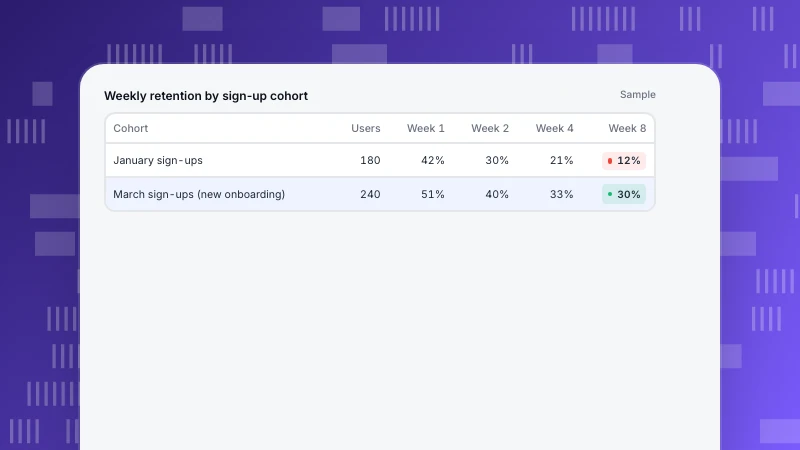
Startup Metrics by Stage: What to Measure Before and After Product-Market Fit
The right startup metrics depend on stage. What to measure before product-market fit, in early traction and in growth, the question each metric answers, the few events to instrument, and why a flattening retention curve matters more than any total.
Read more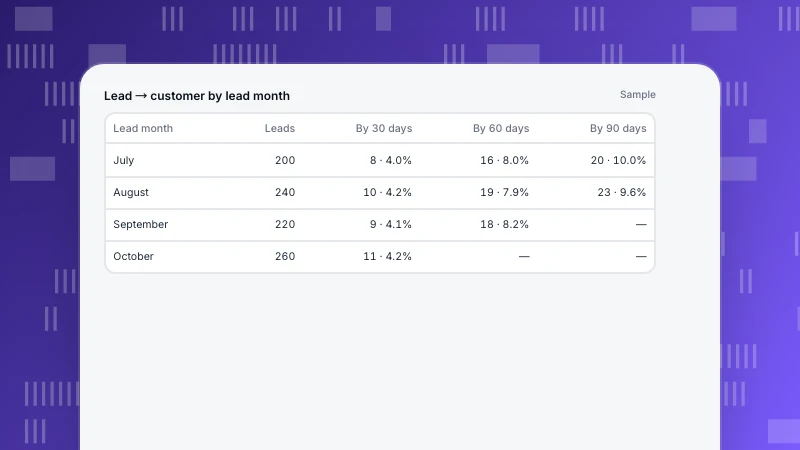
Lead Conversion Rate: Three Formulas and the Cohort Method
"Lead conversion rate" can mean visitor to lead, lead to qualified, or lead to customer. The formula for each, why dividing this month's customers by this month's leads misleads, and how to measure by lead cohort with a fixed window.
Read more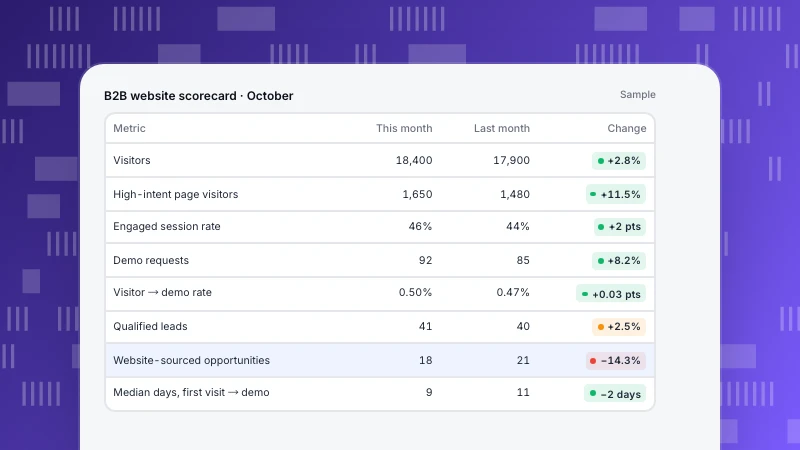
B2B Website Metrics: What to Track From First Visit to Pipeline
B2B buyers research anonymously, in groups, over weeks. The website metrics that reflect that, from high-intent page visits to lead-to-opportunity rate and time to convert, with formulas and a sample monthly scorecard.
Read more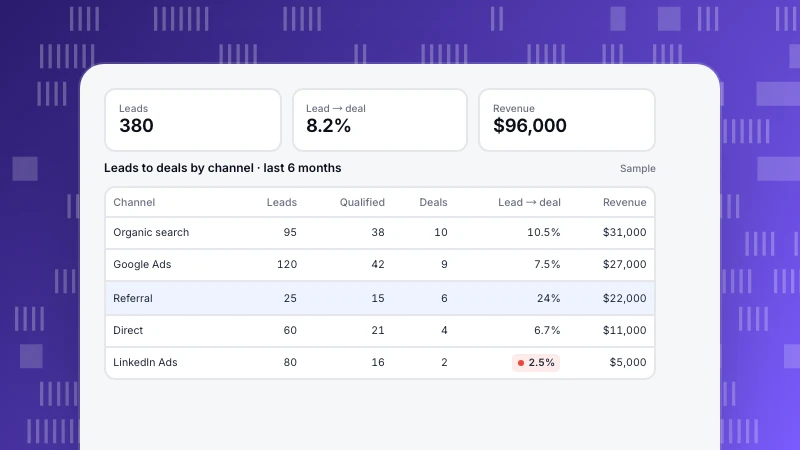
Lead Tracking: From First Visit to Closed Deal, by Channel
Lead tracking connects each lead to where it came from and what happened to it next. How to capture the source on the website, pass it with the form, send qualification and deal stages from your server, and judge channels by deals instead of lead counts.
Read more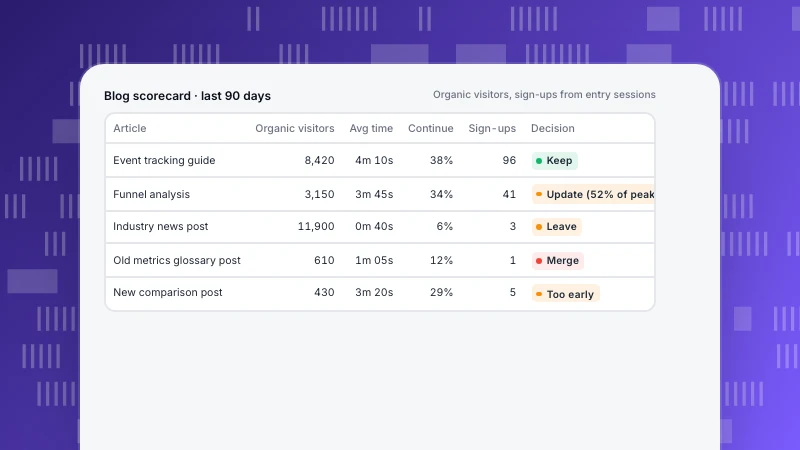
Content Performance Metrics: Score Each Article in Four Stages
Content performance metrics grouped into four stages for each article (found, read, acted, lasted), a scorecard that turns them into keep, update, merge or remove decisions, and a fixed-window check for decay.
Read more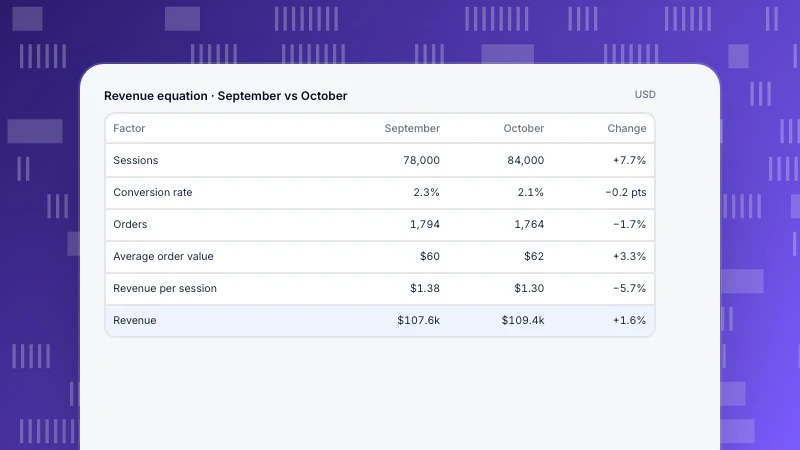
Ecommerce KPIs: One Revenue Equation and What Moved It
Ecommerce KPIs organised around one equation: revenue = sessions × conversion rate × average order value. Compare months factor by factor, add repeat purchase and refunds, and know where each number comes from.
Read more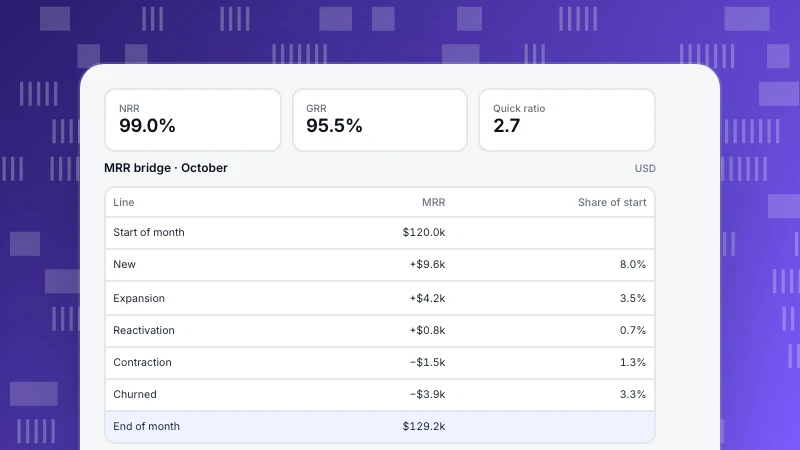
SaaS Metrics: One MRR Bridge and the Ratios Built on It
SaaS metrics tied together by one MRR bridge: new, expansion, reactivation, contraction and churned MRR, with NRR, GRR, quick ratio and CAC payback computed from it, and the product signals that lead each line.
Read more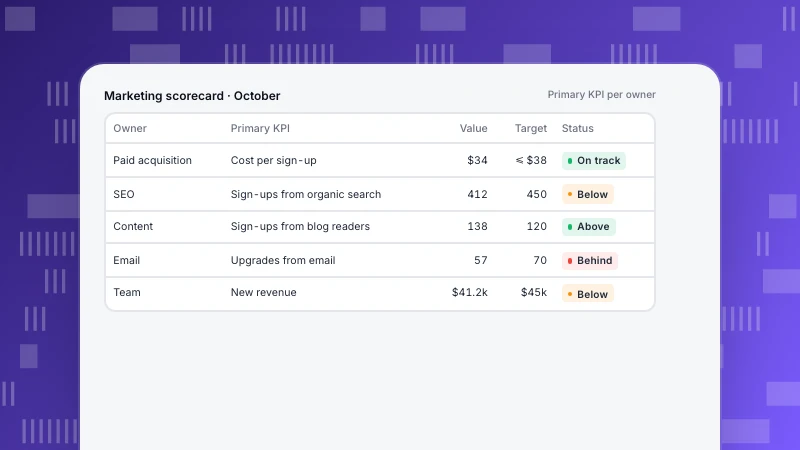
Marketing KPIs: Build a Tree from Revenue Down to Each Channel
Marketing KPIs organised as a tree from revenue down to channel inputs, with one primary KPI per channel owner, platform numbers kept apart from outcomes measured on your site, and a review cadence.
Read more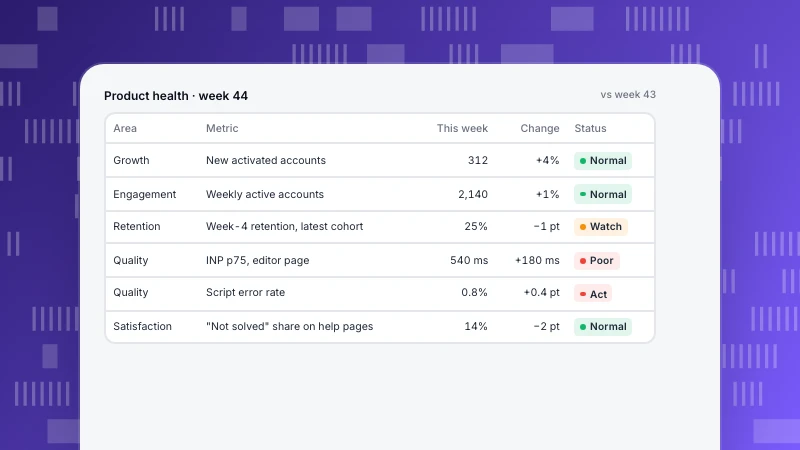
Product Health Metrics: A Weekly Scorecard That Includes Quality
Product health metrics in five areas (growth, engagement, retention, quality, satisfaction) on one weekly scorecard, with thresholds that turn a number amber or red and a routine for reviewing it.
Read more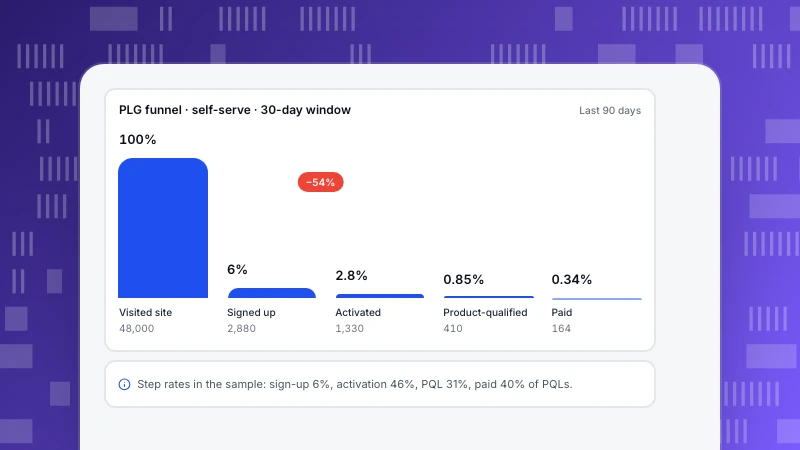
Product-Led Growth Metrics: One Funnel from Visitor to Expansion
PLG metrics as one connected funnel from visitor to expansion: the event behind each metric, how to define a product-qualified lead from usage, and how to measure team products by account.
Read more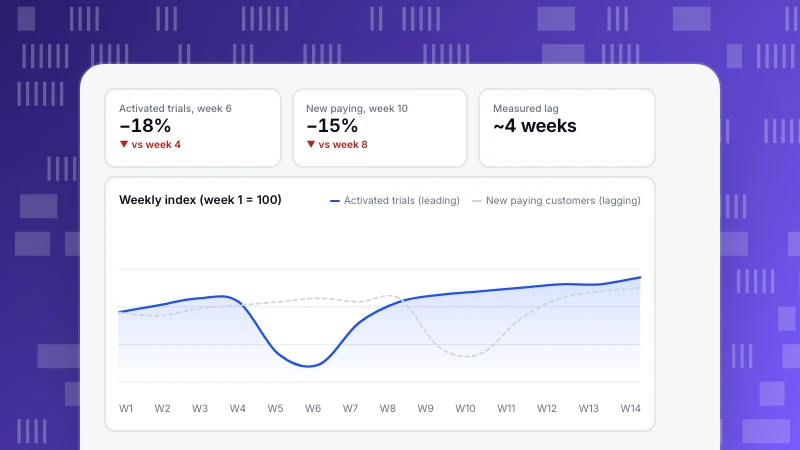
Leading vs Lagging Indicators for Product and Growth Teams
Leading vs lagging indicators with product and website examples by funnel stage, a method to find and validate a leading indicator in your own data, and how to alert on it.
Read more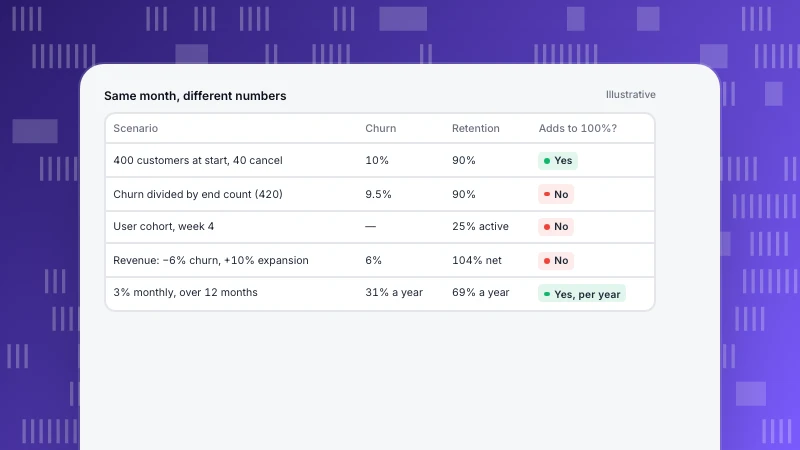
Churn Rate vs Retention Rate: When They Add Up and When They Do Not
Churn and retention look like two sides of one number, but they only add up to 100% in one case. Worked scenarios for customers, revenue and user cohorts, plus net revenue retention and annual churn.
Read more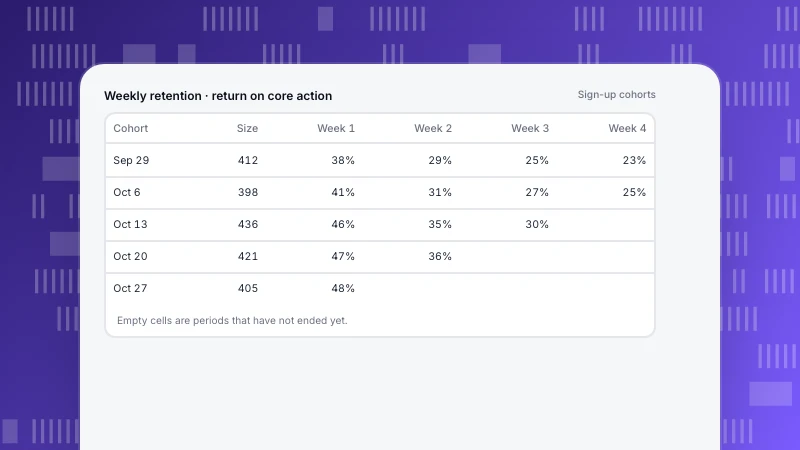
Retention Metrics: Which Rate to Use and How to Calculate It
The retention metrics that actually differ, how to calculate retention rate with a worked example, the counting choices that change the number, and which metric fits which business.
Read more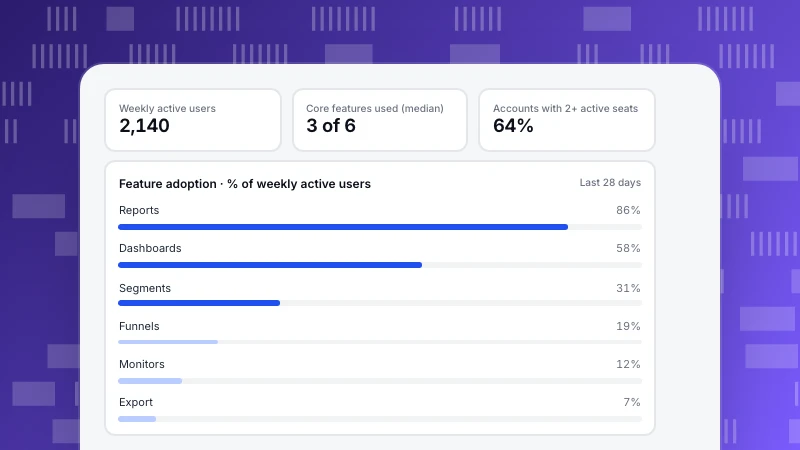
How to Measure Product Adoption, Feature by Feature
How to measure product adoption with events: how it differs from activation, the four dimensions of feature adoption, choosing the right denominator, and account-level adoption for B2B products.
Read more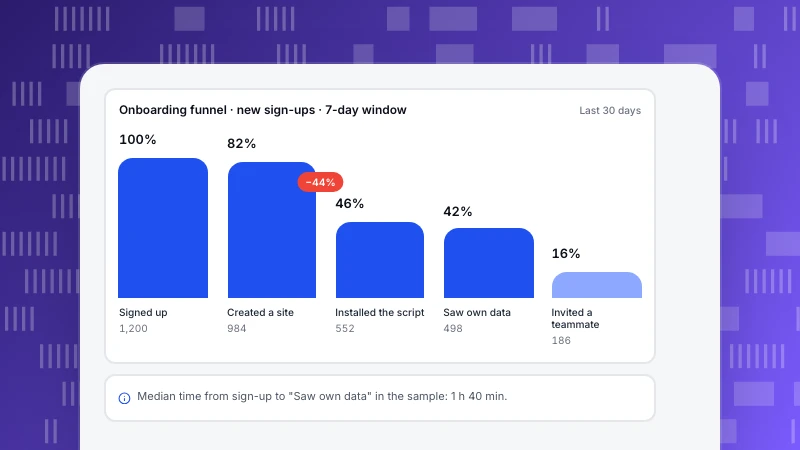
User Onboarding Metrics: Activation, Time to Value and the Funnel
Onboarding metrics for software products: how to define activation and test it, build the onboarding funnel from events, measure time to value, and tie onboarding to retention.
Read more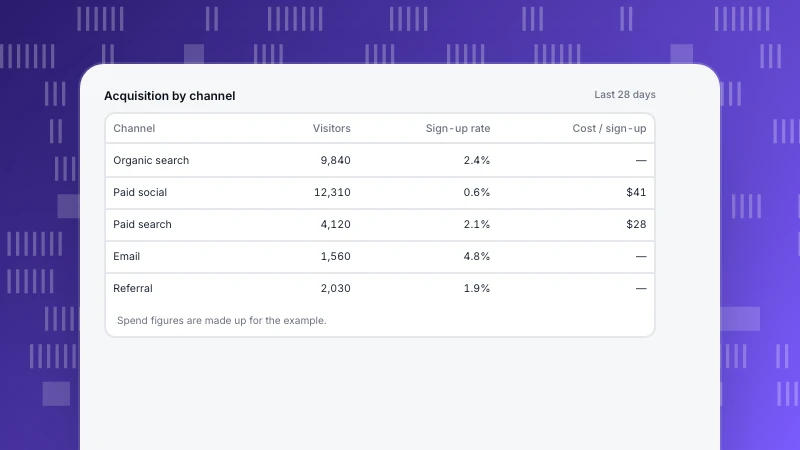
Acquisition Metrics: How to Measure Each Channel, Not Just Traffic
Acquisition metrics in three layers (volume, quality, cost), measured per channel and joined to sign-ups and revenue, plus why channel numbers never agree between tools.
Read more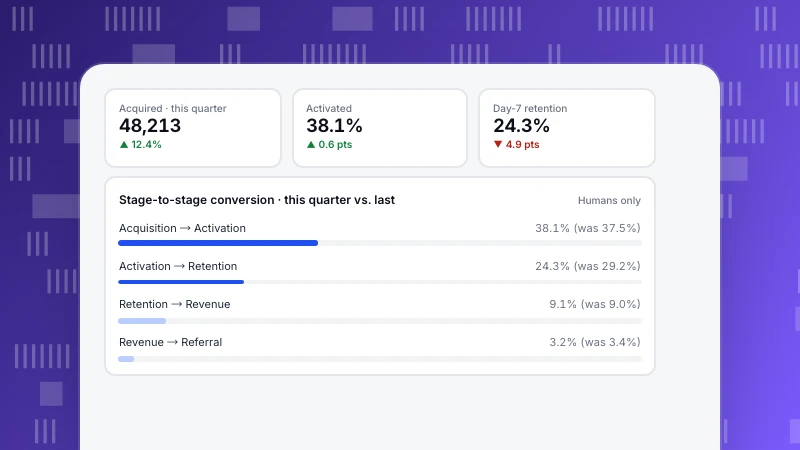
AARRR metrics: what to measure at each stage, and which stage to fix first
AARRR metrics for every stage with formulas, a worked example in people, examples for SaaS, stores and content sites, and how to pick the one stage worth fixing first.
Read moreOther categories
Each category answers a recurring question we hear from customers. Start with the one closest to your job.
Analytics
Definitions, funnels, retention and the data-quality questions behind every number.
87 articlesLive Chat
Proactive invites, translation and turning support conversations into conversions.
10 articlesAI Search
GPTBot, ClaudeBot, PerplexityBot: who fetches your pages, what the files say and what comes back.
32 articlesProduct News
What shipped, why we built it that way, and how to turn it on.
32 articles