Try it on your own data
Every report in this article is in the free plan. One snippet for web and apps, up to 10 sites.
Start freeTo find out a competitor's marketing strategy, read what they do in public, channel by channel: the ads in Meta's and Google's libraries, how often their sitemap changes, their source mix and their pricing page. Each finding is a hypothesis about their strategy, not proof it works, so pair it with a test on your own site.
What you will learn
- Record five things from ad libraries: active ads, landing pages, themes, formats and start dates
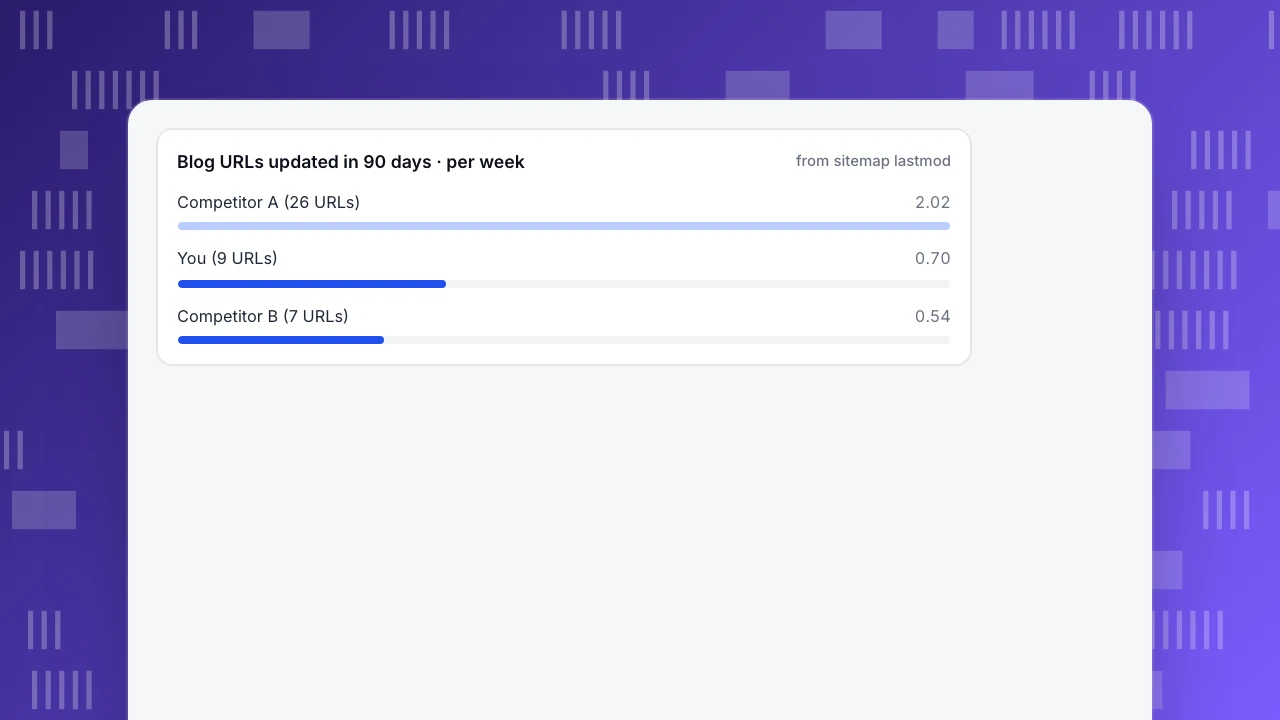
- Sitemap lastmod gives a content cadence: in the sample, 26 URLs in 90 days is 2.02 a week against your 0.70
- Write each finding as observation, hypothesis, test and metric, and test one per month
What can public data tell you about a competitor's marketing and what can't it?
Public data shows what a competitor does in public: the ads that are running, the pages they publish, the words on their pricing page, the channels they appear in. It does not show what works for them: their conversion rates, their cost per customer, their budgets. Every finding in this article is therefore a hypothesis about their strategy, and the useful step is to turn it into a test you can run on your own site.
Work channel by channel, record the date of every observation and keep a sheet with four columns: channel, what you saw, what you infer, how you will test it. That is more useful than a long document of screenshots.
For traffic estimates and benchmarking tools, see seeing a competitor's website traffic and competitor benchmarking. This article covers what you can read for free, from the competitor's own public pages and the public ad libraries.
How do you see what ads a competitor is running?
Both of the big ad platforms publish searchable libraries:
- Meta Ad Library. Meta's help page says it covers ads currently running across its apps, searchable by keyword or advertiser, and that a new ad shows up within about 24 hours of its first impression. Inactive ads can be searched only for ads about issues, elections or politics (kept for seven years); in the EU, ads are archived for one year after their last impression.
- Google Ads Transparency Center. Google's policy page says it lists the advertiser name, location, the entity paying for the ads and the ads served over a set period for advertisers on Google platforms including Search and YouTube, and lets you filter by region and date.
Record the same five things for each competitor:
| What to record | Why it matters |
|---|---|
| Number of active ads | Rough size of the effort |
| Distinct landing pages | Which offers they push |
| Message themes (price, speed, trust, features) | Their positioning |
| Formats (video, image, carousel) | What they invest in producing |
| Start dates of active ads | How long an ad has survived |
Sample data: Competitor A has 36 active ads on 5 landing pages; 9 of them (25%) started more than 60 days ago. Competitor B has 8 active ads on 2 landing pages. Hypothesis, not fact: ads that keep running for more than two months probably earn their cost, so the themes of those 9 ads are the ones to study first. You cannot see spend or results, and an ad can run a long time simply because nobody turned it off.
How do you measure a competitor's content cadence?
Publishing pace is visible without any paid tool. Most sites publish an XML sitemap (often at /sitemap.xml), and each URL can carry a lastmod date, which the sitemap protocol defines as the date the linked page was last modified in W3C Datetime format (for example 2026-11-15). A sitemap file holds up to 50,000 URLs, so large sites split theirs into several files listed in an index.
Count blog URLs with a lastmod in the last 90 days:
| Site | Blog URLs updated in 90 days | Per week (÷ 12.9 weeks) |
|---|---|---|
| You | 9 | 0.70 |
| Competitor A | 26 | 2.02 |
| Competitor B | 7 | 0.54 |
Competitor A publishes or updates 2.9 times as many pages as you (26 ÷ 9). Read this with care: lastmod can mean an edit, not a new post, and some sites set it to the build date, so a sample of ten URLs opened by hand tells you whether the dates are real. Then read the titles of the 26 pages: if 20 target the same topic cluster, that is a deliberate content strategy, and if they cover 20 unrelated topics it is volume without focus.
Blog URLs updated in 90 days · per week
from sitemap lastmodHow do you compare a competitor's traffic source mix?
Third-party estimates of a competitor's traffic sources are rough, so use them for shape, not for exact numbers. A difference of fewer than five points between two sites tells you nothing.
Sample data: estimated share of sessions by source (illustrative numbers from an estimation tool).
| Source | You | Competitor A | Competitor B |
|---|---|---|---|
| Organic search | 38% | 55% | 18% |
| Direct | 27% | 20% | 22% |
| Paid search | 12% | 5% | 40% |
| Social | 10% | 8% | 15% |
| Referral | 8% | 10% | 3% |
| 5% | 2% | 2% |
The gaps worth a hypothesis are the big ones. Competitor A is 17 points higher on organic search, so look at their content (previous section) and the pages that rank. Competitor B is 28 points higher on paid search; with only 8 active ads on 2 landing pages, that implies a large budget per ad, which is a spending bet you cannot see from outside. Your own source mix is the one number in the table you can verify, which is why it is worth setting up properly.
What do positioning and pricing and product pages reveal?
Most of a competitor's strategy is written on its own site.
- Homepage headline and sub-headline. The first sentence is who they want to win. Compare it with last quarter using the Internet Archive's Wayback Machine.
- Pricing page. Plan names, the limits that separate plans, and what is hidden behind "contact sales" show whether they target small teams or large ones. Check the history for changes.
- Changelog and release notes. Release cadence and themes show where product effort goes.
- Job postings. Ten open roles in sales development and none in support suggests where the money is going. Treat it as a weak signal.
- Newsletter and email. Subscribe with a work address and note frequency, the offers and how they handle the welcome sequence.
- Reviews and community. What customers praise and complain about is the gap your messaging can address.
A worked example of reading a snapshot pair: in March a competitor's headline says "Analytics for everyone" and the pricing page lists a free plan; by September the headline says "Analytics for finance teams" and the free plan is gone. Hypothesis: they are moving upmarket and giving up self-serve volume. What that means for you: the small-team segment may be less contested, so test a message aimed at it and watch signups from that segment.
Only read public pages, follow each site's terms and do not try to bypass logins.
How do you turn what you found into a decision?
Write each finding as an if-then and attach a test and a number to watch.
| Observation | Hypothesis | Test on your own site | Number to watch |
|---|---|---|---|
| A publishes 2.9× your content, clustered on one topic | That topic drives their organic growth | Publish a cluster of six pages on one topic you can rank for | Organic sessions to those pages after 90 days |
| 25% of B's ads have run 60+ days | Those themes convert | Make a version of the best theme with your own proof | Conversion rate by landing page |
| B's pricing page has no free plan | They target teams with budget | Test a free-trial message against a demo request | Signup rate by channel |
| A's welcome email promises a checklist | A lead magnet feeds their list | Offer a smaller, faster asset | Email signup rate |
Label each hypothesis with a confidence level (high if you saw it in two sources, low if it rests on one) and test the high-confidence ones first. Pick one row per month. Doing a lot of tests at once leaves you unable to say which one moved the number.
| Observation | Hypothesis | Test on your site | Number to watch |
|---|---|---|---|
| A publishes 2.9× your content on one topic | That topic drives their organic growth | Publish six pages on one topic you can rank for | Organic sessions to those pages after 90 days |
| 25% of B's ads have run 60+ days | Those themes convert | Test the best theme with your own proof | Conversion by landing page |
| B has no free plan on its pricing page | They target teams with budget | Trial message against demo request | Signup rate by channel |
| A's welcome email offers a checklist | A lead magnet feeds their list | Offer a smaller, faster asset | Email signup rate |
Label each hypothesis high or low confidence by how many sources support it.
What does a one-week routine look like?
- Day 1: list three direct competitors and write the question you are answering ("why is A winning organic search?").
- Day 2: ad libraries: record the five items for each.
- Day 3: sitemaps: count recent blog URLs and read ten titles.
- Day 4: homepage, pricing page and changelog snapshots with dates.
- Day 5: write the hypothesis table above and choose one test.
Repeat every quarter and compare with the previous sheet. Changes between snapshots are the real signal.
How do you use TapCub to test what you learn?
TapCub measures your own site, apps and chat. It does not show competitor traffic or ads. What it does is tell you whether the test you picked from competitor research worked.
- Tag the links in your test with UTM parameters, then open Web analytics › Sources and read the UTM tab to separate the test's visitors from everyone else.
- Check your own source mix on the Channels tab, the same channel rows as the sample table. Compare two date ranges to see whether a content or ad test moved a share.
- If you run paid tests, import spend under All-platform analytics › Business › Channel ROI (by day, channel, source or campaign) to get cost per click, cost per acquisition and return on ad spend by group.
- Add a date marker under Configuration › Annotations the day the test launches, so the change is visible on every trend.
- In Web analytics › Goals, count the conversion you are testing for, and compare the goal's conversion by channel before and after.
TapCub does not run ads, bid, or A/B test: it only measures. Its bot reports also separate real visitors from crawlers, so a competitor's tool crawling your pages does not inflate your visitor numbers.
FAQ
How can I find out what my competitors are doing for marketing?
Use public sources channel by channel: the Meta Ad Library and Google Ads Transparency Center for ads, sitemaps for publishing cadence, their homepage, pricing page and changelog for positioning, and their email list. Record dates and treat each finding as a hypothesis to test.
Can I see how much a competitor spends on ads?
No. The ad libraries show which ads run, not budgets or results. You can see how many ads, which landing pages and how long each has run, which is a weak proxy for what works.
How do I see how often a competitor publishes content?
Open their sitemap and count URLs with a recent lastmod date, then open a sample to check the date is real. The sitemap protocol defines lastmod as the date the page was last modified, so edits count too.
Are competitor traffic estimates accurate?
They are directional. Use them to see the shape of a source mix, such as organic versus paid, and ignore gaps under five points. Your own analytics is the only exact source for your site.
Is it legal to research competitors' marketing?
Reading public pages and public ad libraries is common practice. Do not bypass logins, ignore a site's terms or misrepresent who you are. If in doubt, ask a lawyer.
Sources
- Meta, What is the Meta Ad Library and how do I search it?: active ads across Meta apps, appearance within about 24 hours, inactive ads for political topics kept seven years, EU ads one year. Checked 2026-11-21.
- Google, Ads transparency, Advertising Policies Help: Ads Transparency Center shows advertiser name, location, payer and ads served over a period. Checked 2026-11-21.
- sitemaps.org, Sitemaps protocol: lastmod definition, W3C Datetime format and the 50,000-URL and 50 MB limits. Checked 2026-11-21.
Was this article helpful?
We use your answers to fix and expand this page.
Couldn’t send. Please try again in a minute.
Thanks for the feedback. We’ll use it to improve this page.You’ve already sent feedback on this page. Thanks.

Product Adoption Consultant
Explores customer onboarding, live conversations, and self-service, turning common usage questions into practical guidance and improvements.