Growth & Marketing · Page 3
Frameworks are cheap. These notes are about turning one of them into a measured experiment, with the reports to prove it worked.
Growth articles start from a model (AARRR, a funnel, a retention curve) and end with a concrete experiment and the report that judges it. They also cover acquisition and marketing (SEO, ads, UTM, attribution) and the day-to-day operations of a website, app or mini program. We write them for marketers, growth and product people who have more ideas than engineering time and need a way to rank them.
Articles in Growth & Marketing
238 articles · page 3 of 5
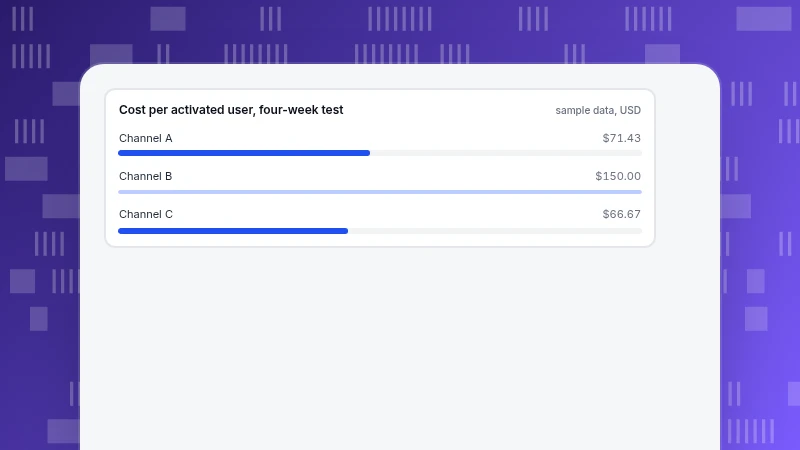
Startup Marketing: Pick Three Channels and Go Deep, Not Wide
Startup marketing works best when a small team picks three channels and runs fixed tests, not ten at once. Growth arithmetic, why small samples mislead, a scoring sheet and a four-week budget example.
Read more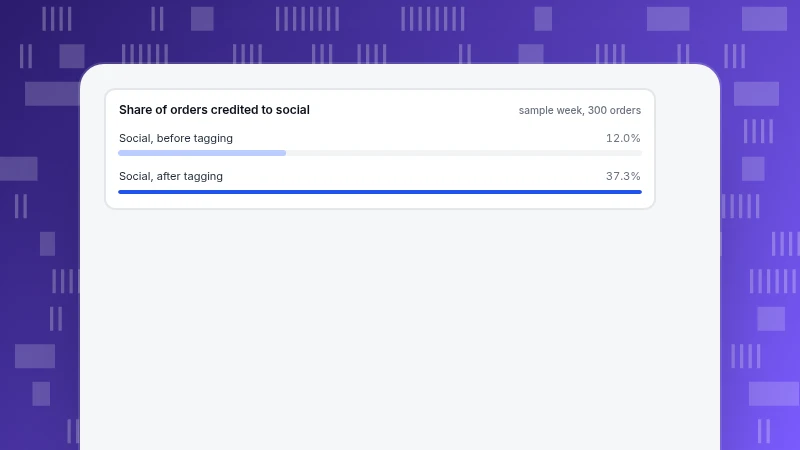
What Is Social Commerce? Models and How to Measure It
What social commerce is, the five main models and what your own analytics can see of each, plus a before-and-after example of tagging creator links and a margin-based view of creator spend.
Read more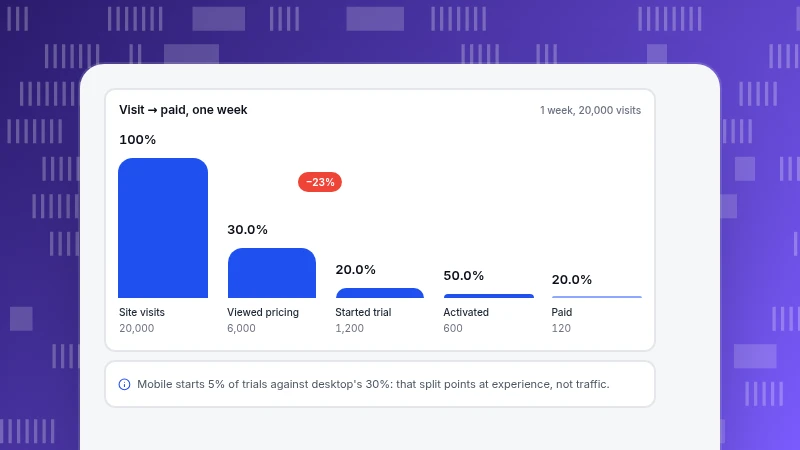
Sales Funnel Optimization: Find the Leak Before You Fix It
Sales funnel optimization starts with finding the step that got worse, then splitting it by source and device to tell traffic problems from experience problems. A recomputable example and a checklist of mistakes.
Read more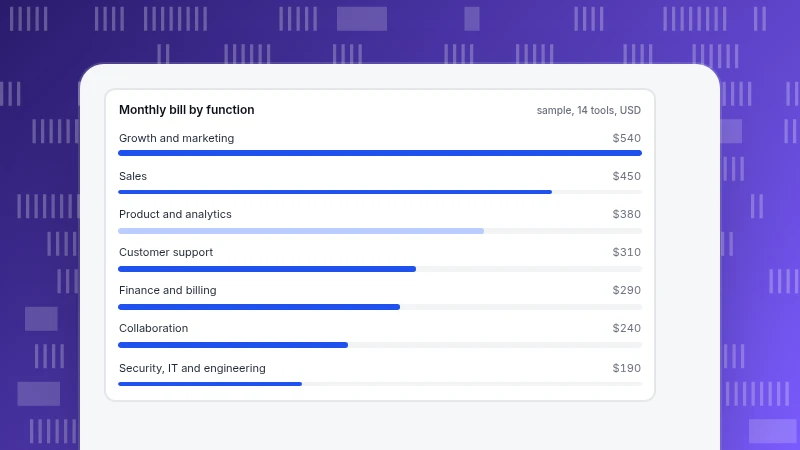
SaaS Tools: How to Build a Stack by Function
SaaS tools are the subscriptions a company runs on. Group them by function, decide before adding, audit overlap and idle seats, and retire tools safely, with a recomputed 14-tool example.
Read more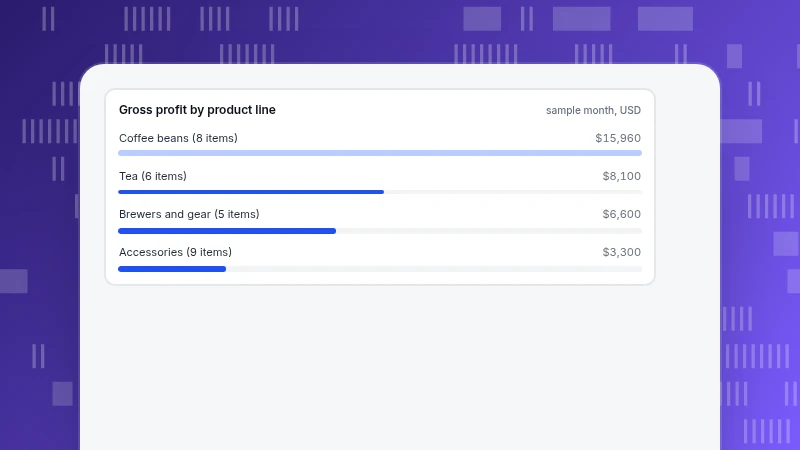
What Is a Product Mix? Width, Length, Depth and Consistency Explained
A product mix is all the lines and items a company sells. The four dimensions (width, length, depth, consistency), a four-line worked example with shares of revenue and gross profit, and how to decide what to widen, deepen, trim or tighten.
Read more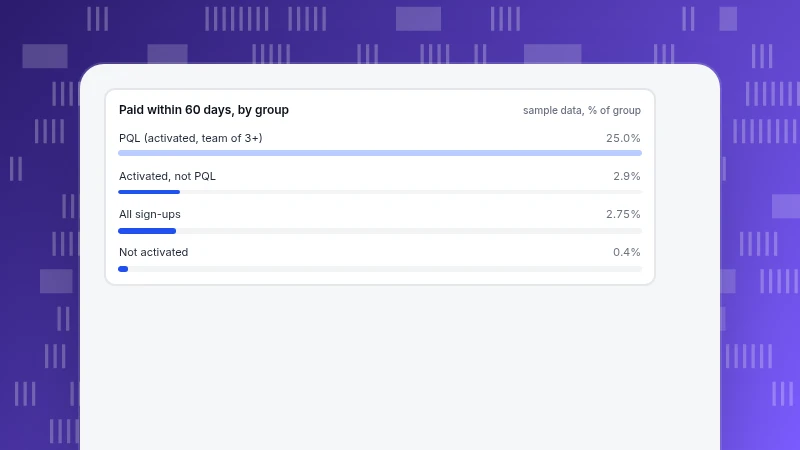
Product-Led Growth Strategy: Five Decisions and the Numbers to Check Them
A product-led growth strategy comes down to five decisions: entry, value, habit, spread and handoff. How to pick the activation event from data, define and test a product-qualified lead, and when PLG is a poor fit, with a worked funnel.
Read more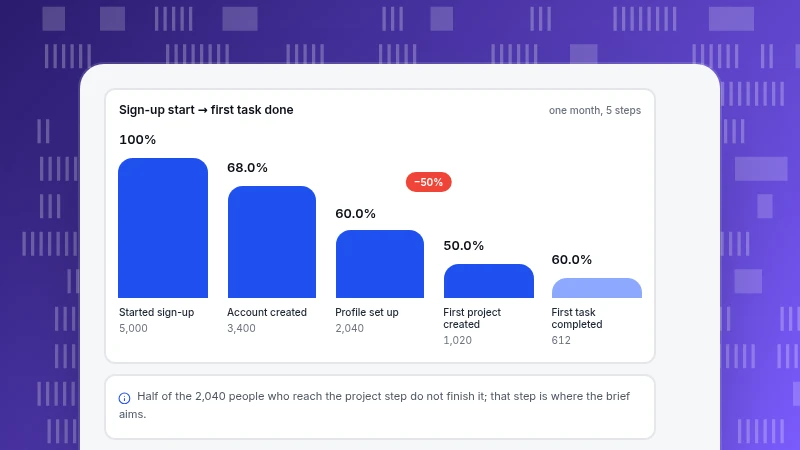
Product Design Process: Four Phases and the Data Each One Needs
The product design process in four phases (Discover, Define, Develop, Deliver), with the question, evidence and decision for each, a worked onboarding example and the 5-user test model worked out.
Read more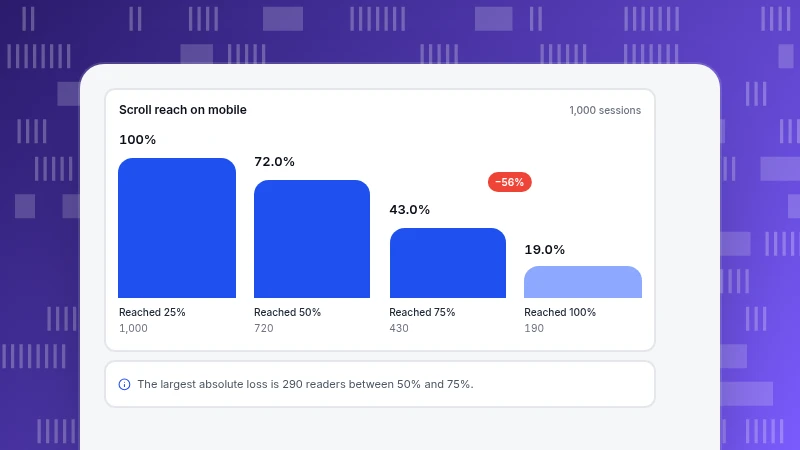
Mobile Content Marketing: How to Measure Load, Reading and Return
Mobile content marketing is measured in three layers: load, read and return. See Core Web Vitals thresholds, a recomputed 75th-percentile example, a scroll funnel and a mobile versus desktop comparison.
Read more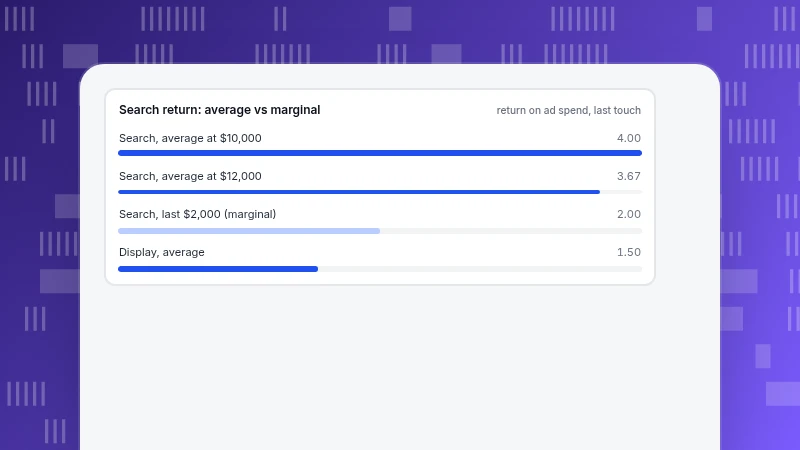
Marketing Optimization: How to Move Budget From Weak Channels to Strong Ones
Marketing optimization means moving budget to the channels that return more, once your measurement is stable. See a recomputed four-channel example, marginal versus average return and rules for how much to move.
Read more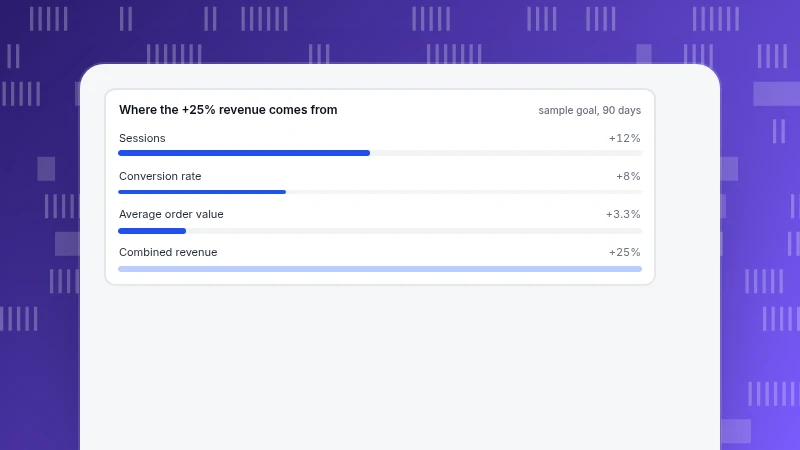
Marketing Goals: How to Set Ones You Can Measure and Reach
A marketing goal is a business result with a number and a date. See how to split a revenue goal across sessions, conversion and order value, assign channels, set checkpoints and read a missed one.
Read more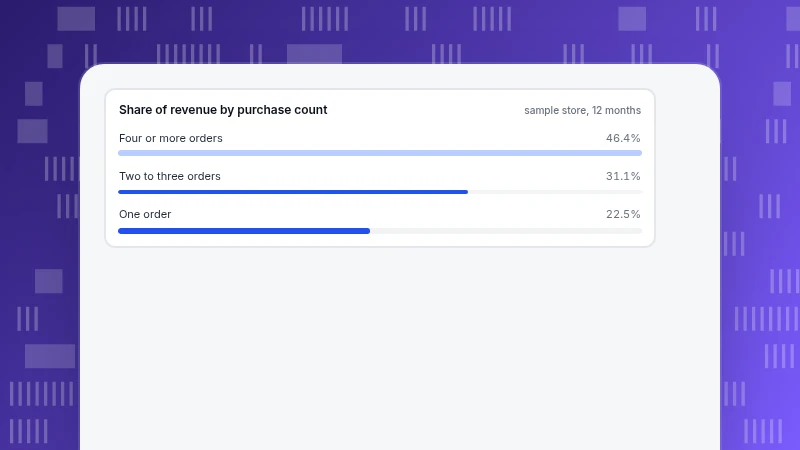
Market Segmentation Examples: Four Bases With Numbers You Can Check
Market segmentation examples for the four bases: demographic, geographic, behavioral and psychographic. See what a behavioral split looks like in order data and how to test whether a segment is real.
Read more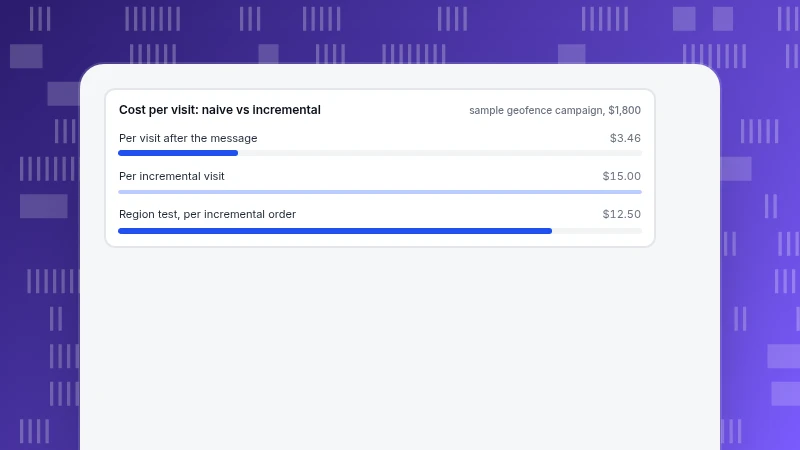
Location-Based Marketing: Consent First, Then Measure Visits and Lift
Location-based marketing works best when consent comes before targeting and results are measured against a holdout. See the types, how precise each source is, a recomputed geofence example and a region-level test.
Read more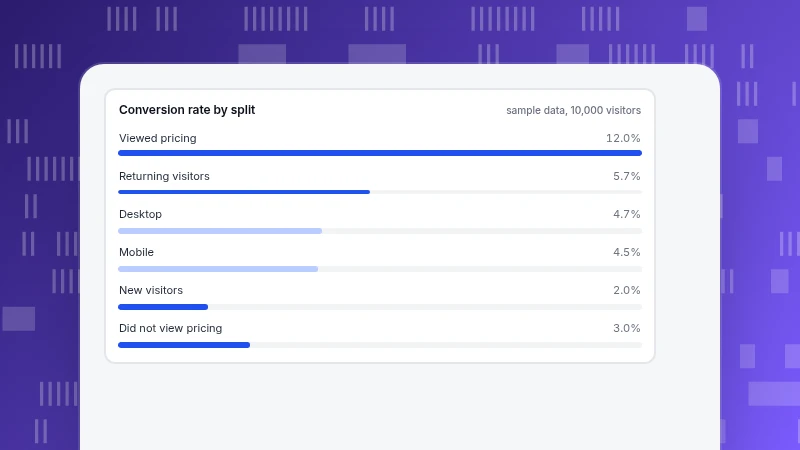
How to Segment Your Audience: Pick One Dimension, Then Prove It Matters
How to segment your audience: choose one dimension you can act on, define the rule, and test that the groups really behave differently. A worked example splits 10,000 visitors four ways and shows which two splits are worth keeping.
Read more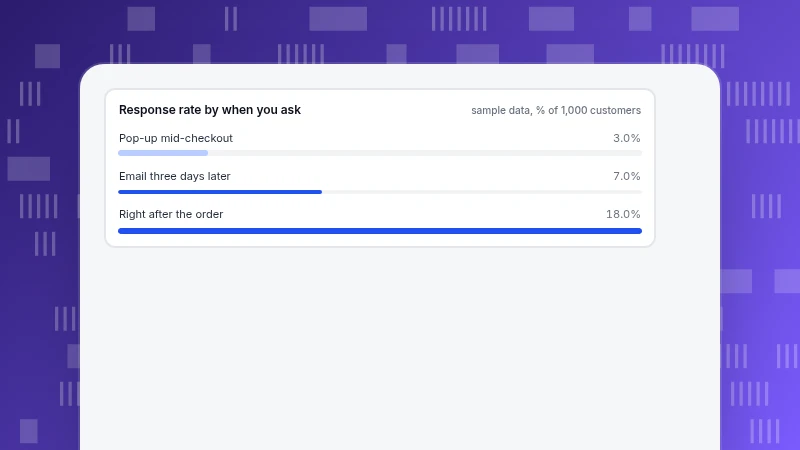
How to Collect User Feedback: Ask After the Task, Then Check What They Did
How to collect user feedback that you can act on: match the method to the question, ask right after a task is completed, and read a low response rate honestly. Includes a worked example of 46 ratings from 200 chats.
Read more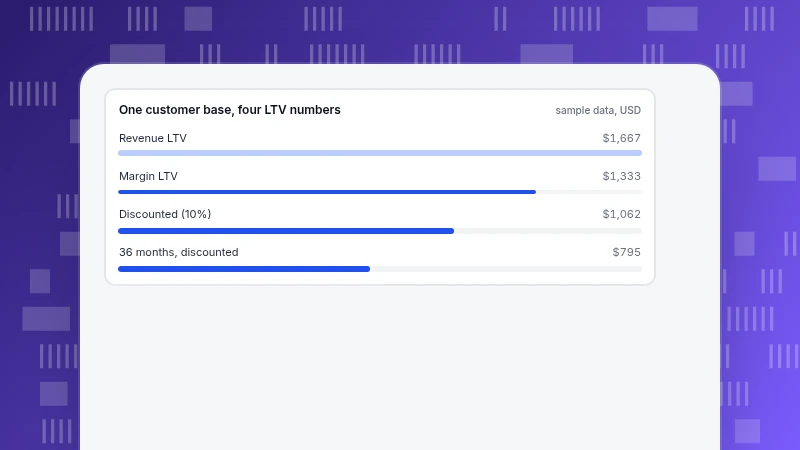
How to Calculate LTV: Formulas, Churn and a Worked Example
How to calculate LTV with the revenue, margin, discounted and capped formulas. One worked customer base gives four different numbers, and the churn definition decides which one passes the 3:1 test against CAC.
Read more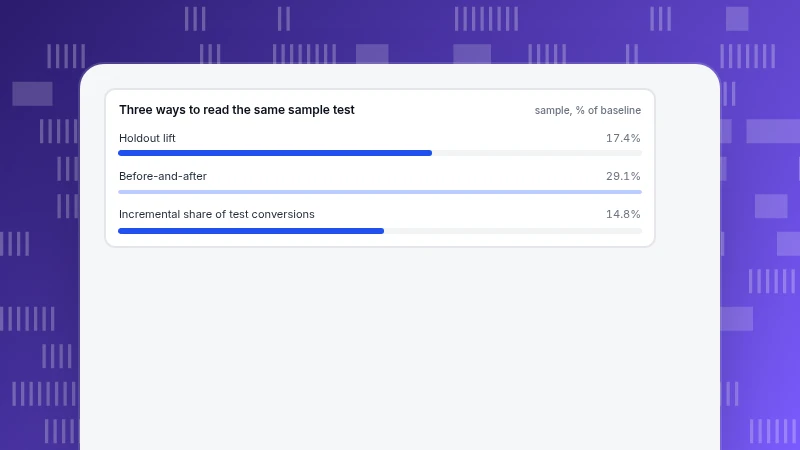
How to calculate incrementality with a holdout group
Incrementality is (test rate − holdout rate) ÷ holdout rate, measured with a randomised holdout, not a before-and-after comparison. One worked example from lift to cost per extra conversion, plus the margin of error.
Read more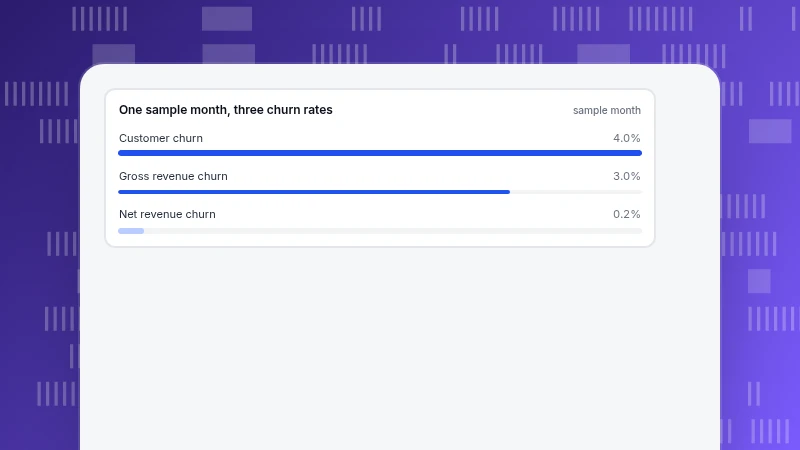
How to calculate churn rate: customer and revenue churn, with one worked month
Churn rate is what you lost divided by what you had at the start, but customers and revenue give different answers. One sample month as three churn rates, the denominator mistakes, and why monthly × 12 is wrong.
Read more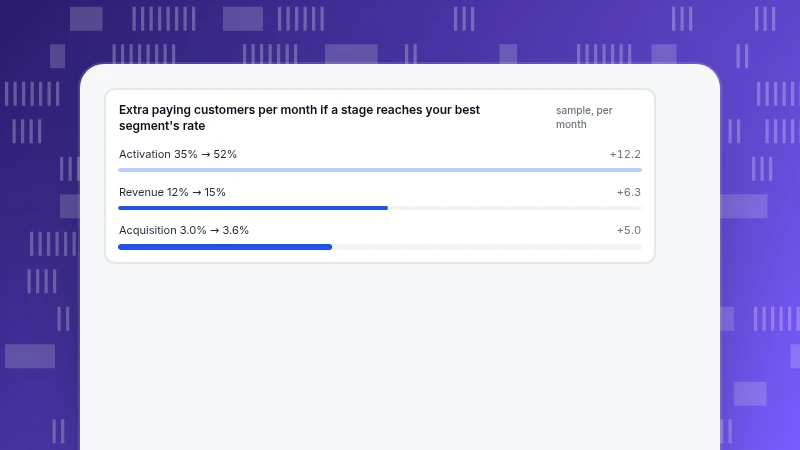
Growth marketing strategies: find the bottleneck, then pick the tactic
A growth marketing strategy is a choice of where to put effort, not a list of tactics. How to find the leaking stage, match strategies to it, and rank them by gain per effort.
Read more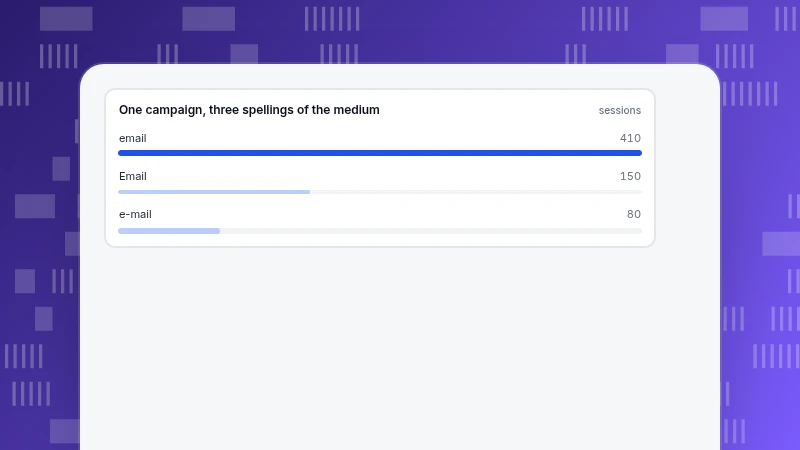
Email promotion: tag every link to see what it earns
Email promotion only pays off if you can see the return. How to tag links with UTM parameters, compute every metric of a send, and why open rate no longer counts.
Read more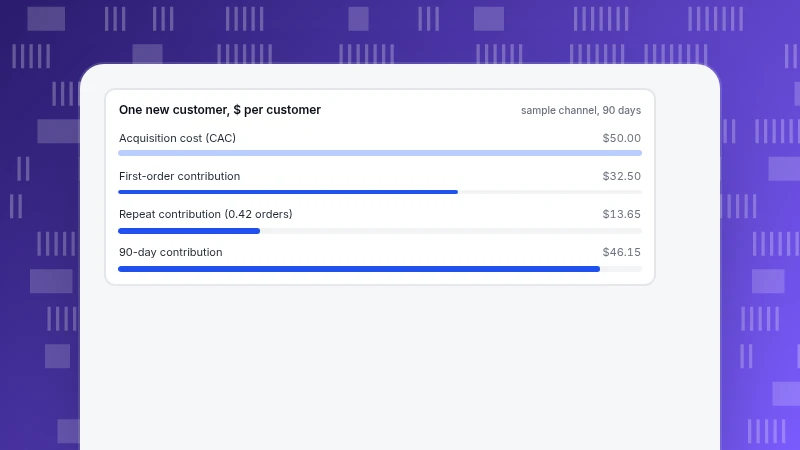
DTC Marketing: The Metrics That Show Whether It Pays Back
DTC marketing works when you own your customer data: it lets you measure acquisition cost and repeat purchase. Seven metrics, a recomputed one-channel example with payback, and what to track.
Read more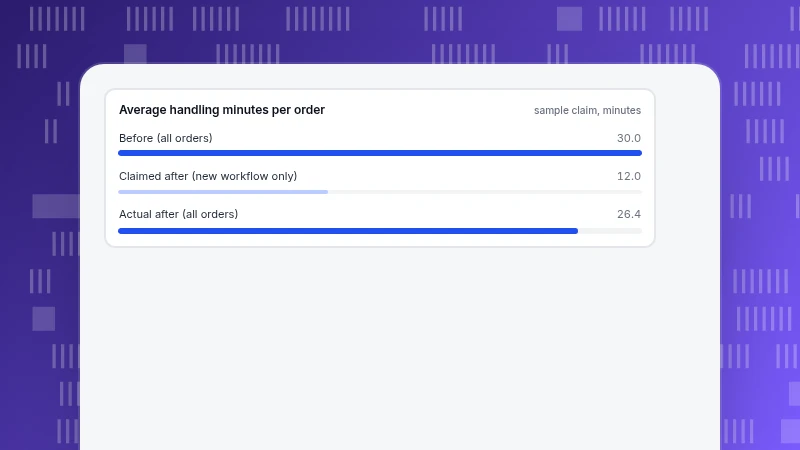
Digital Transformation Case Studies: What the Successful Ones Share
Successful digital transformations fix the metric first. What research says they share, six checks for reading any case study, a recomputed sample claim and a metric card to set before you start.
Read more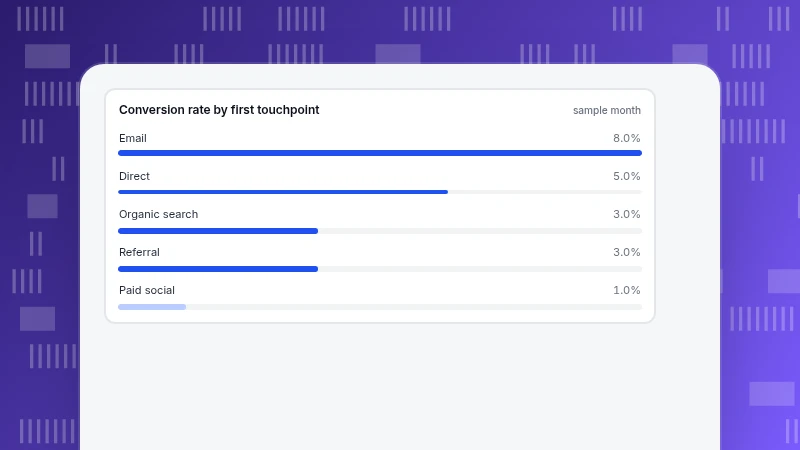
Customer Journey Touchpoints: How to List Them by Stage and Measure Each One
List customer journey touchpoints by stage, say how each is measured, then compare reach and conversion to find where people drop. Inventory steps and a worked month.
Read more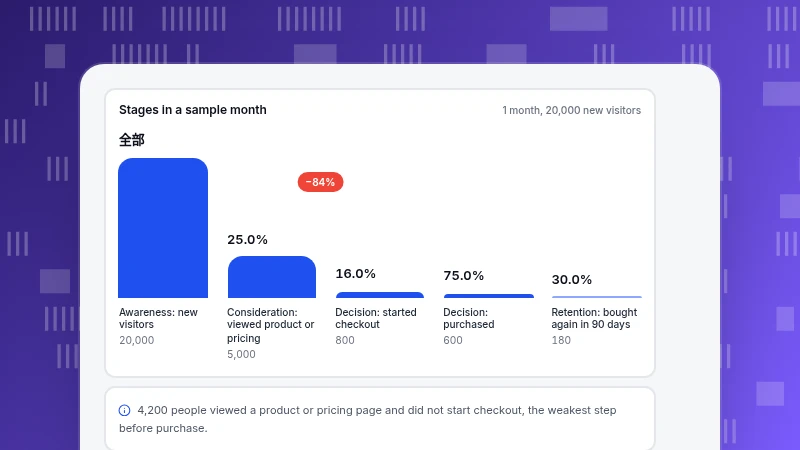
Customer Journey Stages: What to Measure at Each One
The five customer journey stages (awareness, consideration, decision, retention, advocacy) each need a different metric. Entry rules, a stage-by-metric table and a worked month.
Read more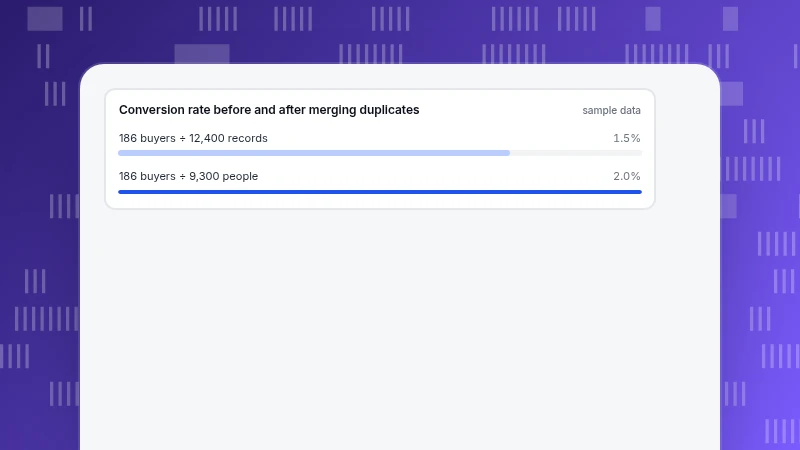
Customer Relationship Management Strategy: Decide the Data Before the Tool
A CRM strategy starts with data decisions: who counts as a customer, what counts as an interaction and who owns each stage. Steps, a worked example with duplicates and four illustrative patterns.
Read more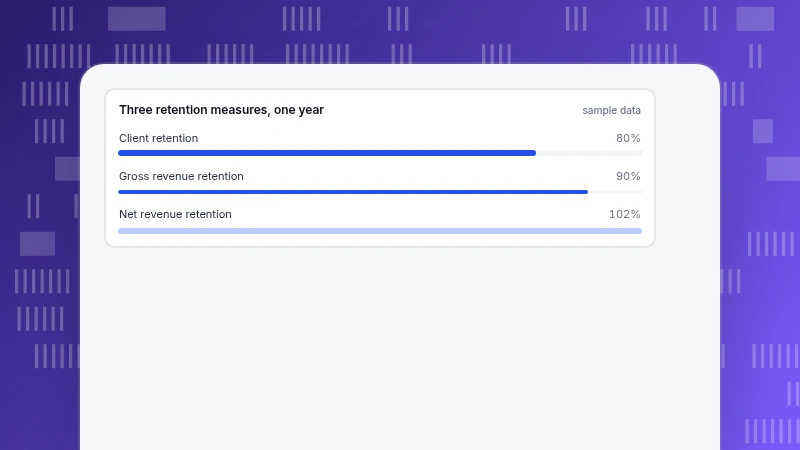
Client Retention: Three Habits That Keep Clients (With the Numbers)
Client retention rests on early success, ongoing value and timely warning. Formulas for client and revenue retention, a lifetime-value comparison and a back-test of warning signals.
Read more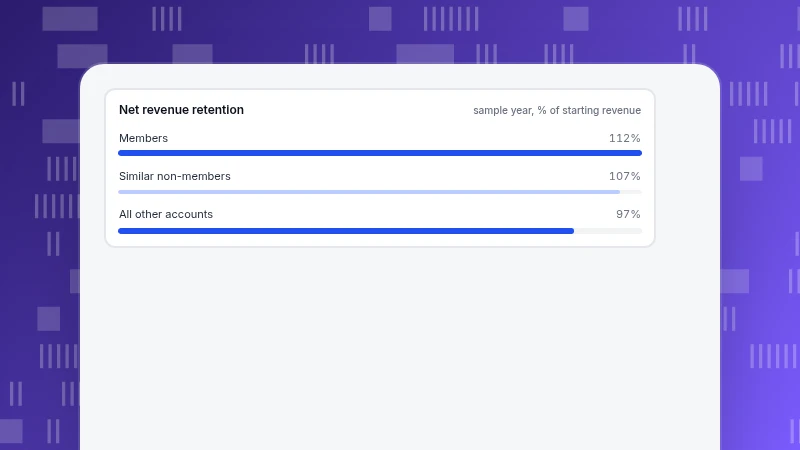
B2B Loyalty Programs: Types, Metrics and Why Renewal Beats Points
B2B loyalty programs work through renewal and expansion, not points. Seven program types, the metrics that show whether they work (NRR, GRR, logo retention), a design checklist and a fair way to compare members with non-members.
Read more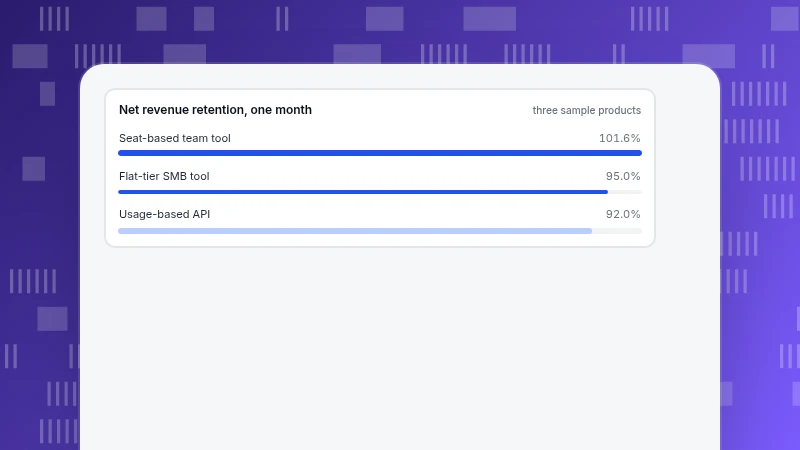
SaaS Examples: Types, Billing Models and the Metric Each One Needs
SaaS examples sorted by who they serve and how they charge, with ten category archetypes (no brand names) and a worked retention example showing why each billing model needs a different metric.
Read more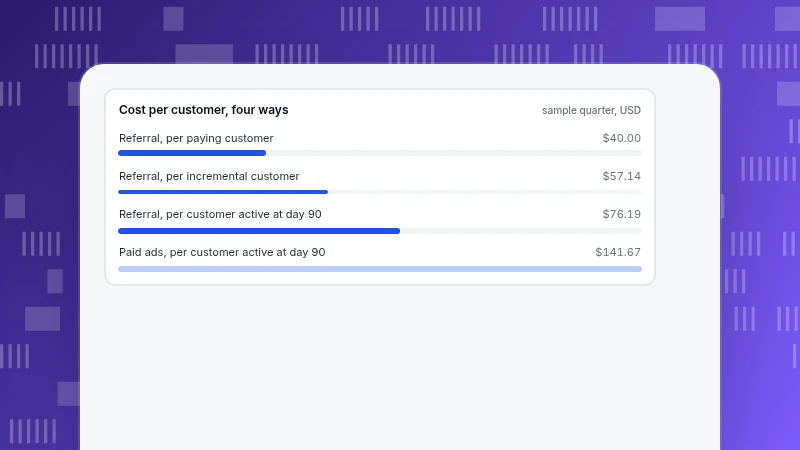
Referral Marketing: How to Run and Measure a Referral Program
Referral marketing means existing customers bring in new ones. Learn the five-step loop, the metrics for each step, a recomputed worked example of cost per retained customer, reward rules and common mistakes.
Read more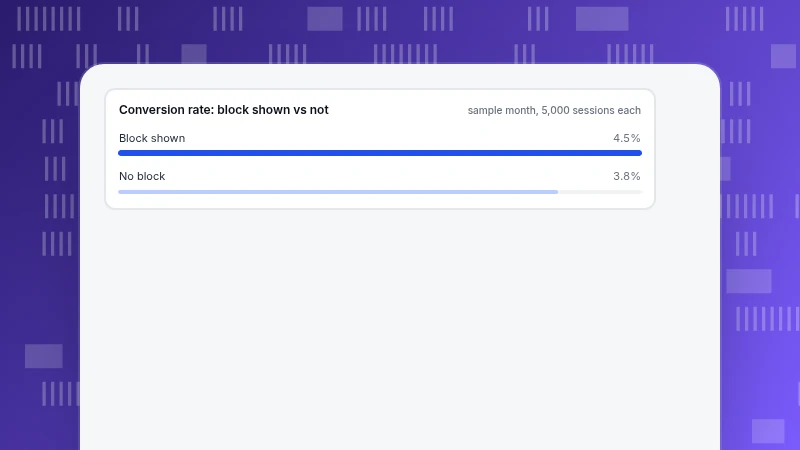
Personalized Shopping Experience: Layers, Data and How to Measure It
A personalized shopping experience changes what a store shows based on what each shopper has done. Learn the three layers, the data each needs, a worked test with significance, and where privacy limits apply.
Read more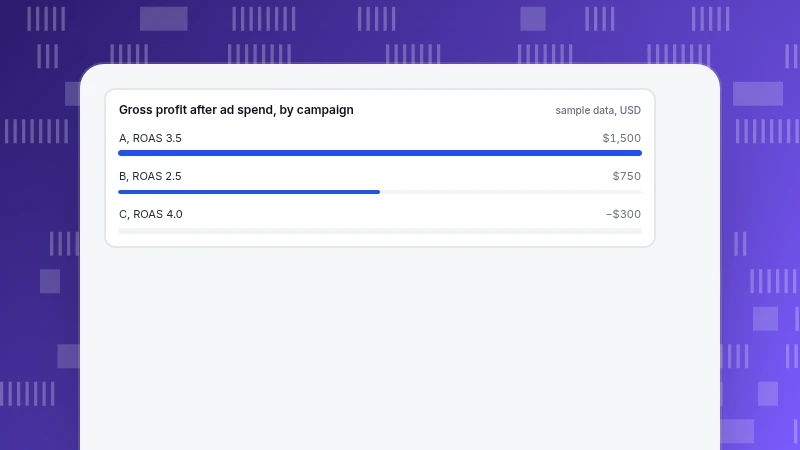
How to Calculate ROAS: Formula, Break-Even and a Worked Example
How to calculate ROAS (revenue from ads ÷ ad spend) and how to tell whether it makes money: break-even ROAS from gross margin, three campaigns where the highest ROAS loses money, and platform vs blended ROAS.
Read more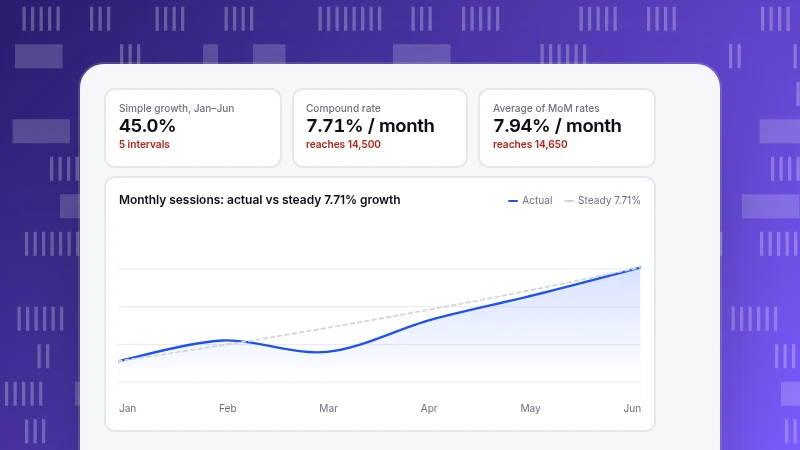
How to Calculate Growth Rate: Simple, Average and Compound
How to calculate growth rate three ways on the same six months of data: simple, average of monthly rates and compound, with a check that shows why the average overstates growth, plus MoM vs YoY and annualizing.
Read more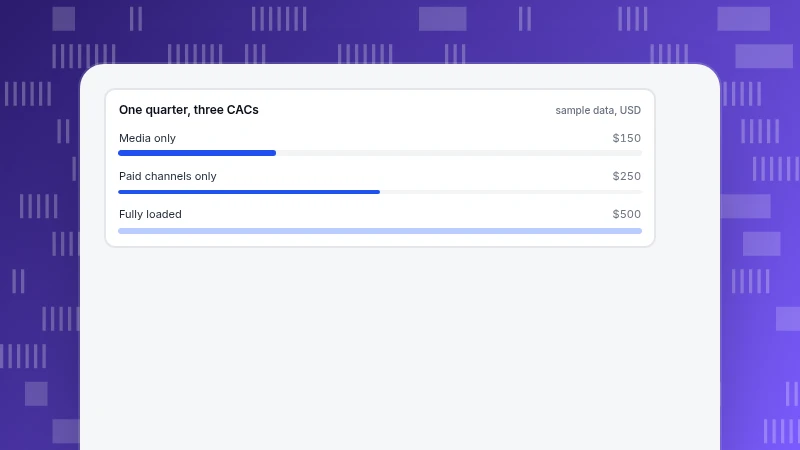
CAC Formula: How to Calculate Customer Acquisition Cost
The CAC formula (acquisition cost ÷ new customers) and how to apply it honestly: paid, blended and fully loaded versions, which costs to include, one quarter that gives $150, $250 or $500, and how to pair CAC with LTV and payback.
Read more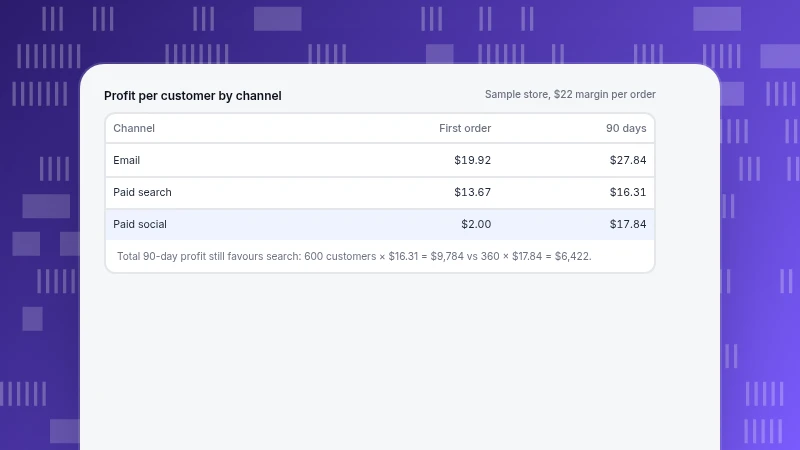
B2C Marketing: Channels, Metrics and Repeat Purchase
What B2C marketing is, how it differs from B2B, and the numbers that decide it: cost per customer by channel, repeat rate and the right measurement window, with a worked three-channel example.
Read more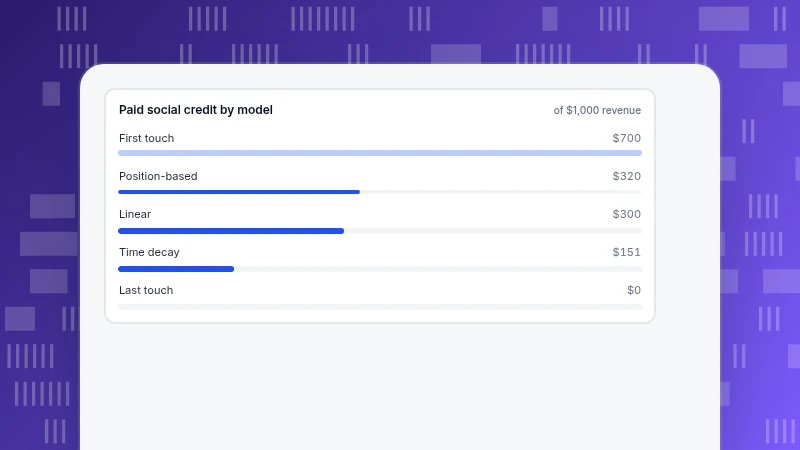
Attribution Models: Types, Differences and How to Choose
What attribution models are, how first touch, last touch, linear, position-based, time decay and data-driven split credit, and a worked example where the same ten conversions give paid social $700 or $0.
Read more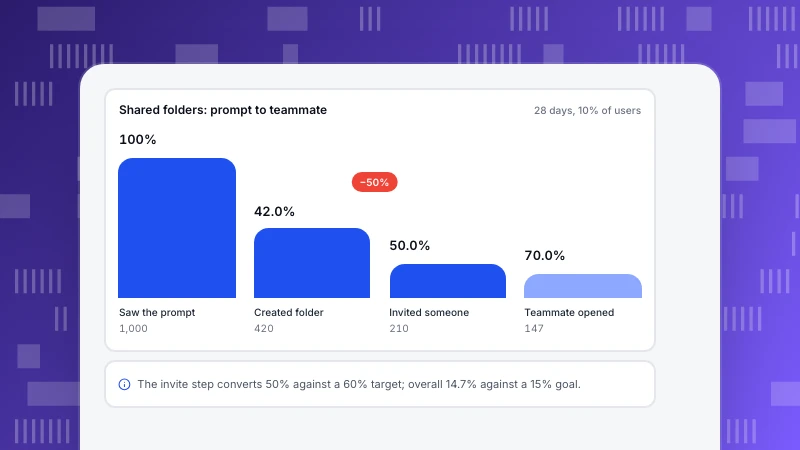
Product development examples: the data behind each decision, stage by stage
Product development examples are most useful when they show which number drove each decision. One sample product followed from discovery to review, with a baseline, a guardrail, a launch funnel and a margin of error.
Read more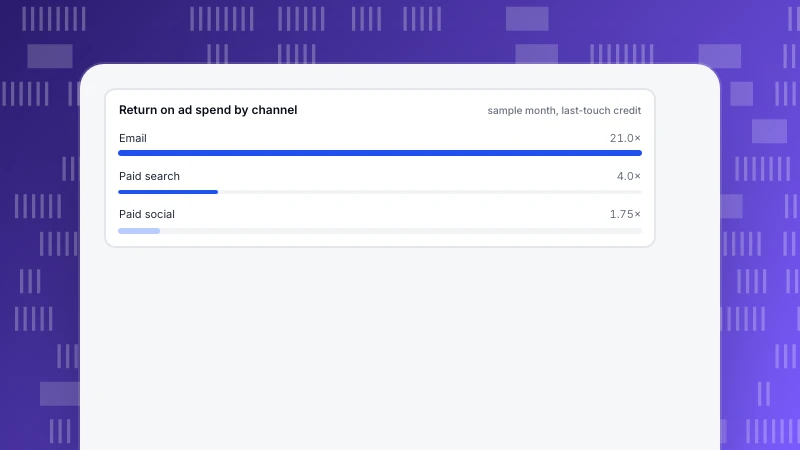
What Is Marketing Analytics? Connecting Spend to Results
Marketing analytics answers one question: where did the money go and what did it bring back? A four-layer build order, the eight metrics to start with and a three-channel example that applies gross margin.
Read more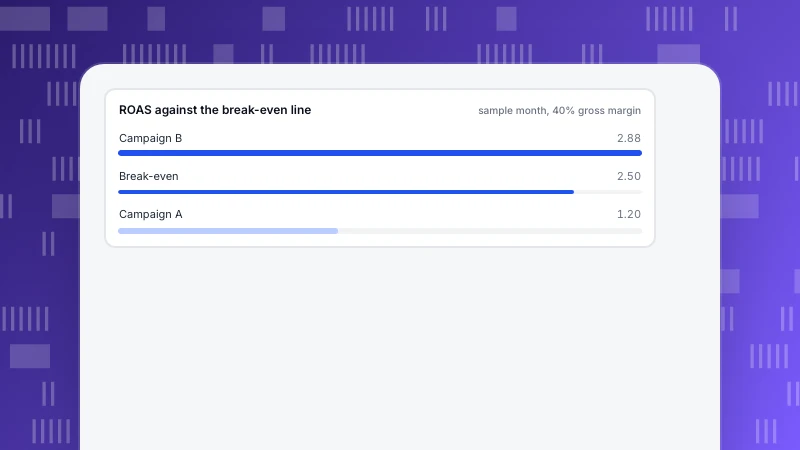
KPI for Advertising: Reach, Action and Result Metrics
Advertising KPIs sort into three layers: reach, action and result. Use the top layer to diagnose and the bottom layer to decide, with formulas and an example where two campaigns disagree.
Read more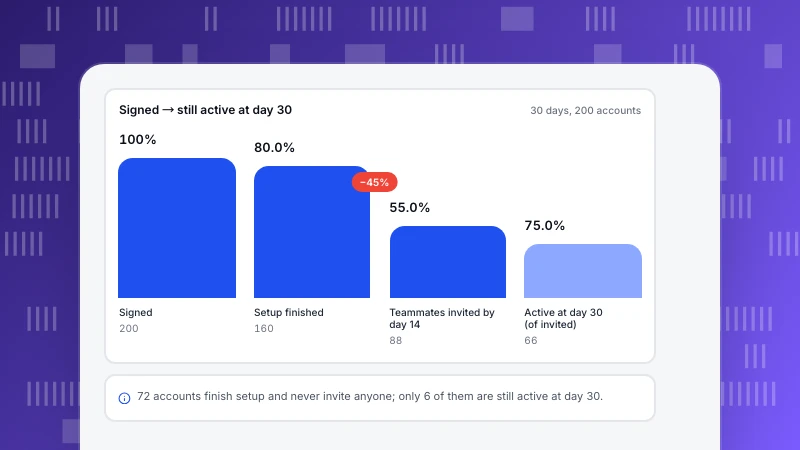
Customer onboarding system: guidance, data and people, and how to measure it
A customer onboarding system has three blocks: guidance, data and people. How to choose milestones, test them on an account funnel, report time to value as a median and decide when a person should step in.
Read more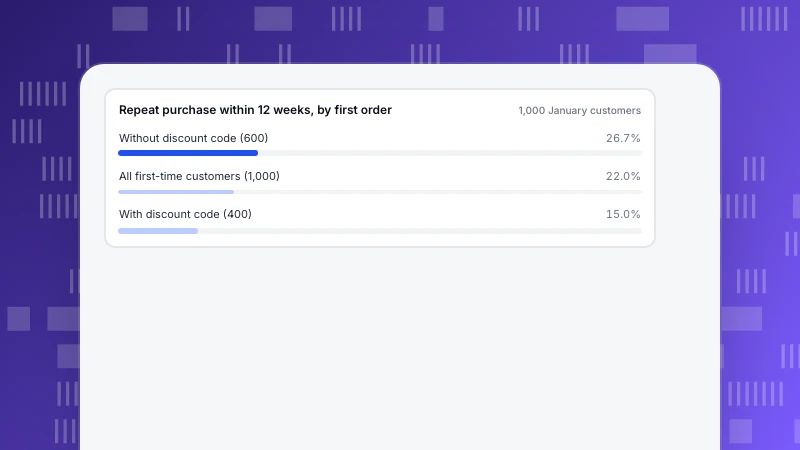
Consumer behavior examples: eight behaviors and the trace each leaves in your data
Eight consumer behavior examples, from comparison shopping to repeat purchase, with the signal each leaves in analytics, two worked examples you can recompute and rules for checking a pattern is real.
Read more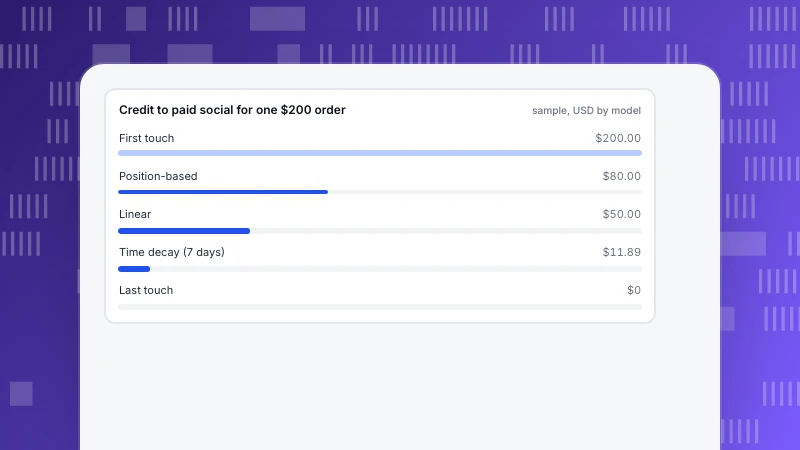
What Is Attribution? Models, a Worked Example and How to Choose
Attribution decides which touchpoint gets credit for a conversion. The five common models, one four-touch order scored under all of them, and how to choose a model for your decision.
Read more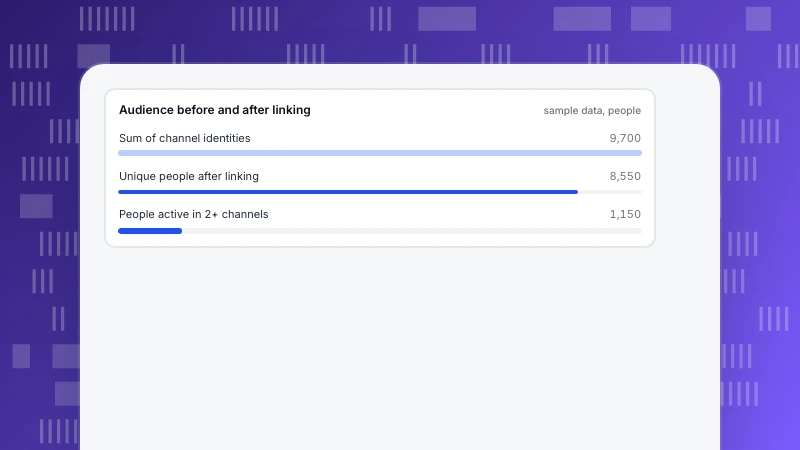
Omnichannel Engagement: What It Is and How to Measure It
Omnichannel engagement means each interaction continues from the last across web, app and chat. Multichannel vs omnichannel, three metrics, a worked example you can recompute and how to connect identity.
Read more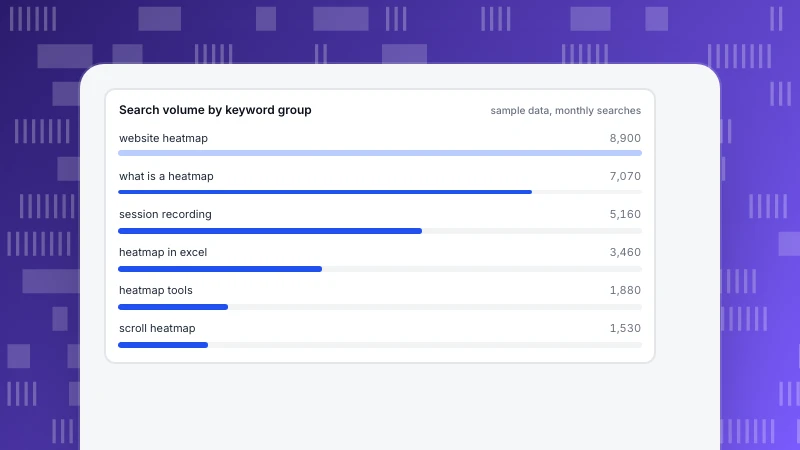
Keyword Grouping: How to Group Keywords by Search Intent
Keyword grouping sorts search terms into sets that one page can serve. Why intent beats wording, three methods, four steps and a 20-term example grouped by SERP overlap that you can recompute.
Read more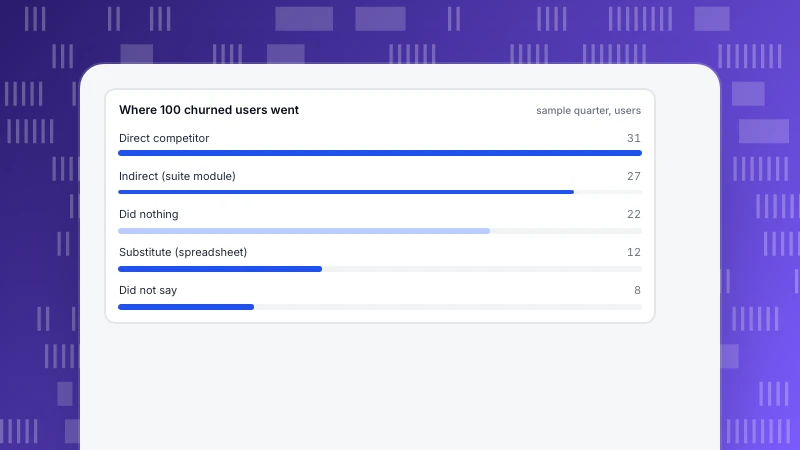
Direct vs Indirect Competition: How to Tell Them Apart and Find Yours
Direct competitors sell the same thing; indirect competitors solve the same problem differently. Definitions, four questions that find both, and a 100-churned-user example showing direct rivals explain only a third of departures.
Read more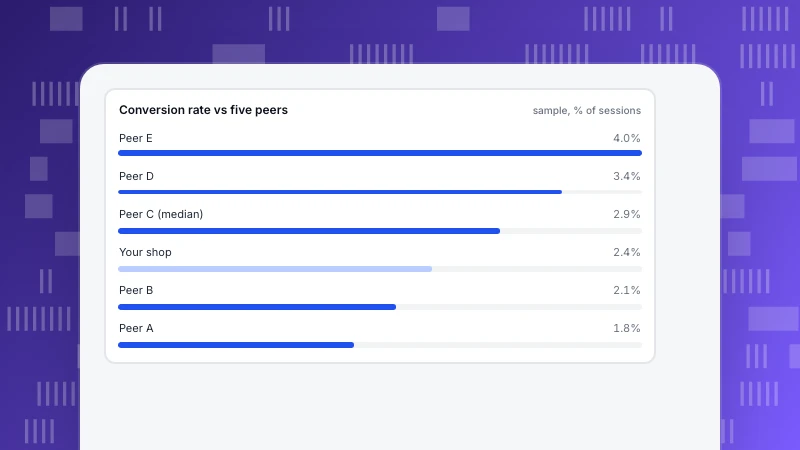
Competitor Benchmarking: How to Compare Fairly with Public Data
Competitor benchmarking finds which metrics are worth working on, using only public, comparable, same-definition data. Four steps, sources that qualify, and a worked example where a 17% gap vanishes after matching traffic mix.
Read more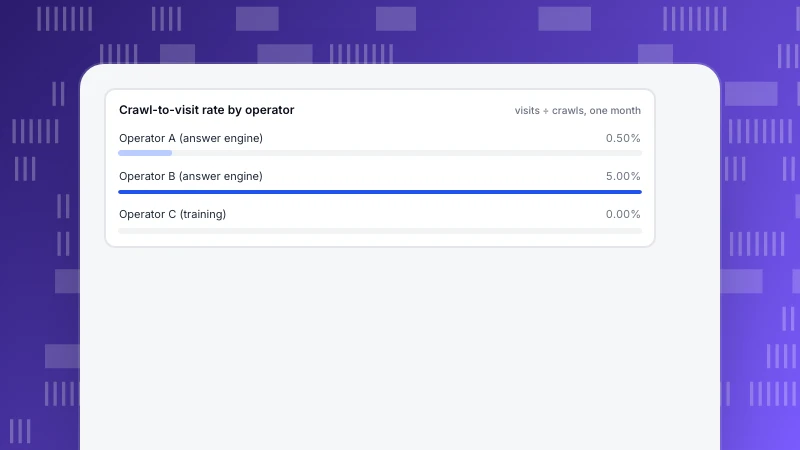
AI Visibility Audit: A Five-Step Checklist You Can Repeat
How to run an AI visibility audit as a checklist rather than a score: crawler access, llms.txt, crawler logs, what assistants cite and what the visits convert to, with worked examples and a full checklist table.
Read more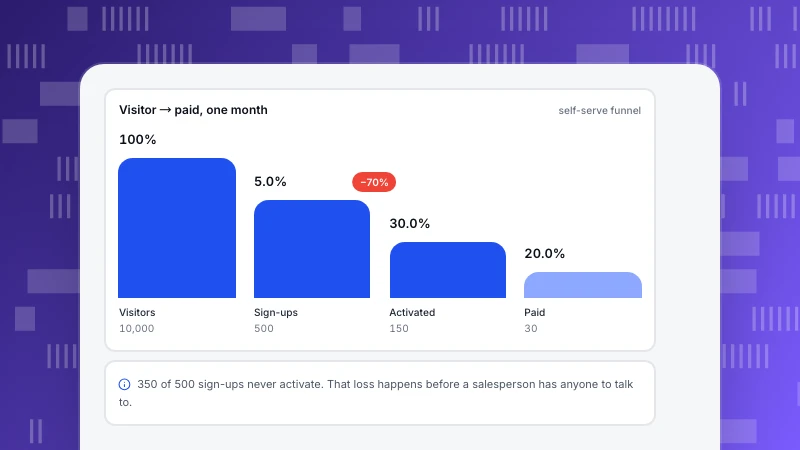
SaaS Sales Funnel: Put the Trial in the Middle and Read Each Stage
A SaaS sales funnel runs visitor, sign-up, activated, paid, with the trial in the middle. A worked 10,000 → 30 example, why one total conversion rate hides problems, how to define stages, and where self-serve hands off to sales.
Read more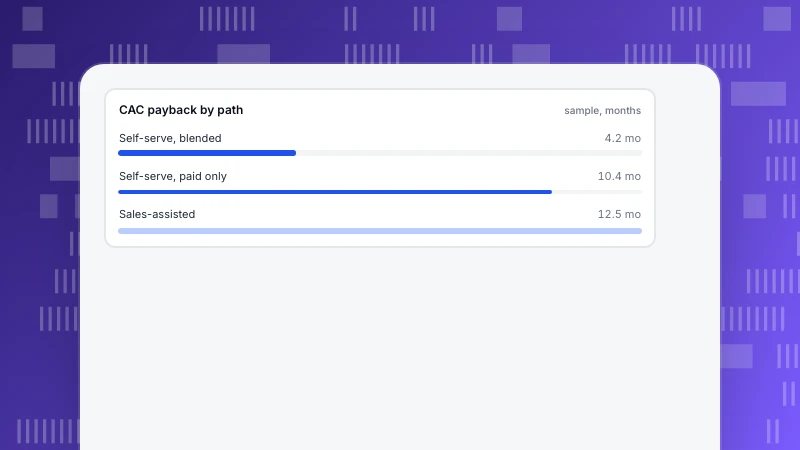
SaaS Go-to-Market Strategy: Choose One Path, Then Prove It Works
A SaaS go-to-market strategy has to decide who buys, what you offer, the price, one primary path and the proof. Self-serve, sales-assisted and channel compared, with a CAC payback example and three numbers to validate the path.
Read more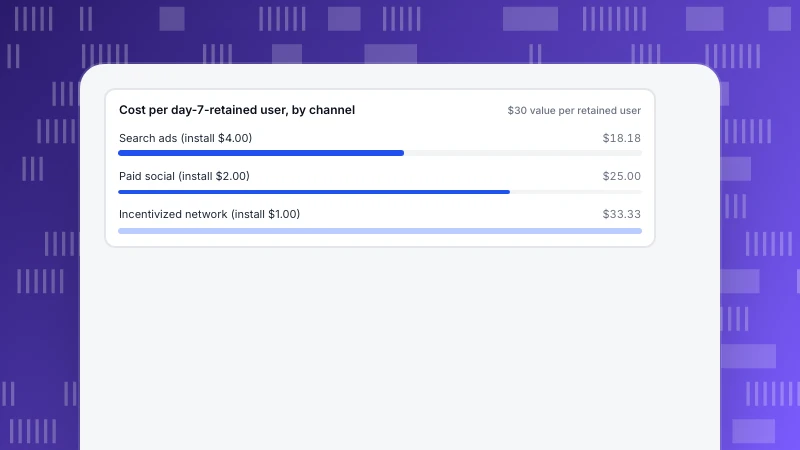
Mobile User Acquisition Strategy: Price Channels by Retained Users
A mobile user acquisition strategy should price channels by the users who stay, not the installs they deliver. A three-channel example shows install cost and cost per retained user ranking channels in exactly opposite orders.
Read moreOther categories
Each category answers a recurring question we hear from customers. Start with the one closest to your job.
Analytics
Definitions, funnels, retention and the data-quality questions behind every number.
304 articlesLive Chat
Proactive invites, translation and turning support conversations into conversions.
78 articlesAI Search
GPTBot, ClaudeBot, PerplexityBot: who fetches your pages, what the files say and what comes back.
39 articlesProduct News
What shipped, why we built it that way, and how to turn it on.
64 articles