Try it on your own data
Every report in this article is in the free plan. One snippet for web and apps, up to 10 sites.
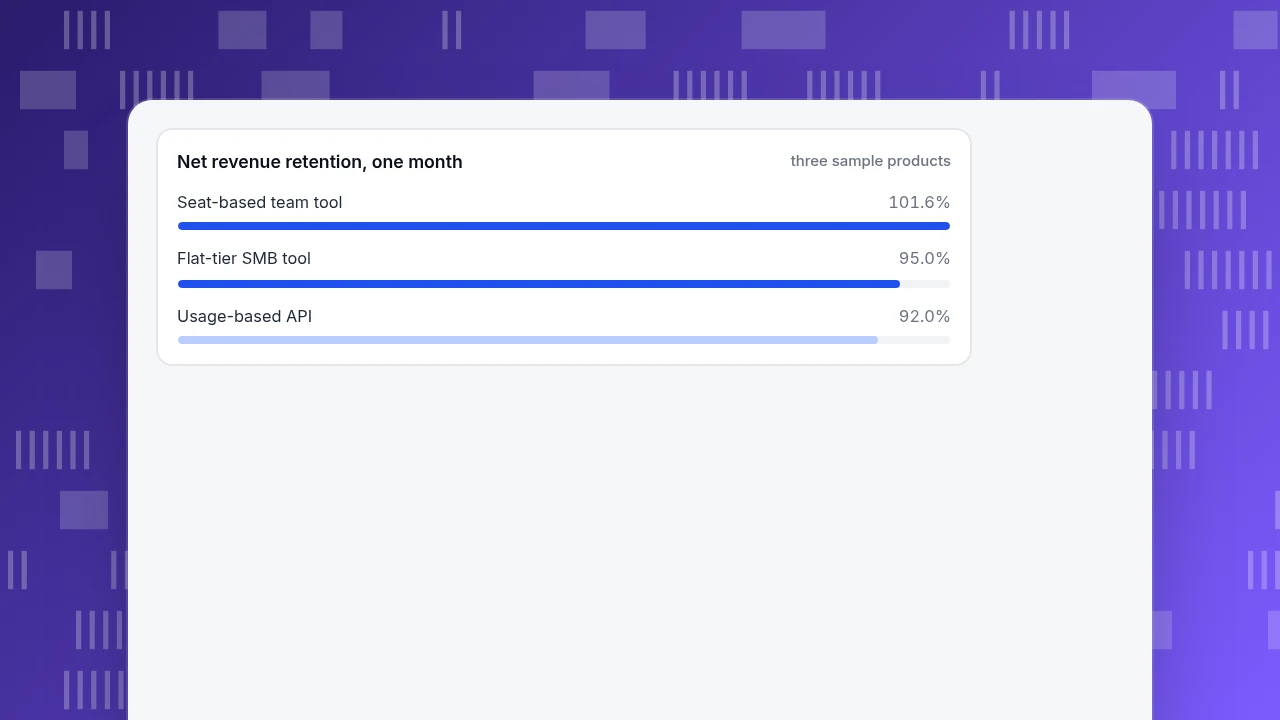
Start freeSaaS examples fall into categories such as team chat, CRM, accounting, e-signature, help desk, analytics and developer APIs, and each can be classified by who it serves and how it charges. The billing model matters most, because it decides where revenue grows and where it leaks. In the sample below, one retention formula gives 101.6% for a seat-based tool, 92.0% for a usage-based API and 95.0% for a flat-tier tool.
What you will learn
- Classify SaaS by audience (horizontal or vertical, business or consumer) and by billing model (seat, usage, tier, freemium, hybrid)
- The metric follows the billing model: seat activation, usage per account or churn by plan
- Read net and gross revenue retention together; expansion can hide losses
What counts as SaaS?
SaaS (software as a service) is software you use through a browser or app while the provider runs and updates it on their own infrastructure. The US standards body NIST defines the service model as the consumer using the provider's applications running on a cloud infrastructure, reached through a thin client such as a web browser, without managing the underlying servers, storage or application code. A few quick tests tell SaaS from its neighbours:
| If you... | It is probably | Example of the kind of thing |
|---|---|---|
| Log in and use finished software; the provider handles servers, updates and security | SaaS | A shared spreadsheet, an invoicing tool |
| Deploy your own application onto a provider's platform | Platform as a service (PaaS) | A managed runtime for your code |
| Rent raw servers, storage or networks | Infrastructure as a service (IaaS) | Virtual machines |
| Buy a licence once and install it yourself | Traditional software | A desktop program installed from a disk image |
One point of confusion: a product can be offered as SaaS and still expose an API. What makes it SaaS is that the provider operates the application, not whether it has a browser interface. This guide lists categories and archetypes rather than company names, because the useful question is not "who has a SaaS product" but "what kind of SaaS is mine, and which numbers does that kind live by".
How do you classify SaaS by who it serves?
Three splits cover most of the variation.
- Horizontal or vertical. Horizontal tools serve any company, such as team chat or invoicing. Vertical tools serve one industry, such as scheduling software for dental practices or property-management software. Vertical products usually have fewer potential customers but stronger fit and higher willingness to pay.
- Business, consumer or both. Most SaaS sells to businesses. Consumer subscriptions (a language-learning app, a photo-storage plan) look like SaaS but behave like B2C marketing: many buyers, short decisions, monthly price in the tens of dollars.
- Small business, mid-market or enterprise. Small customers buy with a card in minutes and leave just as fast. Enterprise customers go through security review and contracts, take months to close and rarely cancel mid-term.
The audience tells you the sales motion. It does not tell you the metric to watch. For that, the billing model matters more.
How do you classify SaaS by billing model?
How a product charges decides what growth and risk look like. Five common models:
| Billing model | You pay for | Revenue grows when | Main risk | Number to watch |
|---|---|---|---|---|
| Per seat | Each user | A customer adds people | Paid seats that nobody uses | Seat activation |
| Usage-based | Calls, messages, gigabytes | Customers use more | Volume drops hit revenue directly | Usage per account |
| Flat tiers | A plan with set limits | Customers move up a tier | Customers cancel at the lowest tier | Churn by plan |
| Freemium | Nothing at first; paid upgrade | Free users convert | Free users never convert | Free-to-paid conversion |
| Hybrid | Base fee plus usage or add-ons | Both | Bills that surprise customers | Net revenue retention |
The metric you charge on is called the value metric: the unit that scales with the value the customer gets. See value metric for how to pick one. Seats are easy to bill but poorly track value when one person does all the work; usage tracks value but makes revenue volatile.
| Billing model | Revenue grows when | Number to watch |
|---|---|---|
| Per seat | A customer adds people | Seat activation |
| Usage-based | Customers use more | Usage per account |
| Flat tiers | Customers move up a tier | Churn by plan |
| Freemium | Free users convert | Free-to-paid conversion |
| Hybrid | Both | Net revenue retention |
Choose the number that moves before the invoice does.
What are examples of SaaS by category?
Here are ten categories, each shown as an archetype with the audience, the usual billing and the number it lives by. No brands are named on purpose; you will recognise your own market in them.
| Category | What it does | Typical buyer | Usual billing | Number it lives by |
|---|---|---|---|---|
| Team chat and collaboration | Messages, channels, shared files | Any team | Per seat | Seat activation |
| Customer relationship management | Tracks leads and customers | Sales teams | Per seat, tiers | Pipeline created per seat |
| Accounting and invoicing | Invoices, expenses, reports | Small business, accountants | Flat tiers | Churn by plan |
| E-signature and documents | Send and sign documents | Any business | Tiers by volume | Documents sent per account |
| Help desk and live chat | Handles support conversations | Support teams | Per agent | Agent utilisation, resolution rate |
| Analytics and BI | Reports on business data | Marketing and product teams | Tiers by tracked volume | Weekly active viewers |
| Project and work management | Tasks and plans | Teams | Per seat, freemium | Free-to-paid conversion |
| HR and payroll | Employee records, pay | Mid-size business | Per employee per month | Gross revenue retention |
| Payments and communications APIs | Programmable money or messages | Developers | Usage-based | Usage per account |
| Vertical software | Runs one industry's daily work | One industry | Flat tiers or per location | Logo churn |
Notice that the same category can use different billing. A help desk can charge per agent or by conversation volume; each choice leads to a different number to watch.
Which metrics matter for each type?
Every SaaS reports monthly recurring revenue (MRR). The more telling number is net revenue retention (NRR), and it tells a different story depending on the billing model. The formula for a month, over customers who existed at the start:
NRR = (starting MRR + expansion − contraction − churned MRR) ÷ starting MRR
Gross revenue retention (GRR) leaves expansion out: (starting MRR − contraction − churned MRR) ÷ starting MRR. Definitions are in net revenue retention and gross revenue retention.
Sample data: three products in one month.
| Seat-based team tool | Usage-based API | Flat-tier small-business tool | |
|---|---|---|---|
| Customers | 200 | 150 | 600 |
| Starting MRR | 200 × 12 seats × $8 = $19,200 | 150 × $100 average = $15,000 | 600 × $29 = $17,400 |
| Expansion | +$1,300 (added seats) | +$2,400 (higher volume) | +$580 (tier upgrades) |
| Contraction | −$400 (removed seats) | −$3,100 (lower volume) | −$290 (downgrades) |
| Churned MRR | −$600 | −$500 | −$1,160 (40 customers × $29) |
| Ending MRR (same customers) | $19,500 | $13,800 | $16,530 |
| NRR | 101.6% | 92.0% | 95.0% |
| GRR | 94.8% | 76.0% | 91.7% |
The same formula tells three different stories:
- Seat-based: NRR above 100% comes from added seats. The hidden risk is idle seats. If only 70% of paid seats were active in the last 30 days, then 30% × 12 seats × 200 customers × $8 = $5,760 of MRR pays for seats nobody opens, and that is the revenue most likely to contract at renewal.
- Usage-based: churn is only $500, but contraction is $3,100. The loss is customers using less, which monthly cancellation counts never show. GRR of 76.0% is the number to look at.
- Flat-tier: almost no expansion, so everything depends on keeping customers. 40 of 600 customers left: 40 ÷ 600 = 6.7% customer churn in one month, enough to dominate everything else.
The general rule: choose the metric that matches where your revenue can leak. For the full set of SaaS numbers and what each is for, see SaaS metrics; for the smaller set early-stage companies need, see startup metrics.
Net revenue retention, one month
three sample productsHow do you pick the right metric for your product?
Work through three questions and write down the answers.
- How do customers pay? The billing table above gives the first candidate: seat activation for seats, usage per account for usage, churn by plan for tiers.
- What would a customer do before they cancel? Seat products: stop logging in. Usage products: send fewer calls. Tier products: downgrade first. The metric should show that behaviour before the invoice does.
- Can you act on it within a month? A metric that only moves quarterly is a report, not a control. Prefer one a team can change by changing onboarding, pricing or support.
Rule of thumb: if the metric would look fine while customers are quietly leaving, it is the wrong metric. In the sample, an MRR of $19,500 looks healthy while $5,760 sits in idle seats.
How growth decisions follow from these numbers is covered in SaaS growth strategy.
Common mistakes when studying SaaS examples
- Copying another product's metric. A usage-based business that tracks seats will miss its real leak; the metric follows the billing model, not the industry.
- Reading NRR without GRR. In the seat-based sample, NRR of 101.6% hides a GRR of 94.8%: expansion covered 5.2% of revenue that was lost.
- Counting MRR from trials or one-off fees. MRR is recurring revenue only. Setup fees and unpaid trials do not belong in it.
- Treating every account as equal. A customer paying $2,000 a month and one paying $8 are not the same retention problem.
- Judging a vertical product by horizontal benchmarks. Customers in one industry share the same workflow, so churn and expansion do not compare with generic tools.
- Watching revenue and ignoring adoption. Money arrives for months after a customer has stopped using the product; usage drops first.
How to measure a SaaS product in TapCub
Suppose you run the seat-based tool from the example and want to know where the $5,760 sits. Your billing system stays the source of truth for MRR and invoices; TapCub measures how the product is used and ties it to accounts. TapCub does not bill customers or collect payments.
- Install the SaaS pack. In All-platform analytics › Business › Industry packs, install the B2B / SaaS pack. It sets up event definitions, metrics such as new MRR, upgrade MRR, churned MRR and subscription churn rate, funnels from sign-up to activation and trial to paid, and SaaS dashboards. You still send the events yourself; send subscription amounts from the server.
- Attach people to accounts. After login, call
tapcub.group('company', 'acme', {...})so each user's events belong to a company. Under All-platform analytics › Users › Accounts you see account counts, 30-day active accounts, members and a health score from 0 to 100 (share of members active in the last 30 days, share of active days, and whether they appeared in the last 7 or 30 days). - Find idle seats. Compare members per account with members who used a feature in the last 30 days, which is what the health score is built from. The accounts with many members and low activity are your idle-seat list. TapCub counts members who appeared, not paid seats, so take the paid-seat count from your billing system. Account view is an organisation view, so it does not open individual people.
- Check retention and adoption. In All-platform analytics › Behavior › Behavior analysis, use retention for returning use and the funnel for sign-up to activation to see where customers stall.
- Act outside TapCub. TapCub measures; it does not email customers, change plans or collect payments. Take the idle-account list to your success team.
FAQ
What are examples of SaaS?
Common categories are team chat and collaboration, customer relationship management, accounting and invoicing, e-signature, help desk and live chat, analytics, project management, HR and payroll, payments and messaging APIs, and vertical software for a single industry. They differ in who buys them and how they charge.
What are the main types of SaaS?
By audience: horizontal or vertical, business or consumer, small business or enterprise. By billing: per seat, usage-based, flat tiers, freemium or hybrid. Billing is the split that most changes which metrics matter, because it decides where revenue grows and where it can leak.
What is the difference between SaaS, PaaS and IaaS?
With SaaS you use finished software run by the provider. With PaaS you deploy your own application onto a provider's platform. With IaaS you rent raw computing, storage and networking. The more you manage yourself, the further you are from SaaS; NIST's cloud definition describes all three service models.
What are SaaS products?
SaaS products are applications delivered over the internet on a subscription or usage basis, run and updated by the provider. Customers do not install or maintain servers. Examples range from consumer subscriptions to developer APIs; what they share is that the provider operates the application.
Which SaaS metrics should I track first?
Start with MRR and its movement (new, expansion, contraction, churned), then net and gross revenue retention, then one adoption number that matches your billing model: seat activation, usage per account or churn by plan. The adoption number moves before revenue does.
Sources
- National Institute of Standards and Technology. The NIST Definition of Cloud Computing, SP 800-145 — definitions of the three service models and the essential characteristics of cloud services. Checked 2026-11-19.
- National Institute of Standards and Technology. Cloud Computing Synopsis and Recommendations, SP 800-146 — overview of the SaaS, PaaS and IaaS service models and their trade-offs. Checked 2026-11-19.
Was this article helpful?
We use your answers to fix and expand this page.
Couldn’t send. Please try again in a minute.
Thanks for the feedback. We’ll use it to improve this page.You’ve already sent feedback on this page. Thanks.

Product Experience Specialist
Explores usability, user journeys, and feature adoption through practical examples of onboarding and everyday product use.