Try it on your own data
Every report in this article is in the free plan. One snippet for web and apps, up to 10 sites.
Start freeThe most useful product development examples show which data drove each decision, not the story. Following one sample product through discover, define, build, launch and review, you need usage counts to find the problem, a baseline and guardrail to define success, agreed events to build, a step funnel to launch and a margin of error to review.
What you will learn
- Each of the five stages ends in a decision that one kind of number supports: usage counts, a target, agreed events, a funnel, a result with its margin
- Set the target and guardrail before launch; in the sample, 14.7% against a 15% target is inside the ±2.2-point margin, so it is not a miss or a win
- A step funnel shows where to fix: the invite step at 50% against a 60% target, and it only needs 51.0% to reach the goal
The five stages and the data each one uses
Most product development models use the same shape with different names. The Design Council's Double Diamond calls the stages discover, define, develop and deliver; the UK government's service manual uses discovery, alpha, beta and live. This article uses five working stages that split launch from review, because the data and the decision are different in each: discover, define, build, launch and review.
| Stage | The decision | Data you need | Example measure (sample) |
|---|---|---|---|
| Discover | Which problem is worth solving? | How many users hit it, how often, what they do instead | 18% of active users share a note by link; 40 of 600 conversations ask for team folders |
| Define | What counts as success? | Baseline, target, a guardrail, the group it applies to | At least 15% of exposed users get a teammate to open a shared folder in 28 days |
| Build | Will we be able to tell if it worked? | Events and properties agreed and arriving correctly | folder_created, folder_invited, folder_opened_by_teammate |
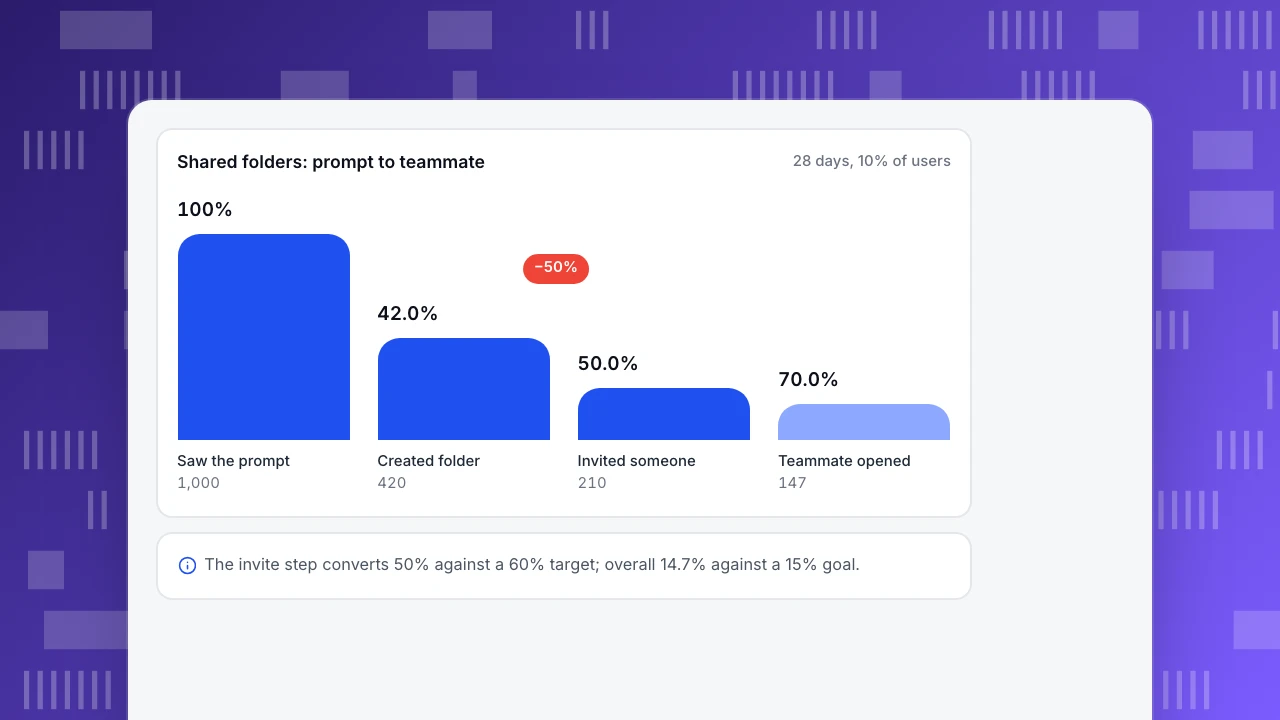
| Launch | Is the change reaching users and working? | Step-by-step funnel for the exposed group | 1,000 saw the prompt, 147 got a teammate in |
| Review | Keep, change or stop? | Result against the target and the guardrail, with a margin | 14.7% against 15%, margin ±2.2 points |
The examples below follow one invented product through all five. It is sample data, not a real company: a notes app with 10,000 monthly active users that is considering shared folders. The point of an example like this is not the story. It is that every stage ends in a decision that a number supports.
| Stage | The decision | Data you need | Example measure (sample) |
|---|---|---|---|
| Discover | Which problem is worth solving? | How many users hit it, how often, what they do instead | 18% of active users share by link; 40 of 600 conversations ask for team folders |
| Define | What counts as success? | Baseline, target, guardrail, group | At least 15% of exposed users get a teammate to open a shared folder in 28 days |
| Build | Will we be able to tell if it worked? | Agreed events and properties, arriving correctly | folder_created, folder_invited, folder_opened_by_teammate |
| Launch | Is the change reaching users and working? | Step funnel for the exposed group | 1,000 saw the prompt, 147 got a teammate in |
| Review | Keep, change or stop? | Result against target and guardrail, with a margin | 14.7% against 15%, margin ±2.2 points |
Sample data for one invented notes app; the five stages merge the Double Diamond and the GOV.UK phases with launch and review split apart.
Stage 1: discover, find a problem that shows up in data
Discovery turns a hunch into a measured problem. The team starts with two sources it already has: behavior in the product and what users say.
Sample data: in the last 28 days, 1,800 of 10,000 monthly active users (18.0%) shared a note by link. Of those, 1,116 (62.0%) shared again within 14 days. Separately, 40 of 600 support conversations (6.7%) asked for a way to share a whole set of notes with a team.
Read together, the two sources say that sharing is something a meaningful group does repeatedly, and that the current workaround, one link per note, is the thing people complain about. Neither number proves a shared folder is the right answer. That is what the next stage is for. Discovery here has done its job: it produced a problem with a size (18% of users, 62% repeating) and a voice (6.7% of conversations).
Rules of thumb for this stage:
- Count before you interview, then interview. Numbers tell you how many; conversations tell you why. Use both. Product discovery covers the interview side.
- Look for repeated behavior, not one-off behavior. The 62% repeat rate is more informative than the 18% reach.
- Write down the workaround. What users do today, such as a link per note or a spreadsheet, is your real competitor and the baseline you must beat.
Stage 2: define, turn the problem into a testable claim
A defined product bet has a claim, a target, a guardrail and a group. The claim is a product hypothesis: if we do this, this group will do that.
Sample data for the example: "If we ship shared folders, users who see the prompt will invite a teammate who opens the folder." That gives three conditions to measure, one per step of the path.
| Item | Value | Why |
|---|---|---|
| Group | 10% of monthly active users (1,000 users) | Small enough to roll back, large enough to read |
| Success metric | At least 15% of exposed users get a teammate to open a shared folder within 28 days | One number that covers the whole path |
| Step targets | Prompt to folder 40%, folder to invite 60%, invite to open 70% | 0.40 × 0.60 × 0.70 = 16.8%, above the 15% line with some margin |
| Guardrail | Notes created per active user must not fall more than 5% (baseline 6.2) | A feature that cannibalizes core use is not a win |
Two details matter. The targets and the guardrail are set before launch, so nobody can adjust the bar to fit the result. And the success metric is a behavior (a teammate opens the folder), not an output (the folder exists). Product validation explains how far this kind of evidence can take you.
Stage 3: build, make sure the measurement works before the feature does
Building is the stage where measurement is most often skipped and most often regretted. The feature can be perfect and still teach you nothing if the events are missing or wrong.
For the example, the team agrees three events and their properties before writing the feature code:
| Event | Fires when | Required properties |
|---|---|---|
folder_created | A user creates a shared folder | entry_point (prompt or menu), notes_count |
folder_invited | The creator sends an invitation | invitees_count |
folder_opened_by_teammate | An invited person opens it | days_since_invite |
Then a 200-user internal and beta test checks that each event arrives with its required properties, that the counts match what the testers did (12 testers created folders, 12 folder_created events), and that an unplanned event name does not slip in unnoticed. Fixing a missing property here costs an hour; fixing it after the launch costs the launch.
Two additions at this stage pay off later. Record the exposure: send a property on events that says whether the user was in the exposed group, or you cannot compare. And keep a record of the plan: who owns each event, what status it is in, so the next person knows what a number means.
Stage 4: launch, read the funnel step by step
A launch is a measurement exercise first and an announcement second. With the exposure group set to 10%, the team reads the funnel for 28 days.
Sample data: 1,000 exposed users, three steps.
| Step | Users | Step conversion | Target | Overall |
|---|---|---|---|---|
| Saw the prompt | 1,000 | n/a | n/a | 100.0% |
| Created a shared folder | 420 | 42.0% | 40% | 42.0% |
| Invited someone | 210 | 50.0% | 60% | 21.0% |
| A teammate opened it | 147 | 70.0% | 70% | 14.7% |
Recalculation: 1,000 × 42.0% = 420; 420 × 50.0% = 210; 210 × 70.0% = 147; 147 ÷ 1,000 = 14.7%. The funnel makes the finding specific. Prompt to folder beat its target (42% against 40%) and invite to open met it (70%). The one weak step is folder to invite, 50% against a 60% target. That is where half of the people who made a folder stopped.
The guardrail is read at the same time: notes created per active user went from 6.2 to 6.1, a 1.6% fall, inside the 5% limit.
Shared folders: prompt to teammate
28 days, 10% of usersSaw the prompt
1,000
Created folder
420
Invited someone
210
Teammate opened
147
Stage 5: review, decide with the margin in mind
Review compares the result with the bar that was set in stage 2. The raw result is 14.7% against 15%, which looks like a miss. But 147 of 1,000 is a sample, and a rate from 1,000 people has a margin of error. A normal-approximation 95% interval gives 14.7% ± 2.2 points, so 12.5% to 16.9%. The 15% target sits inside that range, so the data cannot say whether the real rate is above or below it.
What it can say:
- The overall result is borderline, and one step explains the gap. To reach 15% with the other steps unchanged, the invite step needs 0.15 ÷ (0.42 × 0.70) = 51.0%, against 50.0% today. A one-point change would cross the line, which is also well inside the noise.
- The guardrail holds. There is no sign yet that shared folders take away from note creation.
- The decision is to continue and fix the weak step, not to stop and not to ship to everyone. Move to 50% of users with a redesigned invite step (for example, inviting from the folder screen right after creation) and measure the same three steps again.
A tempting extra analysis is to compare retention of folder users with non-users. Be careful: people who invite teammates are usually more engaged to begin with, so the gap would mostly reflect who chose to use it. Self-selection bias shows how to check, and feature adoption and measuring product adoption cover the adoption measures in more depth.
Common mistakes in product development data
- Defining success after the data arrives. If the target was 15% and the result 14.7%, "good enough" is a decision, not a finding. Set the line first.
- Measuring the output, not the behavior. "Folders created" says the feature loaded; "a teammate opened it" says it worked.
- Skipping the baseline. Without 18% sharing and 6.2 notes per user before launch, no after-number means anything.
- Skipping the guardrail. A feature that lifts one number and quietly lowers another is not an improvement.
- Reading a rate without its margin. A 14.7% from 1,000 people is not distinguishable from 15%. Do not call it a failure or a win.
- Launching to everyone at once. Without a comparison group or a staged rollout, you cannot tell what the feature did from what the season did.
- Stopping at launch. The weak step (50% invite) only appeared because someone read the funnel.
Product development examples in TapCub
The example above can be reproduced step by step in TapCub, on web or app data.
- Discover. In All-platform analytics › Behavior › Behavior analysis, chart the share event's unique users against active users, and use Retention with that event as start and return to get the repeat rate. For the voice side, read recent conversations in Live chat › Inbox and tally topics by hand; TapCub does not count topics in conversations.
- Define. Write the claim and bar in your team's notes, then create the three events in All-platform analytics › Data › Tracking plan with an owner and status, so the plan matches what you intend to measure.
- Build. After the beta build ships, open the real-time validation (last 24 hours) in the tracking plan and check each event's arrivals and required-property completeness. New unplanned event names land in the Event inbox for you to claim.
- Launch. Build a funnel with the three events in Behavior analysis, with a 28-day window, and read step rate and the largest drop. On an app, App analytics › Users › Versions shows which version users are on, which helps when the rollout is by app release. TapCub has no feature flags and does not assign users to variants, so do the staged rollout in your own flag tool and send the exposure as an event property.
- Review. Read the funnel against the targets, check the guardrail metric as a custom metric or in event analysis, and keep a note of the margin. TapCub does not run experiments, so the review shows what happened in the exposed group, not what would have happened without the feature.
FAQ
What are the stages of product development?
Models differ in names, not in shape. The Double Diamond uses discover, define, develop and deliver; the UK government service manual uses discovery, alpha, beta and live. This article uses discover, define, build, launch and review, so that measuring the result is its own stage.
What is an example of product development?
A notes app considers shared folders. It finds 18% of users share notes and 40 of 600 conversations ask for team folders, sets a 15% success target with a guardrail, builds three events, launches to 10% and reads a three-step funnel. The data is sample data, shown step by step above.
What data do you need at each stage of product development?
Discovery needs usage counts and user requests; definition needs a baseline, target and guardrail; build needs agreed events; launch needs a step funnel for the exposed group; review needs the result against the target with a margin of error. Each stage ends in a decision.
How do you know whether a new feature worked?
Compare the result against a target and a guardrail set before launch, using a behavior rather than an output, and include the margin of error. If the groups are not comparable, treat differences with caution, because users who adopt a feature differ from users who do not.
See also: Product Design Process: Four Phases and the Data Each One Needs.
Sources
- Design Council. The Double Diamond, discover, define, develop and deliver.
- GOV.UK Service Manual. Agile delivery: phases of an agile project, discovery, alpha, beta, live.
- NIST/SEMATECH e-Handbook of Statistical Methods. 7.2.4.1 Confidence intervals.
Was this article helpful?
We use your answers to fix and expand this page.
Couldn’t send. Please try again in a minute.
Thanks for the feedback. We’ll use it to improve this page.You’ve already sent feedback on this page. Thanks.

Customer Experience Consultant
Writes about live chat, visitor conversations, and self-service, sharing practical ways to make customer communication clearer and more effective.