Try it on your own data
Every report in this article is in the free plan. One snippet for web and apps, up to 10 sites.
Start freeThe product design process is the sequence of finding a problem, defining success, building and testing a design, and delivering it, usually in four phases: Discover, Define, Develop and Deliver. Each phase should leave evidence behind: a funnel drop-off, a baseline, a test result, a post-launch comparison. Below: what to collect at each step.
What you will learn
- Give each phase one question, one piece of data and one decision it changes
- Write the brief with a baseline and a target before designing
- Judge the release against the baseline, comparing like with like
What is the product design process, and where does data belong in it?
The product design process is the set of steps a team follows to turn a problem into a product people can use: find the problem, decide what to build, make it, then check that it works. Most guides split it into four phases, which the UK Design Council's Double Diamond names Discover, Define, Develop and Deliver. The Design Council also notes that teams loop back to earlier phases as they learn, so treat the phases as questions you keep returning to, not as gates.
What most descriptions leave out is the evidence each phase should produce. A phase without evidence is a meeting. The table below gives each phase one question, the data that answers it and the decision that data changes.
| Phase | Question | Data that answers it | Decision it changes |
|---|---|---|---|
| Discover | Which problem is worth solving? | Funnel drop-offs, support questions, search terms, interview notes | Which problem goes into the brief |
| Define | What does success look like? | Baseline metric for that problem, target and deadline | Scope and the number you will judge the design by |
| Develop | Does the design work for people who have not seen it? | Prototype tests: task completion, errors, where people hesitate | Which version gets built |
| Deliver | Did the release move the number? | The same metric after launch, compared with the baseline | Keep, iterate or roll back |
The rest of this guide goes phase by phase, with one worked example that carries a single onboarding problem from discovery to measurement. The deeper discovery step has its own guide in product discovery; validating an idea before you build is in product validation.
Discover: use behaviour to pick the problem
Discovery is where teams most often start from opinion. The fix is to collect two kinds of evidence side by side: what people do (behaviour data) and what people say (interviews, support tickets, feedback).
Behaviour data tells you where the problem is. A funnel across your key path shows which step loses the most people. Support questions and interviews tell you why. Neither is enough alone: a drop-off with no explanation produces a guessed fix, and a loud complaint with no numbers may affect three people.
A simple discovery rule: a problem is ready for the brief when you can state it as "N% of people who reach step X do not reach step Y, and these are the reasons we heard." If you can only say the second half, you have an anecdote. If you can only say the first, you have a symptom.
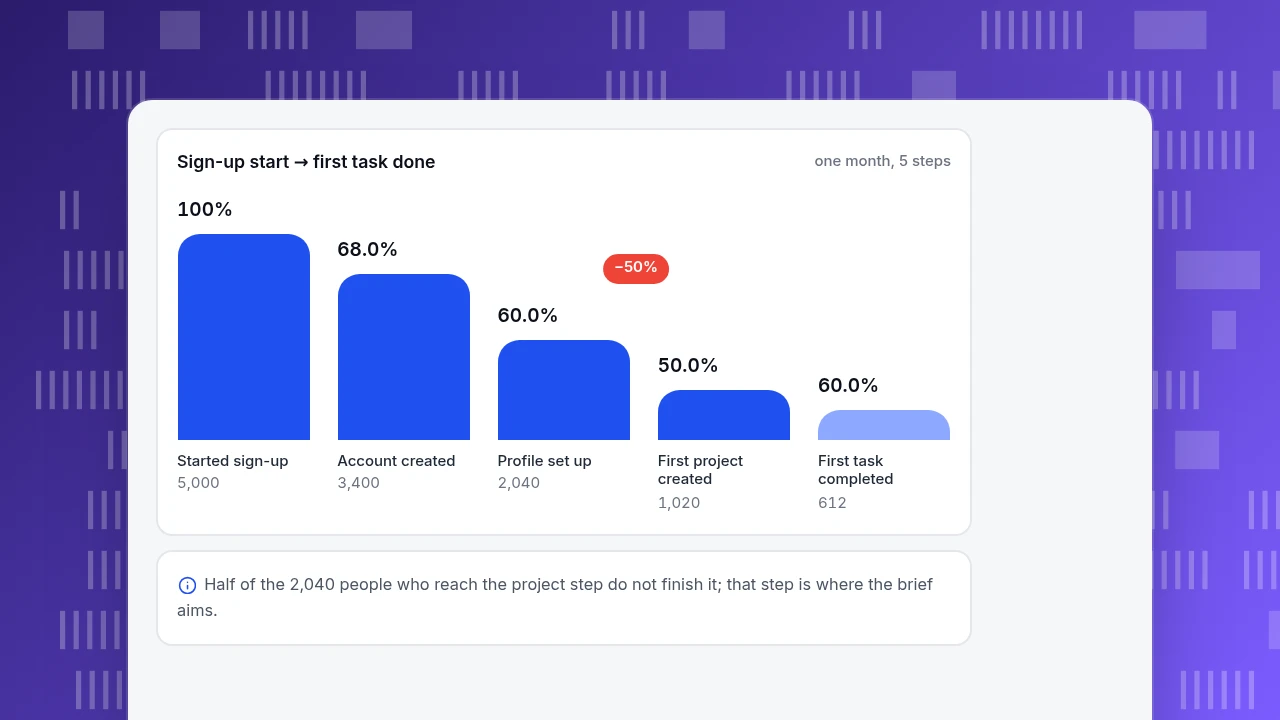
In the worked example later in this guide, discovery finds that of 5,000 people who start sign-up, 612 complete their first task: 12.2%. The biggest relative loss is at "first project created", where half of the people who reach it do not finish.
Define: turn the problem into a brief with a number
Definition is where you decide what you are not building. Write a one-page brief with four things:
- The problem statement, with the baseline number from discovery.
- The target: a metric, a size of change and a date ("raise first-task completion from 12.2% to 18% within one quarter").
- The people it is for, defined in a way you can find in your data (new sign-ups from paid search, for example, not "beginners").
- Out of scope: two or three things that look related and will wait.
The target matters more than it looks. A design team without a number tends to finish when the design looks good; a team with a number finishes when the number moves, and can tell the difference. The target also makes the later comparison honest, because you wrote it before you saw the result. For a fuller treatment of turning goals into metrics, see product analytics framework.
Develop: how many people to test a prototype with
Develop covers concepts, prototypes and tests. The most common question here is how many people you need for a usability test. Nielsen Norman Group's often-cited model says the share of usability problems found by n test users is 1 − (1 − L)^n, where L is the share of problems one user finds, typically 31% in the studies behind the model.
Worked out with L = 0.31:
| Test users | Share of problems found | Calculation |
|---|---|---|
| 1 | 31.0% | 1 − 0.69 |
| 3 | 67.1% | 1 − 0.69³ |
| 5 | 84.4% | 1 − 0.69⁵ |
| 8 | 94.9% | 1 − 0.69⁸ |
Two readings follow. First, the curve flattens: going from 5 to 8 users adds about 10 percentage points for a 60% larger test. Second, the model assumes people are similar and the problems are findable by any of them. If your product serves two clearly different groups, run a small round for each, and run several small rounds instead of one big one, fixing what you find between rounds.
Test with a task, not an opinion question. "Create your first project" with a stopwatch and a note of every hesitation gives you a completion rate and a list of friction points. "Do you like this screen?" gives you politeness. For examples of how teams move from prototype to product, see product development examples.
Deliver: measure the release against the baseline
Delivery is not the end of the process: it is the point where the evidence from the first three phases gets checked. Before launch, mark the release date so it can be read off every chart. After launch, read the metric you set in the brief, over a window long enough to cover a normal cycle, and compare it with the baseline.
Three cautions apply when you compare a period before a release with a period after:
- Other things changed too. A campaign, a season or a pricing change can move the same number. Note them next to the release date.
- The mix of people changed. If the post-release period had more visitors from a high-intent channel, the metric rises without the design doing anything. Compare the same type of person: sign-ups from the same channel, for example.
- One period is a reading, not a verdict. Look at two or three periods, and at the step you changed as well as the final number.
If you need a clean causal answer, you need a controlled experiment, which splits traffic between versions. That is a different tool from analytics; analytics tells you what changed and where.
Worked example: one onboarding problem across all four phases
Sample data: a web app tracks five onboarding steps for everyone who starts sign-up in a month.
Discover and Define. Of 5,000 sign-up starts, 3,400 create an account (68.0%), 2,040 set up a profile (60.0% of the previous step), 1,020 create a first project (50.0%) and 612 complete a first task (60.0%). Overall first-task completion is 612 ÷ 5,000 = 12.2%. Interviews say the blank "new project" screen feels like homework. The brief sets a target of 18% in a quarter.
Develop. The team builds a template picker as the first project screen and tests it with 5 people. Three of them complete the task in under two minutes, and two hesitate at the template names. By the model above, five users find about 84% of the problems, so the team renames the templates and ships.
Deliver. Next month's 5,000 sign-up starts go through the new flow: 3,450 create an account (69.0%), 2,415 set up a profile (70.0%), 1,449 create a first project (60.0%) and 985 complete a first task (68.0%). Completion is 985 ÷ 5,000 = 19.7%, a relative gain of 985 ÷ 612 − 1 = 61.0%, so the target is met.
The step the team redesigned moved from 50.0% to 60.0%, but the steps before it also moved (60.0% to 70.0% for the profile step). That is a prompt to ask why before declaring victory: the redesigned screen may have been a reason to keep going earlier, or the visitors may simply have been a different mix. The numbers say the target was met; they do not say which change did it.
Sign-up start → first task done
one month, 5 stepsStarted sign-up
5,000
Account created
3,400
Profile set up
2,040
First project created
1,020
First task completed
612
Common mistakes in the product design process
- Treating the phases as a waterfall. Test a rough idea during discovery; return to definition if testing shows the problem was misread.
- Skipping the baseline. Without a number before the design, "it improved" means "it feels better".
- Testing with colleagues. They know the product. Recruit people who match the audience in the brief.
- Defining success as launch. A shipped design that does not move the metric is a result, and it belongs in the next discovery round.
- Measuring only the final number. Read the step you changed and the steps next to it; otherwise you cannot tell what worked.
- Ignoring the people who left. Watch where people stop, and look at what they did just before stopping.
| Common mistake | What it looks like | Do this instead |
|---|---|---|
| Waterfall thinking | Discovery is declared finished and never reopened | Test rough ideas early and return to Define when the problem was misread |
| No baseline | "It improved" with nothing to compare against | Record the metric before you design |
| Testing with colleagues | Everyone finds the screen clear | Recruit people who match the audience in the brief |
| Launch as success | The release ships and nobody reads the number | Read the same metric after launch and feed it into the next Discover |
A shipped design that does not move its metric is still a result; it belongs in the next discovery round.
In TapCub: carrying the numbers from discovery to delivery
Take the onboarding example above. This is how you would measure it in TapCub, and where TapCub stops.
- Send the five steps as events. Use the web script or SDK to send the onboarding steps as events. Define them in All-platform analytics › Data › Tracking plan with a status, so the team agrees on names before building.
- Build the funnel. In All-platform analytics › Behavior › Behavior analysis, create a funnel with the five steps. It gives step-by-step conversion and shows which step loses people, which is your discovery evidence.
- Look at the screen itself. For a web flow, All-platform analytics › Behavior › Heatmaps shows clicks, rage clicks and scroll depth, and Session replay (off by default) shows what people did before they stopped. Both help explain a drop-off.
- Mark the release. Add a date annotation in Configuration › Annotations so the release appears on the charts.
- Compare after launch. Run the same funnel over the next period and compare with the baseline. Use retention in the same page to see whether the people who activated come back.
TapCub does not run A/B tests or split traffic, and it does not run usability tests or interviews. It measures the funnel before and after, so the before-and-after cautions above apply. See also product analytics framework.
FAQ
What are the stages of the product design process?
Most guides use four phases: Discover, Define, Develop and Deliver, as in the Design Council's Double Diamond. Others split these into five to ten steps such as research, ideation, prototyping, testing and launch. The numbering matters less than the evidence: each phase should leave behind one question answered, one data point and one decision.
Is the product design process linear?
No. Teams loop back when testing shows that the problem was misunderstood, or when launch data contradicts the brief. The Design Council describes the process as one where teams return to earlier stages as they learn. Keep the phases as questions you can revisit, and write down what you learned each time.
How many users do you need to test a prototype?
Five users find about 84% of usability problems under Nielsen Norman Group's model (1 − 0.69⁵), eight find about 95%. Run small rounds of three to five, fix what you find, then test again, rather than one large round. Test each clearly different audience separately.
How do you measure whether a product design worked?
Set a metric, a target and a date before you design, record the baseline, and read the same metric after release over a window that covers a normal cycle. Compare like with like (the same platform and channel mix) and note anything else that changed, such as campaigns or seasons.
Sources
- Design Council. The Double Diamond — four phases (Discover, Define, Develop, Deliver) and the note that teams loop back. Checked 2026-11-19.
- Jakob Nielsen. Why You Only Need to Test with 5 Users. Nielsen Norman Group, 2000 — the model N × [1 − (1 − L)^n] and the typical L of 31%. Checked 2026-11-19.
Was this article helpful?
We use your answers to fix and expand this page.
Couldn’t send. Please try again in a minute.
Thanks for the feedback. We’ll use it to improve this page.You’ve already sent feedback on this page. Thanks.

Product Adoption Consultant
Explores customer onboarding, live conversations, and self-service, turning common usage questions into practical guidance and improvements.