Try it on your own data
Every report in this article is in the free plan. One snippet for web and apps, up to 10 sites.
Start freeUGC examples that are worth copying come with a metric: ratings and reviews (conversion by review count), photo reviews (before and after), customer Q&A (support contacts per 1,000 orders), contests (cost per order), customer videos, referral stories, community answers and embedded galleries. Below are eight, each with where to measure it, and recomputable sample data showing 5-plus reviews lifted product conversion 40% on the same products.
What you will learn
- Pair every UGC format with the shopper question it answers and the metric that should move
- Reviews have the strongest published evidence, but test on the same products over time because popular products attract both reviews and orders
- Tag contests and referral links with a UTM campaign so cost per order can be computed; disclose incentives and get reuse permission
What counts as a UGC example, and what should you measure for each?
User-generated content (UGC) is anything your customers or audience create about your product that you did not write: reviews, photos, questions, videos, posts. The glossary entry on user-generated content covers the definition; this article is a list of examples where each one comes with the metric you would track and where that metric lives. An example without a metric is decoration.
| # | UGC example | What users create | Metric to track | Where it is measured |
|---|---|---|---|---|
| 1 | Ratings and text reviews | Stars and comments on product pages | Product-page conversion by review count | Analytics, goals |
| 2 | Photo reviews | Customer photos attached to reviews | Conversion before and after enabling photos | Analytics, goals |
| 3 | Customer Q&A | Questions and answers on product pages | Pre-purchase support contacts per 1,000 orders | Support tool, analytics |
| 4 | Photo or hashtag contest | Posts on social channels | Submissions per 1,000 sessions, cost per order | Campaign (UTM) reporting |
| 5 | Customer videos | Unboxings and demos | Completion rate, click-through, conversion | Video platform, analytics |
| 6 | Referral stories | Testimonials with a referral link | Orders from referral-tagged sessions | Campaign (UTM) reporting |
| 7 | Community answers | Forum threads and help replies | Questions answered without a support ticket | Support tool |
| 8 | Embedded social gallery | Customer posts shown on your pages | Click-through to product pages, conversion | Analytics events |
Names of specific brands are left out on purpose: public brand case studies rarely publish the denominators, so you cannot check the numbers. The rest of this article uses sample data you can recompute.
| UGC example | Metric to track | Where it is measured |
|---|---|---|
| Ratings and text reviews | Product-page conversion by review count | Analytics, goals |
| Photo reviews | Conversion before and after enabling photos | Analytics, goals |
| Customer Q&A | Pre-purchase support contacts per 1,000 orders | Support tool, analytics |
| Photo or hashtag contest | Submissions per 1,000 sessions, cost per order | Campaign (UTM) reporting |
| Customer videos | Completion rate, click-through, conversion | Video platform, analytics |
| Referral stories | Orders from referral-tagged sessions | Campaign (UTM) reporting |
| Community answers | Questions answered without a ticket | Support tool |
| Embedded social gallery | Click-through to product pages, conversion | Analytics events |
Pick one metric per format before launch; it is the number you report afterwards.
Do ratings and reviews move conversion, and by how much?
Yes, with sharply diminishing returns. The Spiegel Research Center at Northwestern University, in work first published in 2017, found that the purchase likelihood for a product with five reviews is 270% greater than for a product with none, and that the marginal benefit of more reviews falls off rapidly after the first five. The same page reports a larger effect for higher-priced products and a peak in purchase likelihood at average ratings between 4.0 and 4.7, not at 5.0.
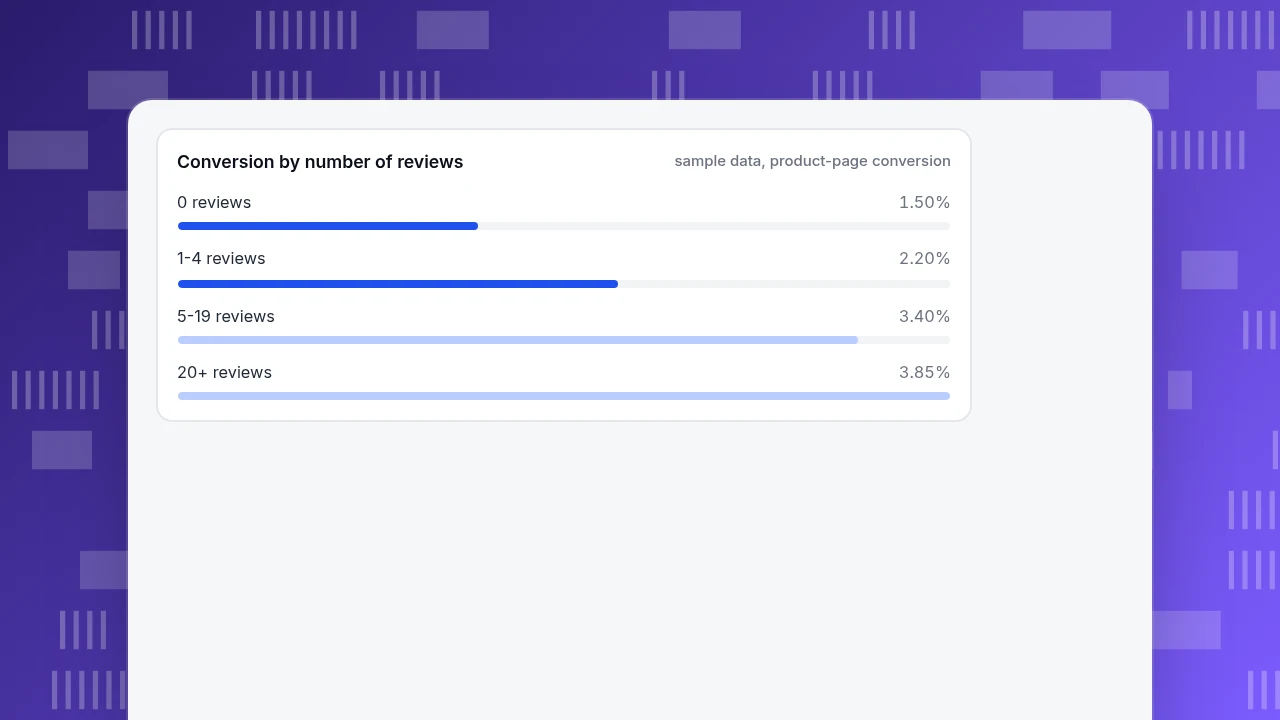
Those are averages across many products, so check them on your own catalogue. Sample data for a shop with 30,000 product-page sessions:
| Review count | Sessions | Orders | Conversion |
|---|---|---|---|
| 0 | 4,000 | 60 | 1.50% |
| 1–4 | 6,000 | 132 | 2.20% |
| 5–19 | 9,000 | 306 | 3.40% |
| 20 or more | 11,000 | 423 | 3.85% |
Relative to products with no reviews, the 5–19 group converts at 3.40 ÷ 1.50 − 1 = +126.7%. The step from 5–19 to 20+ is only 3.85 ÷ 3.40 − 1 = +13.2%, which fits the diminishing-returns pattern.
Treat that table as a hypothesis, not proof. Popular products attract both more reviews and more purchases, so the gap partly reflects demand. A cleaner check follows the same products over time. Sample data: 12 products that went from fewer than 5 reviews to 5 or more. In the month before, they had 24,000 sessions and 360 orders (1.50%); in the month after, 24,000 sessions and 504 orders (2.10%). The relative gain is +40.0%, with a z of about 4.9 on a two-proportion test, so it is unlikely to be chance. It is smaller than the cross-sectional gap, which is the usual result when you control for product popularity.
Conversion by number of reviews
sample data, product-page conversionDo photo reviews and customer Q&A add anything on top of text reviews?
They can, and they are measured differently.
Photo reviews show the product in use. The test is before and after enabling photo uploads on the same products. Sample data: 5,000 sessions on those pages before, 150 orders (3.00%); 5,000 sessions after, 189 orders (3.78%); relative lift 26.0%, z about 2.2. That is borderline on one month of data, so extend the window before you claim it.
Customer Q&A answers the question a shopper would otherwise ask support. Here the metric is not conversion but pre-purchase contacts per 1,000 orders. Sample data: 14 per 1,000 before, 9 per 1,000 after, a fall of 35.7%. Pair it with a check that conversion did not drop, because a page that is cluttered with unanswered questions can hurt more than it helps.
Rule of thumb: add a UGC format only when you can name the shopper question it answers and the number that would move.
How do you measure a photo or hashtag contest?
Give the contest its own campaign tag so its visitors can be separated from everyone else. Sample data for a month-long photo contest:
- Spend: $3,000 (prizes and moderation time).
- Sessions arriving from the campaign link, tagged with a UTM campaign: 6,000.
- Submissions: 420. Submissions per 1,000 sessions = 420 ÷ 6,000 × 1,000 = 70.
- Orders from those sessions: 96. Conversion = 96 ÷ 6,000 = 1.6%.
- Cost per order = $3,000 ÷ 96 = $31.25. Cost per submission = $3,000 ÷ 420 = $7.14.
Two decisions follow. If your average order margin is below $31.25, the contest did not pay for itself on direct orders; its value then rests on the 420 pieces of content you can reuse, if the entrants gave permission. And a 1.6% conversion against a 2.2% site average is not a failure, because contest traffic is often browsing for entry, not buying; compare it with other social traffic, not with your site average.
What about customer videos, referral stories and community answers?
Each follows the same pattern of format, shopper question and metric:
- Customer videos. Measure completion rate (share of views that reach the end), click-through to the product page and conversion of that traffic. A fuller comparison of customer and brand-made video is in UGC videos.
- Referral stories. A customer testimonial with a referral link is measured by orders from sessions that carry the referral tag. Sample data: 240 referred sessions, 18% convert, so 240 × 18% = 43.2 orders; at $3,000 of reward cost that is $3,000 ÷ 43.2 = $69.44 per order, a cost you can compare against paid channels.
- Community answers. Measure the share of support questions answered without a ticket and whether people who read answers return. Both come from your support and analytics tools.
- Embedded galleries. Treat each customer post you show as a link, track clicks from the gallery to product pages, and compare the conversion of visitors who clicked with those who did not, with the usual caution that clickers are already interested.
If you want a campaign to earn links as well as orders, look at backlink examples for what gets cited.
What must you get right before publishing UGC?
Three rules, each with a source:
- Do not fake it or buy it. In the United States the FTC's rule on consumer reviews and testimonials, 16 CFR Part 465, bans fake reviews and the buying of reviews, and covers review suppression and fake social indicators. It became fully effective on 21 October 2024 and the FTC can seek civil penalties.
- Disclose incentives. Under 16 CFR 255.5, a connection that could affect how much weight people give an endorsement, such as free products, discounts, affiliate links or prize entries, must be disclosed clearly and conspicuously where audiences would not expect it.
- Get permission to reuse. The right to display a customer's photo on your site or in an advert is not automatic. Ask in the contest terms or by message, and keep the reply.
On trust, Nielsen's 2021 Trust in Advertising study, with more than 40,000 consumers, found 88% of global respondents trust recommendations from people they know more than any other channel. That figure is about personal recommendations, not UGC in general, so use it as a reason to ask real customers, not as a conversion forecast.
How to measure UGC examples in TapCub
Take the photo contest above and measure it in TapCub:
- Tag the link. Put UTM parameters on the contest link, for example a campaign called photo-contest, and share only that link.
- Find the traffic. Open Web analytics › Sources and filter on the UTM campaign to see sessions and where they came from. Real visitors are counted separately from bots, so scraping does not inflate the 6,000.
- Count conversions. Define the purchase as a goal in Web analytics › Goals; the same data shows in All-platform analytics › Business › Goals.
- Compare with other traffic. Compare the campaign's conversion with other social sources, not with the whole site.
- Add the cost. In All-platform analytics › Business › Channel ROI import the $3,000 as spend for the campaign; the page then shows cost per click and cost per acquisition.
For reviews, the same pages show conversion by product page. TapCub does not collect, moderate or publish UGC, run contests or manage permissions; it measures what happens after visitors arrive.
FAQ
What are examples of UGC?
Ratings and reviews, photo and video reviews, customer questions and answers, contest and hashtag posts, unboxing videos, testimonials with referral links, forum answers and embedded social galleries. The table above pairs each with a metric.
Which type of UGC works best for conversion?
Reviews have the strongest published evidence: the Spiegel Research Center reports a 270% higher purchase likelihood at five reviews versus none. Photo reviews and Q&A are worth testing on top; measure them before and after on the same products.
How do you measure the ROI of a UGC campaign?
Tag the campaign with UTM parameters, count its sessions and orders, and divide spend by orders. In the sample contest that was $3,000 ÷ 96 = $31.25 per order, compared against the margin on an order.
Do you need permission to use customers' content?
Yes. Get explicit permission for each use, in the contest terms or by message, and disclose any incentive. In the US, endorsements with material connections must be disclosed under 16 CFR 255.5.
How many reviews does a product need?
The Spiegel Research Center found most of the benefit arrives with the first five. Beyond that, returns diminish, so spend effort on products with none before products with many.
Sources
- Spiegel Research Center, Northwestern University, How online reviews influence sales: 270% at five reviews, diminishing returns, 4.0–4.7 rating peak (checked 2026-11-20).
- Federal Trade Commission, Trade Regulation Rule on the Use of Consumer Reviews and Testimonials, 16 CFR Part 465 (Federal Register, 22 August 2024; effective 21 October 2024).
- Cornell Law School Legal Information Institute, 16 CFR 255.5, Disclosure of material connections (checked 2026-11-20).
- Nielsen, Beyond martech: building trust with consumers: 88% trust recommendations from people they know, 2021 Trust in Advertising study (checked 2026-11-20).
- NIST, Dataplot: binomial proportion test: two-proportion test used for the before-and-after comparisons.
Was this article helpful?
We use your answers to fix and expand this page.
Couldn’t send. Please try again in a minute.
Thanks for the feedback. We’ll use it to improve this page.You’ve already sent feedback on this page. Thanks.

Product Analyst
Focuses on event analysis, conversion funnels, and retention, using clear metric definitions and structured analysis to explain product performance.