Try it on your own data
Every report in this article is in the free plan. One snippet for web and apps, up to 10 sites.
Start freeApp usage tools fall into two families that are not alternatives: market-intelligence tools estimate usage for any app, while first-party analytics measure your own app exactly through an SDK. Use the first to size a market and the second to decide what to build. Store consoles and crash tools sit in between and cover only part of your own data.
What you will learn
- Decide first whether your question is about someone else's app (market intelligence) or your own (first-party analytics)
- Numbers differ because of opt-in sampling, definitions and identity: a store console showing 3,200 devices can be 40% of an SDK's 8,000
- Core first-party metrics: new users, DAU / WAU / MAU, stickiness (20.0% in the sample), sessions, retention, crash-free users
What does "app usage analytics tool" actually mean?
The phrase covers two very different families of tools, and comparing them as if they were alternatives is the main reason buyers choose wrongly.
- Market-intelligence tools estimate how much any app is used, including apps you do not own. They build their numbers from panels, sampled devices and models, and they answer questions such as "how big is that competitor's app?"
- First-party usage analytics measure the app you ship, from inside it, through an SDK that sends your own users' events. They answer "what do my users do, and who comes back?"
A third group sits between: the store consoles (Apple's App Store Connect Analytics and Google Play Console), which report on your own app but only from what the store can see. And a fourth group, crash and performance tools, covers stability and speed only.
Decide first whether your question is about someone else's app or your own. If it is about your own, nothing outside your app can match the accuracy of data collected inside it.
How do the four kinds compare?
| Market intelligence | Store console | First-party usage analytics | Crash and performance | |
|---|---|---|---|---|
| Whose app | Any app | Your app only | Your app only | Your app only |
| Where the data comes from | Panels, sampled devices, models | The store's own records | An SDK in your app | An SDK in your app |
| Accuracy for your app | Estimate, often with wide error | Exact for what it sees | Exact for what the SDK sends | Exact for crashes it catches |
| Event-level behavior (screens, actions) | No | No | Yes | Partly |
| Retention by cohort | Estimated | Limited | Yes, with your definitions | No |
| Users you can follow across sessions | No | No | Yes, if you identify them | Per crash |
| Best for | Market size, competitor trends | Installs, store conversion | Product decisions | Fixing bugs |
Use market intelligence to decide where to compete. Use first-party analytics to decide what to build next. They rarely replace each other.
| Question | Type to use | What you will see |
|---|---|---|
| How many people install after the store page? | Store console | Impressions, page views, downloads |
| Where do new users drop off in onboarding? | First-party analytics | A funnel from your own events |
| Is a competitor growing faster than us? | Market intelligence | An estimated trend |
| Did version 4.2 increase crashes? | Crash or stability report | Crash-free users by version |
| Which country should we localize for? | Market intelligence, then your own split | Estimated size, then measured retention |
Write down the source tool of every number on a dashboard so estimates and measurements are not mixed.
Why do usage numbers differ between tools?
Three reasons explain most mismatches.
1. Opt-in sampling. Apple states that usage data in App Store Connect Analytics comes from users who agreed to share their analytics with developers, and that usage metrics are available only when you have at least five active devices in the date range. A console that sees only opted-in users reports a fraction of your real audience.
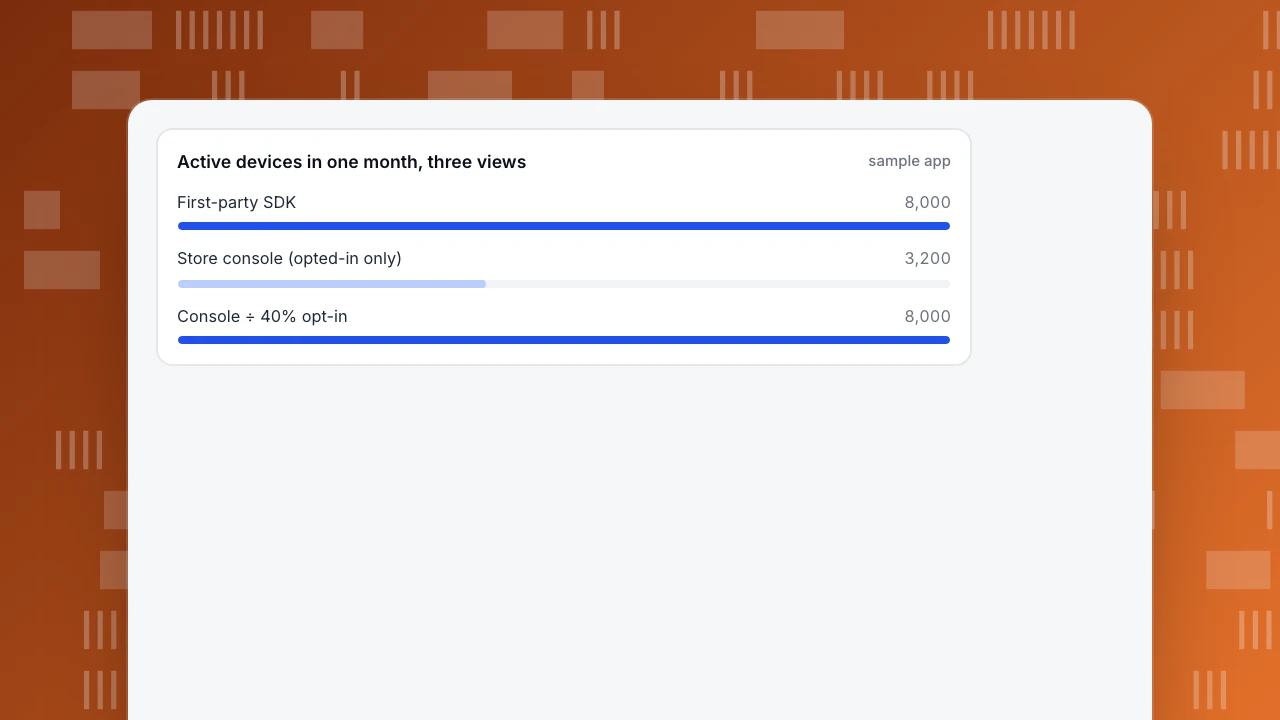
Sample data: your SDK counts 8,000 active devices in a month. The store console shows 3,200. If the opt-in share is 40%, then 3,200 ÷ 0.40 = 8,000, which reconciles, but only because this sample assumes opted-in users behave like everyone else. Never scale a console number up without checking it against first-party data once.
2. Different definitions. Apple counts a session when the app is used for at least two seconds, and active devices as devices with at least one session in the selected period. Another tool may count a session after 30 seconds of inactivity or count users instead of devices. Always read the metric definition before comparing two numbers.
3. Different identity. A "user" can be a device, an install or a logged-in person. The same person with a phone and a tablet is one user, two devices.
Active devices in one month, three views
sample appWhich first-party metrics should you track?
These are the core metrics of first-party app usage, with the questions they answer.
| Metric | Definition | Question |
|---|---|---|
| New users | People seen for the first time (a reinstall is not new) | Is acquisition working? |
| Active users (daily, weekly, monthly) | Distinct people with a start or screen view in the window | How big is the engaged base? |
| Stickiness | Daily actives ÷ monthly actives | Do people come back often? |
| Sessions or starts | Number of times the app is opened | How often is it used? |
| Engaged sessions | Sessions with enough activity to count as real use | Is usage deep or shallow? |
| Retention | Share of a starting group who return later | Do they stay? |
| Crash-free users | 1 − users with a crash ÷ active users | Is it stable? |
| Version distribution | Share of actives on each app version | Can we retire old versions? |
Sample data: daily active users average 8,000, weekly active users are 22,000 and monthly active users are 40,000.
- Stickiness (DAU ÷ MAU) = 8,000 ÷ 40,000 = 20.0%: a typical user opens the app on about 6 of 30 days.
- DAU ÷ WAU = 8,000 ÷ 22,000 = 36.4%
- If 120 of the 8,000 daily actives hit a crash, crash-free users = 1 − 120 ÷ 8,000 = 98.5%
Note that active users cannot be added across days: 7 days of 8,000 daily actives is not 56,000 people, because the same people return. Use weekly and monthly actives, which count distinct people.
How do you evaluate a first-party tool?
Ask every candidate the same questions and write down the answers.
| Question | Why it matters |
|---|---|
| How is a session defined, and can I change the timeout? | Sessions drive almost every other number |
| What is a "user": device, install or person? | Decides how reinstalls and multiple devices count |
| How is retention defined: exact day, rolling or any activity? | Different definitions give 19% or 45% on the same cohort |
| Is data sampled? | Sampling changes small segments most |
| Can I identify users across web and app? | Needed for a full journey |
| Can I export raw events? | Lets you leave without losing history |
| What do privacy settings and consent do to the numbers? | Opt-out reduces counts |
| How long is detailed data kept? | Limits long-term cohort analysis |
Rules of thumb:
- If your app is early and you only need the five metrics in the table above, any tool with a clean SDK and the right definitions will do. Do not buy for features you will not use.
- If you ship on more than one platform, prefer a tool that keeps iOS, Android and the web in one project so you can follow a person across them.
- Test with one week of real traffic before committing: compare its active users and crash-free users with the store consoles. They should be in the same range.
Which type of tool fits which question?
Match the question to the type before you compare vendors.
| Question | Type to use | What you will see |
|---|---|---|
| How many people install after seeing our store page? | Store console | Impressions, product page views, downloads |
| Where do new users drop off in onboarding? | First-party analytics | A funnel by step, from your own events |
| Is a competitor's app growing faster than ours? | Market intelligence | An estimated trend, not exact counts |
| Did version 4.2 increase crashes? | Crash tool or first-party stability report | Crash-free users by version |
| Do users who enable notifications come back more? | First-party analytics | Retention for two segments |
| Which country should we localize for next? | Market intelligence, then your own country split | Estimated market size, then measured installs and retention |
A common mistake is buying a market-intelligence subscription to answer a product question. If you want to know why week-1 retention is 19.0%, an estimate of your competitor's usage cannot tell you which onboarding step loses people. Your own funnel can.
A second mistake is the reverse: using your own numbers to size a market. Your 40,000 monthly actives describe your audience, not the category. Use each tool for the question it can answer, and write down which tool is the source of each number on your dashboard so nobody mixes an estimate with a measurement.
When do you need a market-intelligence tool as well?
When the question is outside your app: how large is a category, whether a competitor's usage is growing, which markets to enter. Treat their numbers as estimates, compare trends more than levels, and never mix them into your own dashboard as if they were measured. Say a market tool estimates a competitor at 2 million monthly users (a hypothetical figure); your first-party number of 40,000 is exact. The two answer different questions.
How do you track app usage in TapCub?
TapCub is a first-party tool. It measures the app you ship, with the same project also covering your website and chat.
- Install an SDK. TapCub has SDKs for iOS, Android, Flutter, React Native and HarmonyOS, and mini programs. Events land in the same project and user model as web analytics.
- Read users and engagement. Open App analytics › Users › Users. Active users are distinct people with a start or screen view; weekly and monthly active are distinct actives over the previous 7 or 30 days; new users are people first seen in the range, and a reinstall does not count as new. The default session timeout is 30 seconds and can be changed in the app settings.
- Read retention. App analytics › Users › Retention has New-user retention and Active retention at day, week or month grain, and cells that are not due yet are marked as not due, not zero. A next-day retention number is the share of new users who start again the next day.
- Watch quality. App analytics › Quality & attribution › Stability reports crashes; crash-free users is 1 − crash users ÷ active users, the same calculation as the sample above. App analytics › Users › Versions shows which versions your users are on.
- Tie it to people. Call
tapcub.loginso a person who uses the web and the app appears as one person.
TapCub is not a market-intelligence tool and cannot show another company's app. It also is not a click-to-install attribution service; attribution callbacks from such a service can be received, but TapCub's own attribution uses sessions before a conversion.
FAQ
What is the difference between app intelligence and app analytics?
App intelligence tools estimate usage for any app from panels and models, including competitors. App analytics tools measure your own app through an SDK, exactly. Use intelligence for market questions and analytics for product decisions.
Why does my app store console show fewer users than my analytics?
Store consoles report only on users who agreed to share analytics. Apple's usage data comes from opted-in users, so its counts are a subset. Compare once with your SDK data to see the gap.
What metrics should an app usage tool report?
New users, daily, weekly and monthly active users, stickiness, sessions, engaged sessions, retention, crash-free users and version distribution are the core set. Check how each is defined.
How do I calculate app stickiness?
Divide daily active users by monthly active users. With 8,000 daily and 40,000 monthly actives, stickiness is 20.0%, so the typical active user opens the app on about 6 days a month.
Can I see a competitor's app usage?
Only as estimates from market-intelligence tools. You cannot get exact figures, and those estimates should not be mixed with your own measured data.
Sources
- Apple, Metric definitions, App Store Connect Analytics Help: sessions (at least two seconds), active devices, opt-in data and the five-device minimum. Checked 2026-11-21.
- Apple, App retention, App Store Connect Analytics Help: retention as the share of installers who opened the app a set number of days later, from opted-in users. Checked 2026-11-21.
Was this article helpful?
We use your answers to fix and expand this page.
Couldn’t send. Please try again in a minute.
Thanks for the feedback. We’ll use it to improve this page.You’ve already sent feedback on this page. Thanks.

Product Experience Specialist
Writes about product experience, practical workflows, and growth, turning complex processes into clear steps for everyday decisions.