Try it on your own data
Every report in this article is in the free plan. One snippet for web and apps, up to 10 sites.
Start freeAI reporting means software drafts the written summary of your metrics: what changed, by how much and why. It is good at sorting, comparing and phrasing, and weak at arithmetic it was not given and at causes. Treat every sentence as a claim to be recomputed from the source table before the report is sent.
What you will learn
- In the sample, 4 of 6 sentences were right; one had the wrong growth rate (+12% instead of +8.2%) and one named a cause nobody measured
- Check three things in every sentence: the number, the comparison base and the claimed cause
- The safest setup runs the query first and lets the model only reword the result
What AI reporting is and what jobs it does
AI reporting is the use of software, usually a large language model, to produce the written part of a report from your data: a headline, the main changes, a comparison with last period, sometimes a suggestion. It does three different jobs, and they carry different risks:
- Retrieving and ranking. Which pages, sources or products moved most. The risk is low if the tool runs a query for it.
- Computing. Percentage change, shares, rates. The risk depends on whether the model computes or the database does.
- Explaining. Why something happened. This is the highest risk, because the data in a report rarely contains the cause.
The same fluent tone covers all three, which is why a wrong sentence reads as confidently as a right one.
Raw table versus written summary: a worked example
Sample data: one week against the previous week for a small online store.
| Metric | Last week | This week | Change |
|---|---|---|---|
| Sessions | 12,400 | 13,420 | +8.2% |
| Orders | 310 | 309 | −0.3% |
| Conversion rate | 2.50% | 2.30% | −0.20 pts |
| Revenue | $24,800 | $24,720 | −0.3% |
| Bounce rate | 46.0% | 47.5% | +1.5 pts |
Sessions by channel: paid search 3,100 to 3,900, organic search 6,200 to 6,420, social 1,500 to 1,500, direct 1,600 to 1,600.
An AI-written summary of this table (hand-written here as a typical example):
Sessions grew 12% week over week, led by paid search. Orders were flat at 309 versus 310. Conversion rate fell to 2.30% from 2.50%, which is due to the new homepage banner. Paid search drove most of the traffic growth, and revenue was flat.
It reads well and gets the story broadly right: traffic up, orders flat, conversion down. It still contains two sentences you should not send.
| Claim in the summary | Recomputed from the table | Verdict |
|---|---|---|
| Sessions grew 12% week over week | 13,420 ÷ 12,400 − 1 = +8.2% | Wrong number |
| Orders were flat (309 vs 310) | 309 ÷ 310 − 1 = −0.3% | Correct |
| Conversion rate fell from 2.50% to 2.30% | 310 ÷ 12,400 = 2.50%; 309 ÷ 13,420 = 2.30% | Correct |
| The decline is due to the new homepage banner | No banner data in the table | Unsupported cause |
| Paid search drove most of the growth | +800 of +1,020 sessions = 78.4% | Correct |
| Revenue was flat | $24,800 to $24,720 = −0.3% | Correct |
Sample data: one week against the previous week. The summary is a hand-written example of typical AI output, not the result of a specific tool.
Check it claim by claim
Recompute every sentence from the table:
- "Sessions grew 12%." 13,420 ÷ 12,400 − 1 = 8.2%. The number is wrong. A model that is shown the table can still produce a plausible but wrong percentage when it computes in text.
- "Orders were flat at 309 versus 310." Correct, −0.3%.
- "Conversion rate fell to 2.30% from 2.50%." 310 ÷ 12,400 = 2.50% and 309 ÷ 13,420 = 2.30%. Correct.
- "...which is due to the new homepage banner." The table contains no banner data. The cause is invented, or at best a guess from something the tool was told elsewhere. It may even be true, but nothing here shows it.
- "Paid search drove most of the growth." Sessions rose by 1,020: paid search +800 (78.4%), organic +220 (21.6%). Correct.
- "Revenue was flat." $24,800 to $24,720 is −0.3%. Correct.
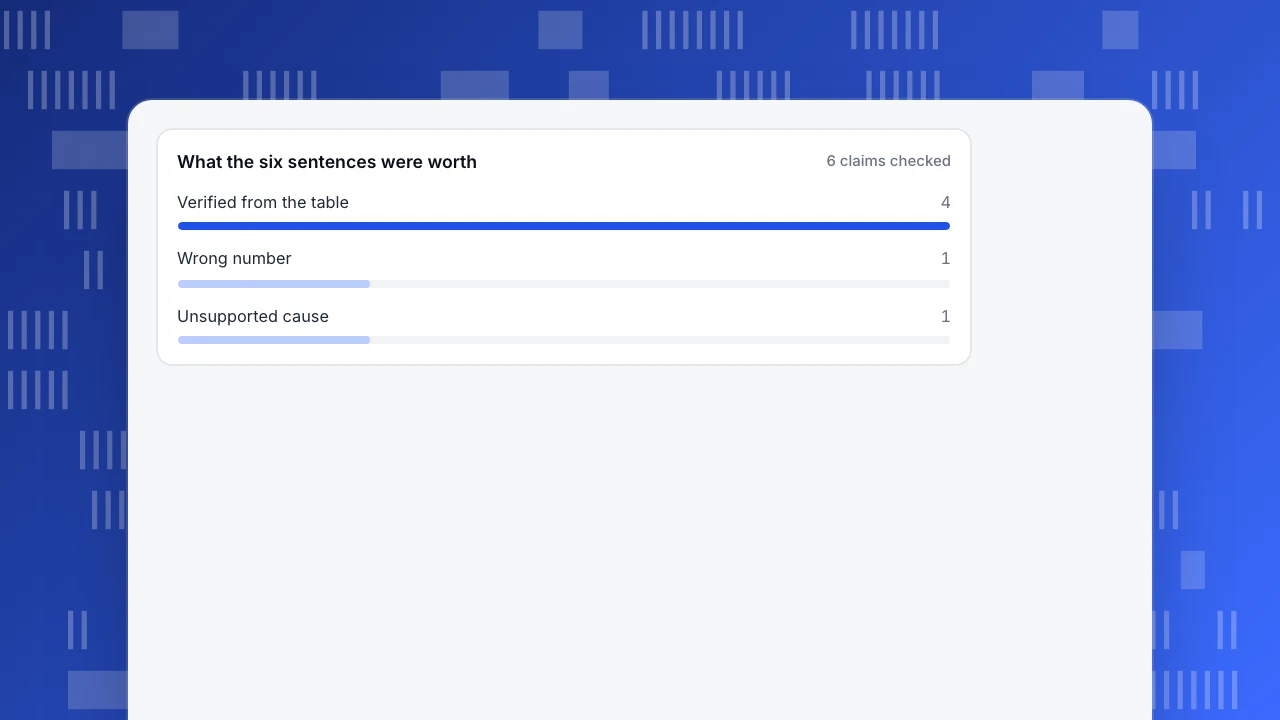
Result: 4 of 6 claims verified (66.7%), one wrong number, one unsupported cause. The two failures are the ones a reader would act on: a growth rate for the board slide and a reason for the design team.
What the six sentences were worth
6 claims checkedWhere AI narration fails
The sample shows two failure types; there are others to watch for:
- Arithmetic done in prose. Percent change, share and averages computed by the model, not the database.
- Wrong base. "Up 12%" compared with which period? A summary may quietly switch between week-over-week, month-over-month and year-over-year.
- Causes without evidence. Anything introduced by "because", "due to" or "driven by" that is not in the data.
- Scope drift. A statement about all traffic that was computed on one channel, or about visitors when the data counts sessions.
- Missing context. An outage, a tracking change or a bot burst that a human would note.
NIST's Generative AI Profile (NIST-AI-600-1, released 26 July 2024) lists generating confidently stated but false content among the risks that generative AI systems add. A peer-reviewed measurement shows the scale in one domain: Dahl and colleagues tested large language models on verifiable questions about US federal court cases and found hallucination rates from 58% to 88% depending on the model. Legal questions are not marketing reports, so that range is not the error rate of your summaries. It is a reminder that fluent text and correct text are separate properties.
A five-step accuracy check
Before an AI-written report goes to anyone, run these steps. It takes about five minutes for a one-page report.
- Trace each number. Every figure in the text must match a cell in a table or chart shown beside it. If you cannot find it, it is not allowed.
- Recompute every percentage. Use the formula (new ÷ old − 1) on the cells. One wrong rate in the sample would have gone into the deck.
- Name the comparison base. The text must say "vs last week" or "vs same week last year". If it does not, add it.
- Mark each cause. A cause is acceptable only if it names evidence in the data (for example, an annotation, a campaign date, a channel breakdown). Otherwise rewrite it as "possible cause, not verified", or delete it.
- Test with a known answer. Once a month, ask the tool about a week where you already know what happened. If it misses an event you annotated, tighten the setup.
Decision rules
- Let a query produce the numbers and the model only reword them. If a tool lets the model do the arithmetic, add a recompute step.
- Descriptive sentences can go out after a spot check; causal sentences need a person.
- Keep the table in the report. The reader should be able to check the sentence against the data in one glance.
- Log corrections. If the same type of error repeats (wrong base, invented cause), change the prompt or the tool, not just the report.
- Do not let an AI summary replace the annotations. Write down launches and outages when they happen; no model can recover them later.
Setup choices that reduce errors
Most wrong sentences come from a few setup decisions. You can check each one without being technical.
| Setup choice | Safer option | Why |
|---|---|---|
| Where numbers come from | A query or a report the tool runs, then shown beside the text | The model never has to calculate or remember a figure |
| What the model may do | Rewrite and order the findings | It cannot add numbers that are not in the result |
| Comparison base | Fixed by the tool (last week, same week last year) | The text cannot quietly switch base |
| Causes | Only from annotations, campaign dates or channel breakdowns you supply | Nothing is invented from a guess |
| Length | One screen: headline, three changes, one question to investigate | Short text has fewer claims to check |
Ask the same questions of any tool you evaluate: "Does the model calculate or does a query?", "Can I see the query?", "What happens when the data is missing?" The honest answer to the last one is that it says so. A tool that fills the gap with a confident sentence is a risk.
A monthly known-answer test
Once a month, run ten questions to which you already know the answers. Sample data: ten questions about weeks you annotated, such as "sessions last week", "which channel grew most", "did conversion rate rise", "what changed after the pricing launch".
| Question type | Asked | Correct | Notes |
|---|---|---|---|
| Single number (sessions, orders) | 4 | 4 | All matched the report |
| Percentage change | 3 | 2 | One used the wrong base period |
| Ranking (which channel, page) | 2 | 2 | Correct |
| Cause (why did it change) | 1 | 0 | Named an event that was not annotated |
| Total | 10 | 8 | 80.0% |
Eight of ten is 80.0%. Look at where the misses fall: percentage change and cause, as in the worked example above. Use this to decide which sentence types you may send after a spot check (numbers and rankings) and which always need a person (changes against a base, and causes). If the score drops after a tool or prompt change, roll back the change.
How AI-written answers work in TapCub
Use the same store and the same week.
- Open All-platform analytics › Operations › AI Assistant and ask "sessions by channel this week versus last week". The answer comes from an analysis query run on your project, and the answer shows the query, so you can check the numbers. The assistant does not search a knowledge base, and it does not create monitors or send notifications.
- The wording of the answer is written from the result by rules first. If a model is configured, it only rewrites that draft and is not allowed to invent numbers that are not in the result. With no model, you get the rule-based reading.
- Open the Why did it change tab to see how much each channel, referrer, country, device or landing page contributed to the change. The contribution is that value's change divided by the total change, which is the 78.4% check from above.
- For a standing report, turn on Configuration › Settings › Notifications scheduled reports. The weekly report lists visitors, pageviews, sessions, bounce rate and average duration with period change, the fastest-rising pages and sources, conversions for enabled goals and a short reading written from rules, polished by a model if one is configured.
- Add annotations in Configuration › Annotations for the banner launch, so a future reader has the evidence for a cause.
TapCub gives you the numbers and the query behind them. Deciding why something happened still takes a person.
FAQ
What is AI reporting?
It is the use of AI to draft the written part of a report from your data: what changed, the size of the change and sometimes a reason. It saves writing time, but the draft must be checked against the source numbers.
Is AI reporting accurate?
It depends on who does the calculation. If a database computes the numbers and the model only phrases them, accuracy is high. If the model calculates in text, wrong percentages appear. Causes are the least reliable part because the data rarely contains them.
Can AI replace my weekly marketing report?
It can replace the first draft. A person still needs to confirm the numbers, add context such as launches and outages, and decide what to do. Keep the source table in the report.
How do I stop AI from inventing reasons?
Allow causes only when they cite data you can show, such as an annotation or a channel breakdown. Everything else is labelled "possible cause, not verified" or removed.
What should an AI report always include?
The comparison base (vs last week or last year), the source table, the time range and the definition of each metric. Without them the reader cannot check the claims.
Sources
Was this article helpful?
We use your answers to fix and expand this page.
Couldn’t send. Please try again in a minute.
Thanks for the feedback. We’ll use it to improve this page.You’ve already sent feedback on this page. Thanks.

Data Analyst
Explores traffic sources, conversion funnels, and retention, using clear metric definitions and concrete examples to explain what the numbers mean.