Try it on your own data
Every report in this article is in the free plan. One snippet for web and apps, up to 10 sites.
Start freeAn aha moment is the point where a new user first sees what the product is worth, and in data it is an early action that separates users who stay from users who leave. Compare 30-day retention for people who did each early action in their first 3 days with those who did not, then find a threshold and confirm the cause.
What you will learn
- Compare retained and churned users on early actions: in the sample, inviting a teammate in 3 days gives 50.0% retention against 16.2% for those who did not
- A good candidate has a big gap, wide reach and a one-sentence threshold: 2 or more invites retain 68.4%
- The gap shows association, not cause: confirm with a nudge test, which needs about 2,654 people per group in the sample
What is an aha moment, and how do you find yours with data?
An aha moment is the point at which a new user first sees what the product is worth to them. In data terms it is an early action that separates people who stay from people who leave. You do not find it by asking which feature feels important; you find it by comparing the first days of retained users with the first days of users who churned and looking for the action that differs most. The aha moment page defines the idea and the activation rate page covers the rate you will measure once you have chosen it.
The method has six steps, and the sample in this article follows them with real arithmetic:
- Define "retained" and the early window.
- List candidate early actions.
- Compare retention for people who did each action and people who did not.
- Find the threshold, such as how many times or how soon.
- Check whether the action causes retention or only goes with it.
- Turn it into a metric and design onboarding towards it.
The main claim is that a good aha candidate has a large retention gap, enough people reaching it to matter and a threshold you can state in one sentence. Most actions fail the first test, and the one that passes often fails the fifth unless you test it.
How do you define retained users and the early window?
Write two definitions before you open a report, because every number depends on them.
- Retained: the user was active again in a fixed late window, such as at least one active day in days 24 to 30 after signing up. Pick a window that matches how often people should use the product, so a weekly tool uses a weekly window.
- Early window: the first 3 days after signing up. Actions in the first 3 days are candidates because you can still influence them. An action that happens on day 20 is a symptom of staying, not a cause.
Sample data: 2,000 new users in a month, 500 of whom are retained, a 25.0% retention rate. Count by signed-in person where you can; counting by device splits one person into several and blurs every comparison. The definition of an active user matters here, because "active" in the retained window must use one fixed rule.
Which early actions should you test?
List 8 to 15 actions from your event list that a new user could do in the first 3 days and that you could plausibly encourage. Exclude automatic events and actions everyone does, such as the first page view. A good list mixes setup (created a project, connected a data source), collaboration (invited a teammate) and exploration (read the docs, changed a setting).
The sample tests five. The reason to test several is the next section's trap: with many candidates, some will look good by chance.
How do you compare retained and churned users?
For each action, count how many new users did it in the first 3 days and what share of each group was retained. Then compute the ratio of the two retention rates and the difference in points. To judge whether a difference could be chance, use the two-proportion z-test described in the NIST/SEMATECH handbook: |z| above about 1.96 is significant at the 5% level.
Sample data: 2,000 new users, 500 retained.
| Early action (first 3 days) | Did it | Retained if did | Retained if not | Ratio | Difference | z | Share of retained who did it |
|---|---|---|---|---|---|---|---|
| Invited a teammate | 520 | 50.0% | 16.2% | 3.08 | +33.8 pts | 15.3 | 52% |
| Installed the code | 1,100 | 34.5% | 13.3% | 2.59 | +21.2 pts | 10.9 | 76% |
| Created a first project | 1,500 | 28.7% | 14.0% | 2.05 | +14.7 pts | 6.6 | 86% |
| Read the docs | 900 | 26.7% | 23.6% | 1.13 | +3.0 pts | 1.6 | 48% |
| Changed the theme | 600 | 25.0% | 25.0% | 1.00 | 0.0 pts | 0.0 | 30% |
For example, 260 of the 520 who invited a teammate were retained, 50.0%, against 240 of 1,480 who did not, 16.2%: a ratio of 3.08 and a gap of 33.8 points. The table separates three groups:
- Strong candidates: inviting a teammate and installing the code. Both have large gaps and z values far above 1.96.
- Real but weak discriminators: creating a first project. The gap is real (z = 6.6) but 75% of new users do it, so it does not separate people well, and 86% of retained users did it. It is closer to a prerequisite than an aha moment.
- Noise: reading the docs (z = 1.6, not significant at 5%) and changing the theme (no difference at all).
Notice the last column. Installing the code reaches 76% of retained users, while inviting a teammate reaches 52%. The invite has the bigger gap, the install has the broader reach. Both belong in your onboarding, and the next step decides which one is the aha.
| Early action | Retained if did | Retained if not | z |
|---|---|---|---|
| Invited a teammate | 50.0% | 16.2% | 15.3 |
| Installed the code | 34.5% | 13.3% | 10.9 |
| Created a first project | 28.7% | 14.0% | 6.6 |
| Read the docs | 26.7% | 23.6% | 1.6 |
| Changed the theme | 25.0% | 25.0% | 0.0 |
Sample data: 2,000 new users, 500 retained; |z| above about 1.96 is significant at the 5% level.
How do you find the threshold?
Raw yes or no hides the dose. Split the best candidate by how many times it happened in the first 3 days.
Sample data: teammates invited in the first 3 days.
| Invites in first 3 days | New users | Retained | Retention |
|---|---|---|---|
| 0 | 1,480 | 240 | 16.2% |
| 1 | 330 | 130 | 39.4% |
| 2 or more | 190 | 130 | 68.4% |
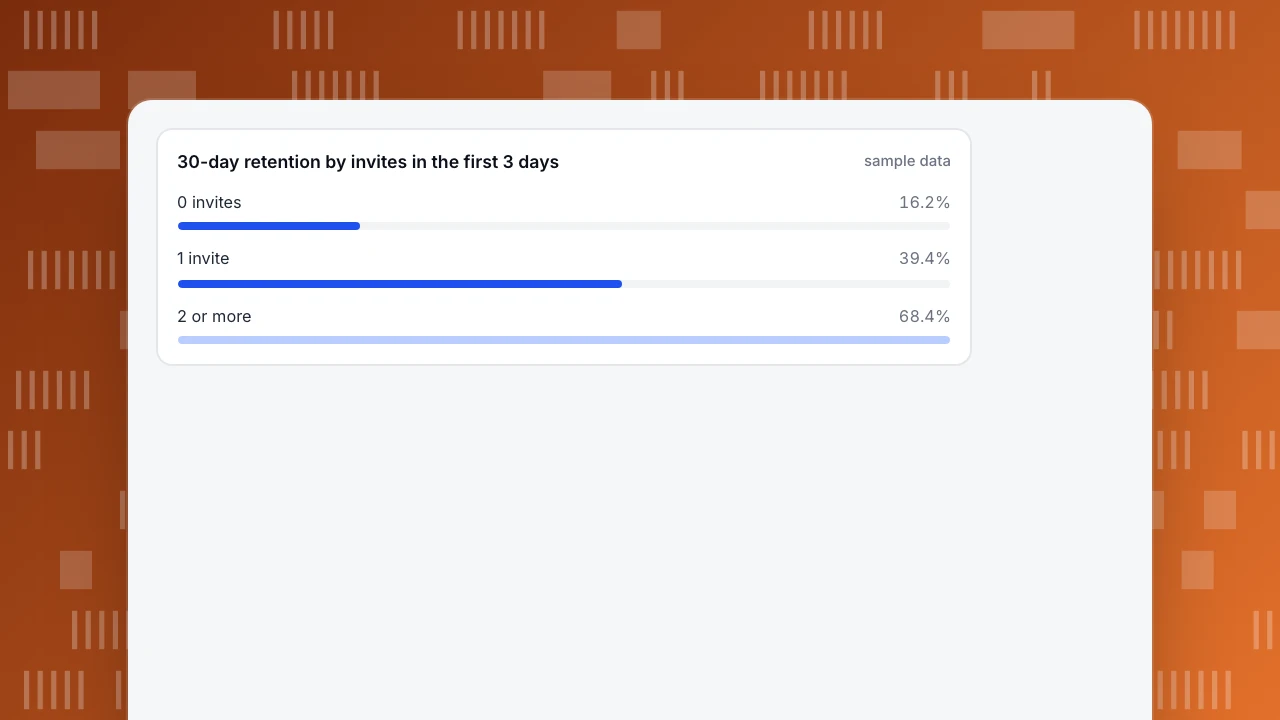
Retention climbs with each invite, and the second invite takes it from 39.4% to 68.4%. A statement you can use is: "Users who invite 2 or more teammates in their first 3 days are retained at 68.4%, against 16.2% for users who invite none." Check the difference between one and two invites (z = 6.4 on 130 of 190 against 130 of 330), so the step from one to two is not noise.
Two cautions come with a threshold. First, only 190 of 2,000 users (9.5%) reach it, so it is a good aha but a small group; the activation rate will be low until onboarding gets more people there. Second, a sharp threshold fitted to one dataset tends to look better than it will on new data. Fit it on one month and check it on the next.
30-day retention by invites in the first 3 days
sample dataDoes the action cause retention, or only go with it?
The comparison above shows an association. People who invite teammates may be the people who already had a team and a real need, who would have stayed anyway. This is the most common mistake in aha-moment work: the product team starts to push invites and finds retention does not move.
To check causation, nudge a random half of new users towards the action and compare retention between the halves. Sample data: if the nudge raised the share inviting from 26% to 36% and each invite were worth the full 33.8-point gap, retention would rise by about 3.4 points, from 25.0% to 28.4%. Detecting that at 5% significance and 80% power needs about 2,654 people per group, so 5,308 in total, which is 2.7 months at 2,000 new users a month.
Two lessons follow. The causal effect is almost always smaller than the raw gap, so a real nudge may need even more people than this. And if you cannot wait that long, ship the nudge with a guardrail and read the trend, accepting that you cannot separate it cleanly from other changes. The testing method itself is outside this article; what matters here is that the analysis proposes a candidate and an experiment confirms it.
What traps make a false aha moment?
- Reverse causation. Engaged users do more of everything, so almost any action correlates with retention. A candidate has to beat the other actions on gap and reach, not just beat zero.
- Testing too many candidates. At a 5% threshold, 20 candidates with no real effect would still produce about one false positive (20 × 0.05 = 1). Test a short list, or require a larger gap and a repeat on a second month.
- Counting beyond the early window. An action on day 20 by a user who is plainly staying is a result, not a cause.
- Small groups. A gap built on fewer than about 100 people in a group swings widely.
- One segment hiding another. The aha moment for team accounts may differ from the one for solo users. Repeat the table for the two or three segments that matter.
How do you use the aha moment once you have it?
Turn it into three things. A metric: the share of new users who reach it within 3 days, tracked weekly, which is a sharper version of the activation rate. A funnel from sign-up to the aha action with the largest loss highlighted. And an onboarding change: remove steps between sign-up and the aha, prompt the action at the moment it makes sense and send people who stall a message that points to it. Re-run the comparison each quarter, because as the product changes the best predictor can move.
How do you run this analysis in TapCub?
TapCub gives you the comparison and the measurement. It does not run the nudge experiment, since TapCub does not do A/B tests or traffic splitting, so the test itself is run in your own tool and read back in TapCub.
- Identify people. Turn on identified mode and report the login so that the analysis counts people, not devices; the default analysis identity is the person where one exists, otherwise the device. See how to identify users.
- Build the table with SQL. In All-platform analytics › Behavior › Metrics & SQL, use the SQL tab to write one query over the event view that flags, per person, whether they did each candidate in the first 3 days and whether they were active in days 24 to 30. Run it once per candidate and read the two retention rates.
- Check the shape in retention. In All-platform analytics › Behavior › Behavior analysis, build a retention report starting from the sign-up event and returning on any activity, filter to the group that did the action, and compare with the group that did not; the report shows cohorts by period and a size-weighted average.
- Build the funnel to the aha. Make a funnel from sign-up to the aha action and read the step with the largest drop and the median time between steps.
- Track it. Map activation to the aha action in the business settings behind All-platform analytics › Business › AARRR growth so that activation is measured against it, and annotate onboarding changes in Configuration › Annotations.
FAQ
What is an aha moment?
The point at which a new user first realizes what the product is worth to them. In data terms it is an early action, such as inviting a teammate, that separates users who stay from users who leave.
How do you find your product's aha moment?
Define retained users and a 3-day early window, list candidate actions, compare retention for people who did each action and people who did not, then find the threshold. Pick the action with a large gap, wide reach and a stated threshold, and test whether it causes retention.
What is an example of an aha moment?
In the sample, new users who invited 2 or more teammates in their first 3 days were retained at 68.4% against 16.2% for those who invited none. The numbers are sample data to show the method; your own product will differ.
Is the aha moment the same as activation?
Related, not the same. Activation is the rate at which new users reach a defined first-value action. The aha moment is the action you find by analysis that best predicts retention, and it is often what you then define activation as.
How many candidates should you test?
A short list of 8 to 15 that you could plausibly encourage. With more, false positives creep in: 20 candidates at a 5% threshold produce about one by chance. Repeat the analysis on a second month before you act.
Sources
- NIST/SEMATECH e-Handbook of Statistical Methods, 7.3.3 Do two processes produce the same proportion of defectives? — the two-proportion z-test and its critical values, used for the comparisons and the sample size. Checked 2026-11-21.
- Ron Kohavi, Alex Deng, Brian Frasca, Toby Walker, Ya Xu and Nils Pohlmann, Online Controlled Experiments at Large Scale, KDD 2013 — why controlled experiments, not observation alone, are used to confirm a cause. Checked 2026-11-21.
Was this article helpful?
We use your answers to fix and expand this page.
Couldn’t send. Please try again in a minute.
Thanks for the feedback. We’ll use it to improve this page.You’ve already sent feedback on this page. Thanks.

Product Experience Specialist
Writes about product experience, practical workflows, and growth, turning complex processes into clear steps for everyday decisions.