Product News · Page 2
Release notes with the reasoning attached. Each article explains a new capability, the problem it solves and the setting that enables it.
Product articles accompany larger releases. Where the changelog lists what changed, these notes explain the design decisions, show the new screens with sample data, and link to the help article for setup. Smaller changes stay in the changelog.
Articles in Product News
64 articles · page 2 of 2
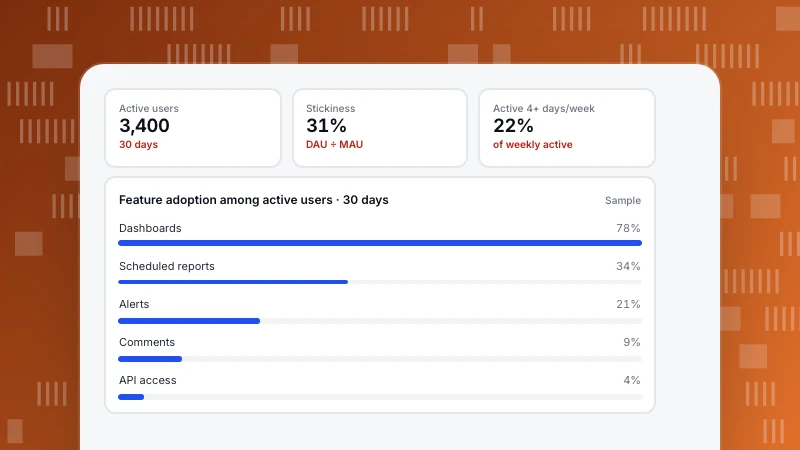
Product Usage Analytics: The Five Metrics and How to Use Them
Product usage analytics measures how people use your product: which features, how often and how deeply. Five usage metrics with formulas, user vs account views and a sample feature table that led to a decision.
Read more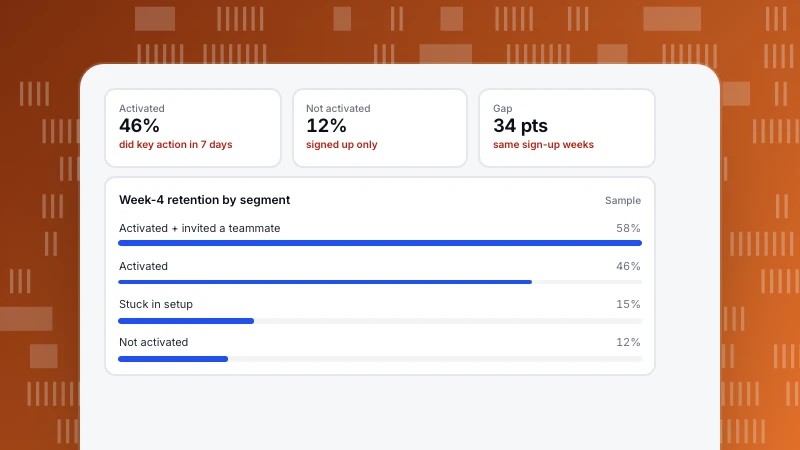
User Segmentation Examples: 12 Segments You Can Build From Event Data
Twelve user segmentation examples a product or growth team can build from event data, each with the rule and what to do with it. Plus a sample comparing two segments and how to keep segments useful.
Read more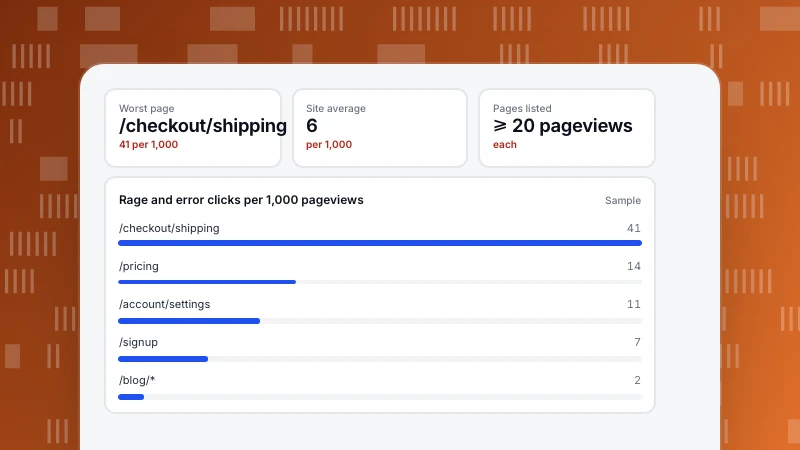
User Friction: How to Find It in Your Data and Fix It
User friction is anything that slows people down or stops them reaching their goal. The signals that reveal it in behaviour data, a sample where rage clicks pointed to the fix, and a routine for ranking friction points.
Read more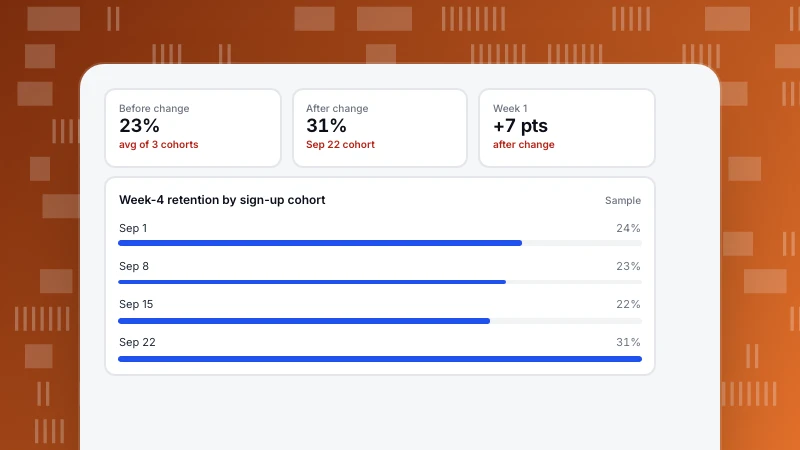
How to Do Cohort Analysis: Six Steps and How to Read the Table
A step-by-step guide to cohort analysis: choose the start and return events, the period and the counting mode, then read the table by rows, columns and diagonals. With a sample weekly cohort table.
Read more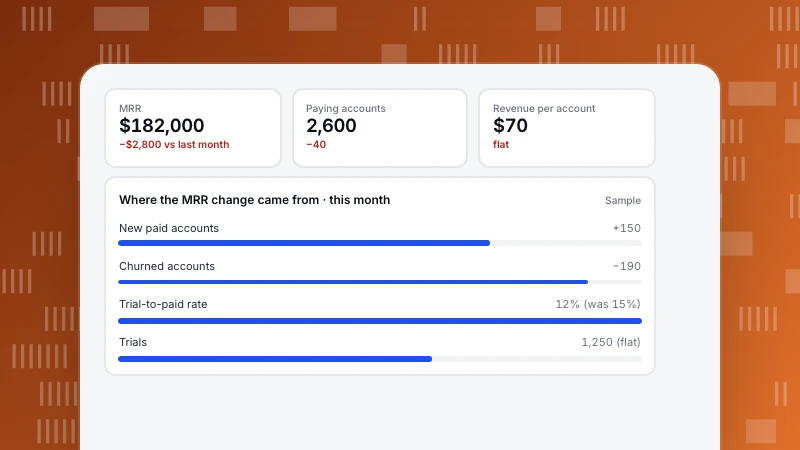
Metric Tree: How to Build One and Use It to Explain Changes
A metric tree breaks one top metric into the drivers that produce it. How to build one in five steps, a sample tree with numbers, how to use it to explain a drop, and how to keep it in your analytics.
Read more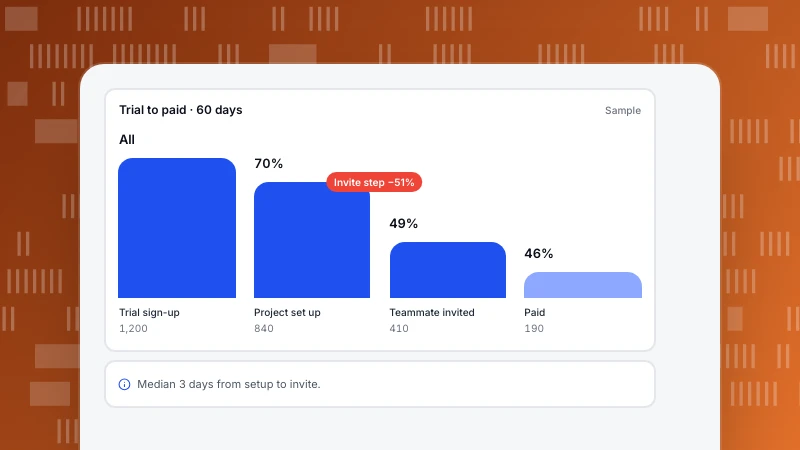
Customer Journey Analytics: From Journey Map to Measured Paths
Customer journey analytics measures how people actually move from first visit to purchase and beyond. The four analyses it is built from, which question each answers, and a sample from trial to paid.
Read more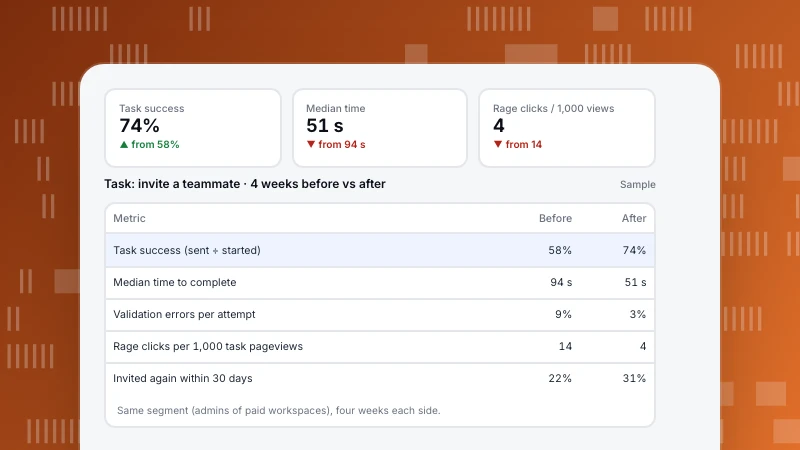
UX Analytics: Measure Whether a Task Got Easier
UX analytics uses behaviour data to measure how easy it is for people to complete tasks in your product or site. Five task metrics, how to define them in events, and a before-and-after example of a redesigned flow.
Read more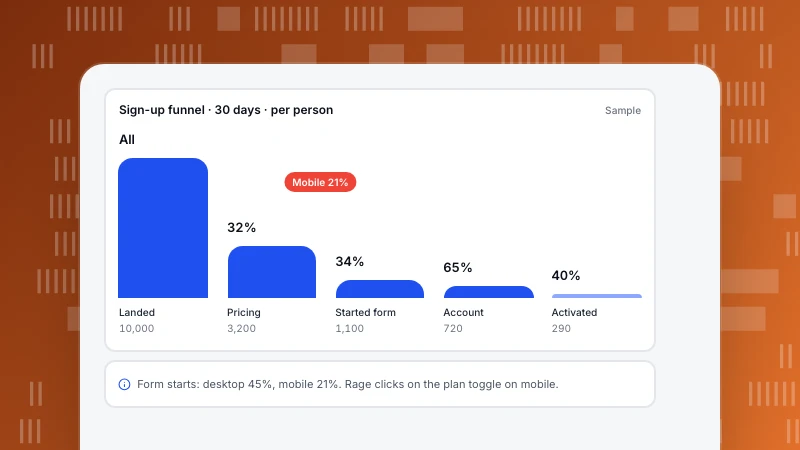
Conversion Funnel Optimization: Pick the Step You Can Move, Not the Biggest Drop
Funnel steps multiply, so a 10% lift on any step adds 10% to the end result. How that changes which step to optimise, a six-step loop from measurement to test, and a worked SaaS sign-up funnel.
Read more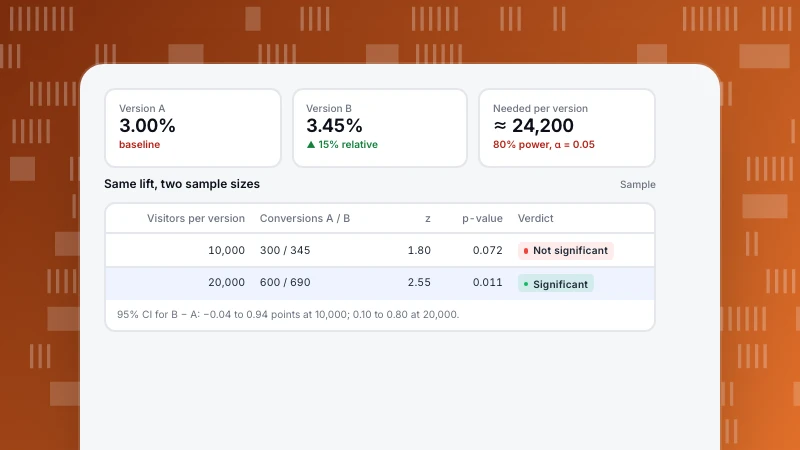
How to Calculate Statistical Significance for an A/B Test
Statistical significance tells you whether a difference between two conversion rates is bigger than chance would usually produce. The five steps of a two-proportion test, a worked example by hand and in code, and how to size the test before you start.
Read more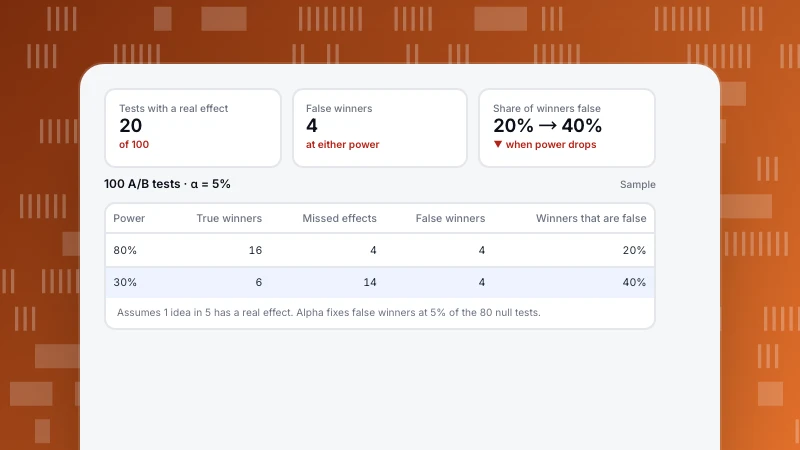
Type 1 vs Type 2 Error: What They Mean for Your A/B Tests
A type 1 error is a false positive: you call a winner that is not real. A type 2 error is a false negative: you miss an effect that is real. A worked set of 100 A/B tests shows how many winners are wrong, and why low power makes it worse.
Read more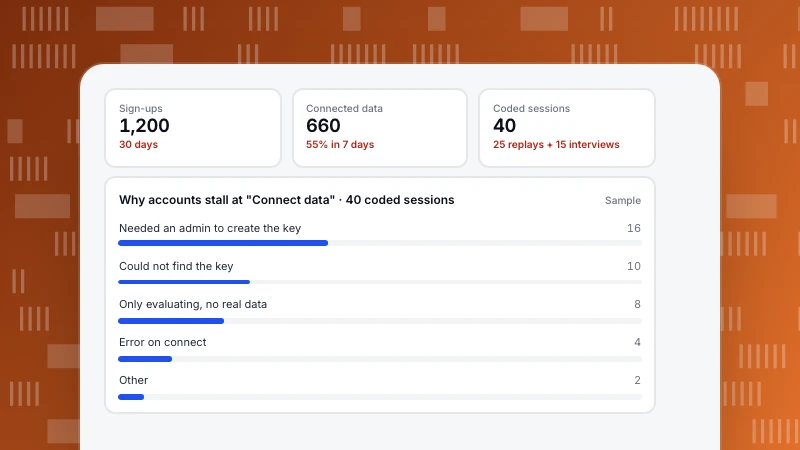
Qualitative vs Quantitative Data: What Each Tells You, and How to Use Both
Quantitative data counts and measures: how many, how often, how much. Qualitative data describes: why, how it felt, what people expected. A comparison table and a product example where numbers find a drop and interviews explain it.
Read more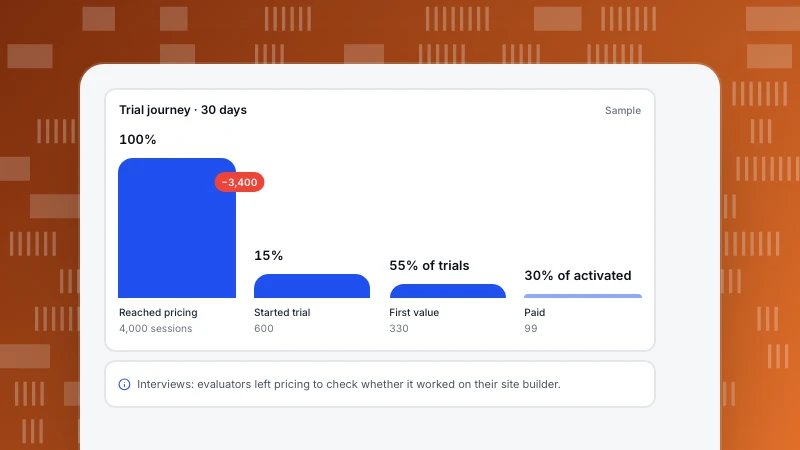
How to Create a Customer Journey Map That Uses Real Data
A customer journey map lays out the stages a customer goes through, what they do and feel at each one, and where they get stuck. Six steps to build one from research and analytics, with a filled-in SaaS example.
Read more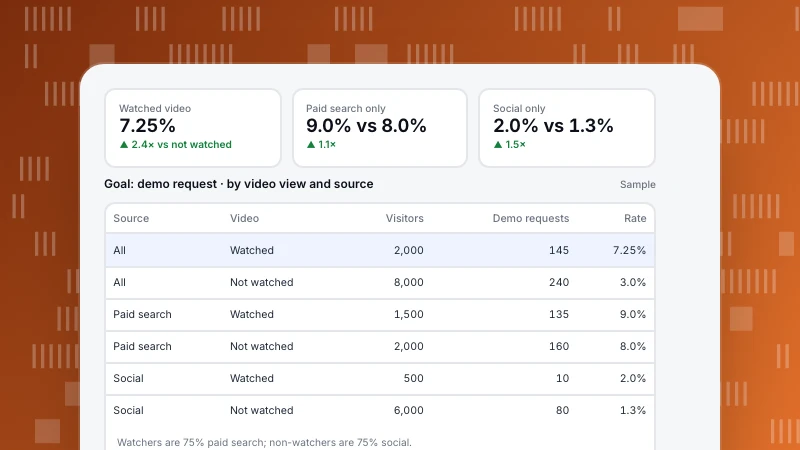
Correlation vs Causation: How to Tell Them Apart in Your Analytics
Correlation means two numbers move together; causation means one makes the other happen. A worked analytics example where a "video triples conversions" claim mostly comes from traffic source, four checks to run on any correlation, and how to test for cause.
Read more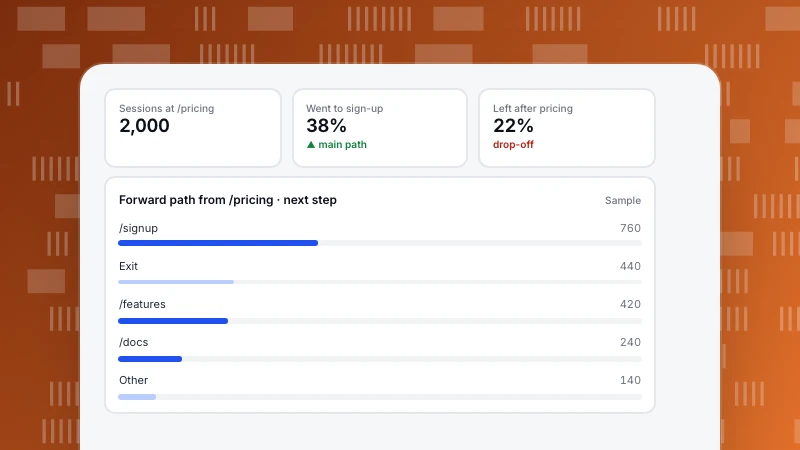
Behavioral Analytics: Five Questions, Five Analyses, and How to Start
Behavioral analytics looks at what people do on your site or product, in what order and how often, rather than how many arrived. Five questions it answers, the analysis for each, what you need tracked, and a one-week plan to start.
Read more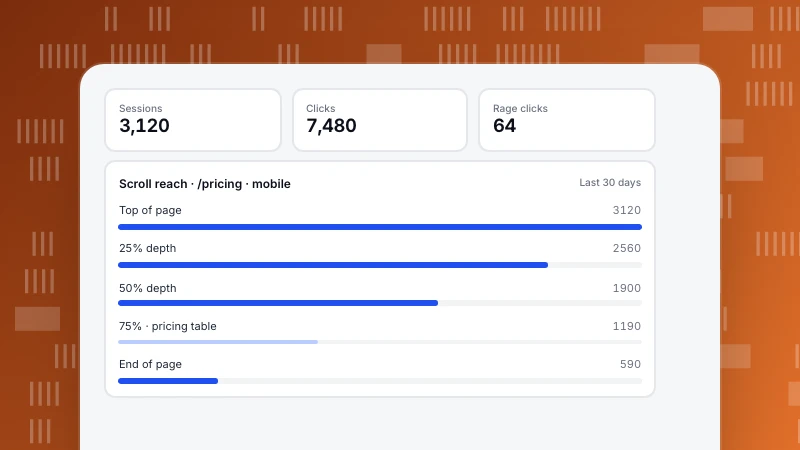
How to Read a Heatmap: Clicks, Rage Clicks and Scroll Reach
How to read a heatmap: colour is relative density, so check the legend and the base first. Then website heatmaps one by one (clicks, rage clicks, scroll reach, elements) and the checks to run before changing a page.
Read more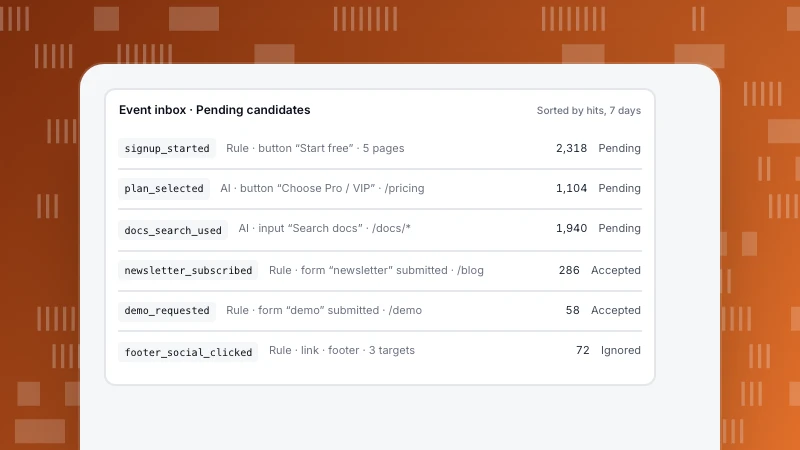
Event naming conventions: rules, mistakes, and how the event inbox drafts names
A practical event naming convention (object_action, snake_case, past tense), the mistakes that break it, and how TapCub’s event inbox turns autocaptured clicks into named events you accept, merge or ignore.
Read moreOther categories
Each category answers a recurring question we hear from customers. Start with the one closest to your job.
Analytics
Definitions, funnels, retention and the data-quality questions behind every number.
304 articlesGrowth & Marketing
Acquisition, marketing, site and app operations, and how to pick the one stage worth fixing first.
238 articlesLive Chat
Proactive invites, translation and turning support conversations into conversions.
78 articlesAI Search
GPTBot, ClaudeBot, PerplexityBot: who fetches your pages, what the files say and what comes back.
39 articles