Try it on your own data
Every report in this article is in the free plan. One snippet for web and apps, up to 10 sites.
Start freeTo open a HAR file, drag it onto the Network panel in Chrome, Edge or Firefox DevTools, or click Import HAR; it is also plain JSON, so a text editor or jq works. Check it for cookies and tokens first. Then sort by total duration and split the slowest request into phases: in the six-request sample, 92.5% of the slowest request was server wait and 82.8% of the second was download.
What you will learn
- Open a HAR by dragging it onto DevTools' Network panel, or read the JSON with a text editor or jq; check for cookies and tokens before sharing
- Sort by total duration, then split the slowest request into wait (server) and receive (download) to know which fix applies
- In a HAR, -1 means not applicable, ssl sits inside connect, and a request's time is the sum of its non -1 timings
What you are opening: a JSON log of one page load
A HAR (HTTP Archive) file is plain JSON. It is a record of every request a browser made while loading a page, with the URL, headers, status, size and a timing breakdown for each one. Because it is JSON, you can open it in three ways, and each has a use:
| Way to open | Best for | Needs |
|---|---|---|
| Browser DevTools (Network panel) | Seeing the waterfall and clicking into requests | Chrome, Edge or Firefox |
A text editor or command line (jq, Python) | Finding the slowest request quickly, scripting, large files | Nothing, or jq |
| An online HAR viewer | Quick look with no DevTools | Uploading the file, so only for non-sensitive captures |
If you still need to create a HAR, how to capture one is covered in the help article on how to capture a HAR file, and the format itself is explained in the glossary entry for a HAR file. This guide starts from the file you already have and shows how to find the slow request in it.
First, check the file for sensitive data
A HAR can contain everything the browser sent and received, including session cookies and authorisation headers, so treat it like a password until you have checked it. Chrome's DevTools documentation describes two export modes: the default sanitized export leaves out the Cookie, Set-Cookie and Authorization headers, and a separate setting, "Allow to generate HAR with sensitive data", is needed to include them.
Before you share or upload a HAR, do this:
- Open it in a text editor and search for
cookie,authorization,token,passwordandsession. - If any real value appears, either re-export a sanitized file or replace the values with a placeholder.
- Do not drop a file with sensitive data into an online viewer; open it locally.
Response bodies are separate from headers: a HAR exported with content can include the full text of every response, such as account pages. Search for names, emails and anything that identifies a person if the capture came from a logged-in session.
Way 1: open it in Chrome DevTools
- Open DevTools (F12) and go to the Network panel.
- Drag the
.harfile onto the requests table, or click Import HAR in the action bar. The requests appear as if you had just recorded them, and DevTools shows initiators for imported requests. - Right-click the requests table header and hover over Waterfall to choose the sort order: Start Time, Response Time, End Time, Total Duration or Latency. Sort by Total Duration to see the slowest requests first.
- Click one request and open the Timing tab. You will see the phases Chrome documents: Queueing, Stalled, DNS Lookup, Initial connection (which includes the TLS handshake), Request sent, Waiting (TTFB) and Content Download.
In the waterfall bar, the lighter part is waiting time and the darker part is download time, so a long light bar means the server was slow to answer, and a long dark bar means a big or slow download.
Worked example: find the slow request in a six-request HAR
Below is a sample HAR trimmed to the part that matters, one entry:
{
  "startedDateTime": "2026-11-20T09:00:00.500Z",
  "time": 1783,
  "request": { "method": "GET", "url": "https://shop.example/api/prices" },
  "response": { "status": 200 },
  "timings": { "blocked": 120, "dns": -1, "connect": -1, "send": 1, "wait": 1650, "receive": 12 }
}
Sample data: the six requests of a made-up shop page, with timings in milliseconds.
| Request | blocked | dns | connect (incl. ssl) | send | wait | receive | time |
|---|---|---|---|---|---|---|---|
| shop.example/ | 2 | 18 | 40 (25) | 1 | 210 | 35 | 306 |
| shop.example/app.css | 3 | -1 | -1 | 1 | 60 | 22 | 86 |
| shop.example/app.js | 3 | -1 | -1 | 1 | 75 | 140 | 219 |
| shop.example/hero.jpg | 4 | -1 | -1 | 1 | 95 | 480 | 580 |
| shop.example/api/prices | 120 | -1 | -1 | 1 | 1,650 | 12 | 1,783 |
| cdn.example/font.woff2 | 5 | 22 | 35 (20) | 1 | 48 | 30 | 141 |
Check the table the way the HAR format defines it. Each timing is in milliseconds. A value of -1 means the phase does not apply, for example connect is -1 when an existing connection is reused. The ssl time is already included in connect, so it is not added again. The entry's time is the sum of its timings that are not -1. For the first row: 2 + 18 + 40 + 1 + 210 + 35 = 306, and the 25 ms of TLS is inside the 40. For the price request: 120 + 1 + 1,650 + 12 = 1,783.
Now read it:
- The slowest request is
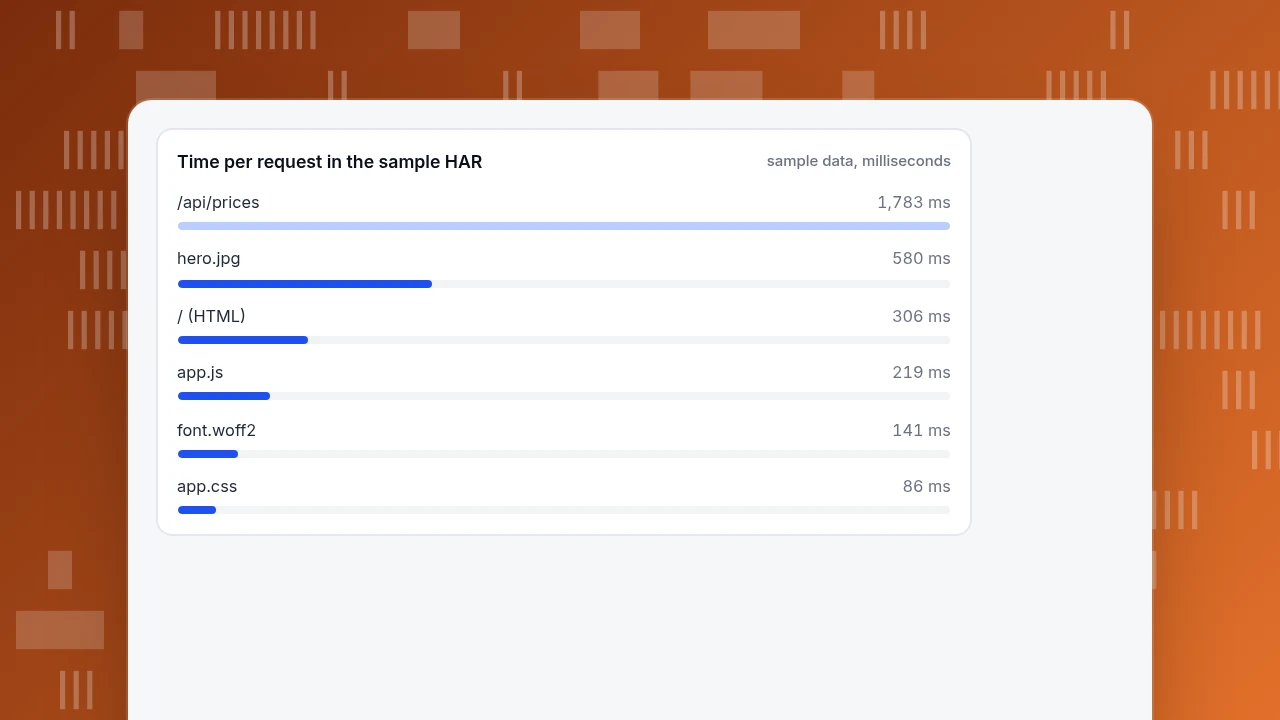
/api/prices, at 1,783 ms. Of that,waitis 1,650 ms, or 1,650 ÷ 1,783 = 92.5%. The browser sent the request in 1 ms and then waited. That is server time (or a slow upstream), not network and not file size. The fix is on the server: caching, a query, or an upstream call. - The second slowest is
hero.jpg, at 580 ms. Herereceiveis 480 ms, or 480 ÷ 580 = 82.8%. The server answered in 95 ms but the file took 480 ms to download: it is large. The fix is compression, a smaller size or a modern image format. - The
blocked120 ms on the price request is time in a queue before it could be sent, which usually means the browser had other requests competing for connections.
Same page, two different problems that need two different fixes, and the timings told you which without guessing. The sum of all six time values is 3,115 ms, which is not the page load time, because requests overlap; the waterfall, not the sum, shows what sets the finish line.
Time per request in the sample HAR
sample data, millisecondsWay 2: find it from the command line or a script
For a large HAR, you can go straight to the numbers. With jq installed, list the three slowest requests:
jq -r '.log.entries | sort_by(-.time)[:3][] | [.time, .timings.wait, .timings.receive, .request.url] | @tsv' page.harRun on the sample, this prints the price request, then the hero image, then the HTML. The same thing in Python:
import json
har = json.load(open("page.har"))
for e in sorted(har["log"]["entries"], key=lambda e: -e["time"])[:3]:
    t = e["timings"]
    print(e["time"], t["wait"], t["receive"], e["request"]["url"])
Two checks keep you honest. First, confirm log.version and log.creator at the top so you know which tool wrote the file; some exporters omit optional timings and the sum will not match. Second, if an entry's time is much larger than the sum of its timings, the exporter put extra time somewhere and you should trust the individual phases less.
What the common timing patterns mean
| Pattern in the Timing tab or HAR | What it usually means | What to try |
|---|---|---|
Long wait (TTFB) | Slow server or slow upstream service | Caching, database or API work, a closer server |
Long receive | Large response or slow network | Compress, resize, split the file |
Long blocked | Waiting for a free connection or a higher-priority request | Fewer requests, preloading the important one |
Long dns or connect | First visit to a host, many hosts | Fewer third-party hosts, preconnect |
| Status 4xx or 5xx | A failing request | Open it, read the response |
| Many requests of the same size | A loop or polling | Check the script that makes them |
A HAR is one capture from one machine and one network. Take two or three, and treat the pattern as real only if it repeats. For the real-world spread across all visitors, see below.
| Pattern | What it usually means | What to try |
|---|---|---|
| Long wait (TTFB) | Slow server or upstream | Caching, query or API work, closer server |
| Long receive | Large response or slow network | Compress, resize, split the file |
| Long blocked | Waiting for a free connection | Fewer requests, preload the important one |
| Long dns or connect | First visit to a host, many hosts | Fewer third-party hosts, preconnect |
| Status 4xx or 5xx | A failing request | Open it and read the response |
| Many same-size requests | A loop or polling | Check the script making them |
A HAR is one capture from one machine; repeat it two or three times before trusting a pattern.
How to use a HAR with TapCub
TapCub does not open or parse HAR files, and its data import page accepts CSV events, CSV user properties and server logs, not HAR. What TapCub gives you is the context a HAR lacks: which page is slow for real visitors, so you know what to capture.
- Choose the page to capture. In Monitoring › Performance, group by page and read the slowest pages list, which is ranked by P75 largest contentful paint. A single HAR is only as useful as the page you pick.
- Predict what the HAR will show. The load split in the same report divides a load into backend response (time to first byte), network transfer and front-end rendering. A large backend share points to a long
waitlike the price request; a large network share points to a longreceivelike the hero image. - Capture and open the HAR as above, and confirm.
- Check errors too. If a request in the HAR returns 4xx or 5xx, Monitoring › Errors shows whether script errors are also hitting real visitors on that page.
- After the fix, add the release date in Configuration › Annotations and re-read the P75 for the page in Monitoring › Performance after the next visits arrive. Real visitors are the test; your HAR is only the diagnosis.
If the page performance report is empty, the script may be blocked or out of date, because TapCub does not estimate from the server.
FAQ
How do I open a HAR file?
Drag it onto the Network panel in Chrome, Edge or Firefox DevTools, or click Import HAR. You can also open it in a text editor, because it is plain JSON, or use jq or Python to sort requests by time.
What program opens a HAR file?
Any browser's developer tools, a text editor, a command-line JSON tool, or an online HAR viewer. Prefer local tools for files that came from a logged-in session, since uploads leave your machine.
Is it safe to share a HAR file?
Not before checking. HAR files can contain cookies, authorization headers and response bodies. Chrome's default export omits the Cookie, Set-Cookie and Authorization headers, but you should still search the file for tokens and personal data before sending it.
How do I find the slowest request in a HAR?
Sort by each request's time, or by Total Duration in DevTools, then split it into phases. In the sample, /api/prices took 1,783 ms with 1,650 ms of wait, which points to the server rather than the network.
What does -1 mean in a HAR timing?
It means the phase does not apply to that request, for example no new connection was needed. Entry time equals the sum of the timings that are not -1, and the ssl time is already part of connect.
Sources
- Chrome for Developers. Network features reference: import by drag and drop or Import HAR, sanitized export, Timing tab phases, waterfall sorting. Checked 2026-11-20.
- Web Performance Working Group (W3C). HTTP Archive (HAR) 1.2 draft: timings fields in milliseconds, -1 for not applicable, ssl included in connect, time as sum of timings. This is a historical draft marked abandoned, but it is the format exporters follow. Checked 2026-11-20.
Was this article helpful?
We use your answers to fix and expand this page.
Couldn’t send. Please try again in a minute.
Thanks for the feedback. We’ll use it to improve this page.You’ve already sent feedback on this page. Thanks.

Product Experience Specialist
Writes about product experience, practical workflows, and growth, turning complex processes into clear steps for everyday decisions.