Metrics · Page 2
77 articles tagged “Metrics”. Tags cut across categories, so you may find analytics, chat and product notes side by side.
Tagged Metrics
77 articles · page 2 of 2
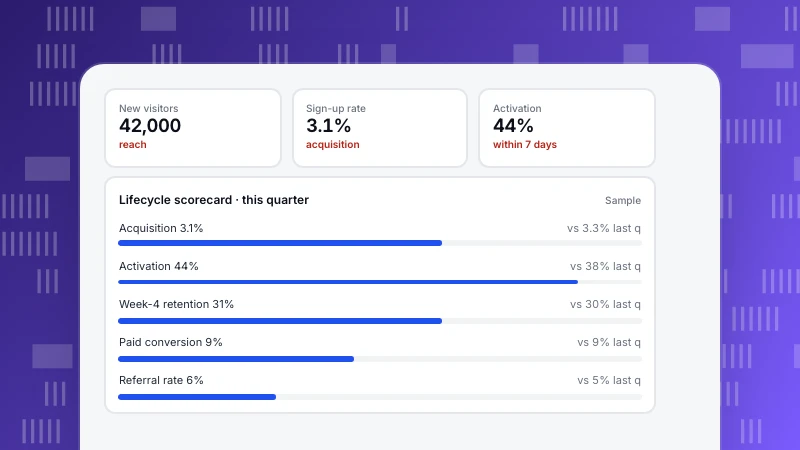
Customer Lifecycle Metrics: One Number per Stage, and How to Read Them
Customer lifecycle metrics measure how people move from first visit to loyal customer. One metric per stage with its formula, a sample scorecard, and how lifecycle states show movement between stages.
Read more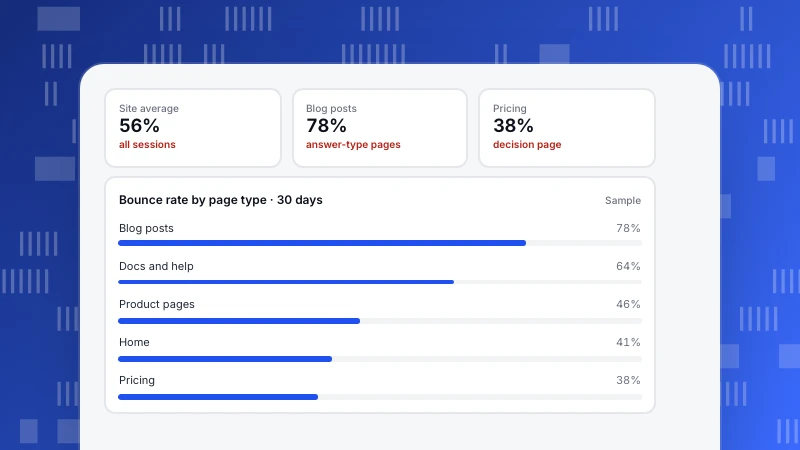
What Is a Good Bounce Rate? Judge It by Page Type, Not One Number
There is no single good bounce rate. What bounce rate measures, why a site-wide average misleads, a sample by page type, when a high rate is a real problem, and how to set your own target.
Read more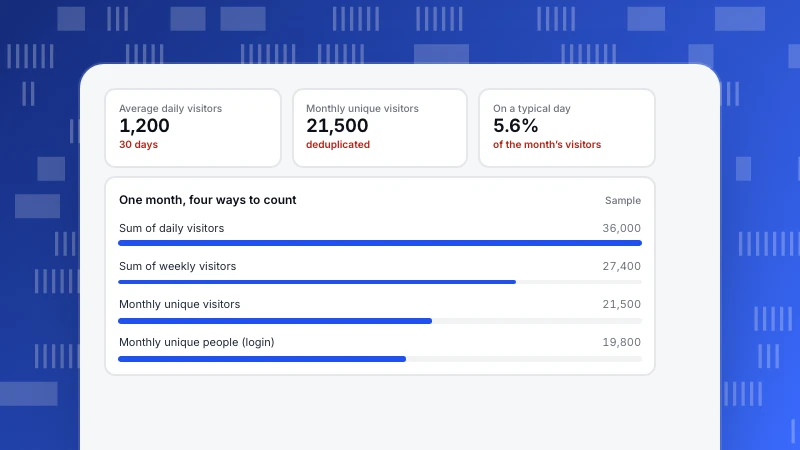
Monthly Unique Visitors: How They Are Counted, and Which Number to Quote
Monthly unique visitors are the distinct people (in practice, browsers or devices) who visited at least once in a month. Why summing days overstates it, how the counting method changes it, and how to report it.
Read more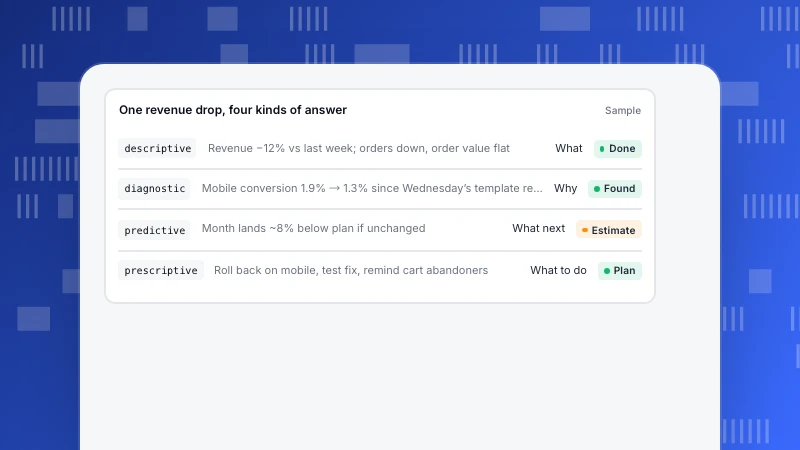
The 4 Types of Data Analytics, Followed Through One Real Question
Descriptive analytics says what happened, diagnostic why, predictive what will happen, and prescriptive what to do. One store’s revenue drop followed through all four, with the method and data each step needs.
Read more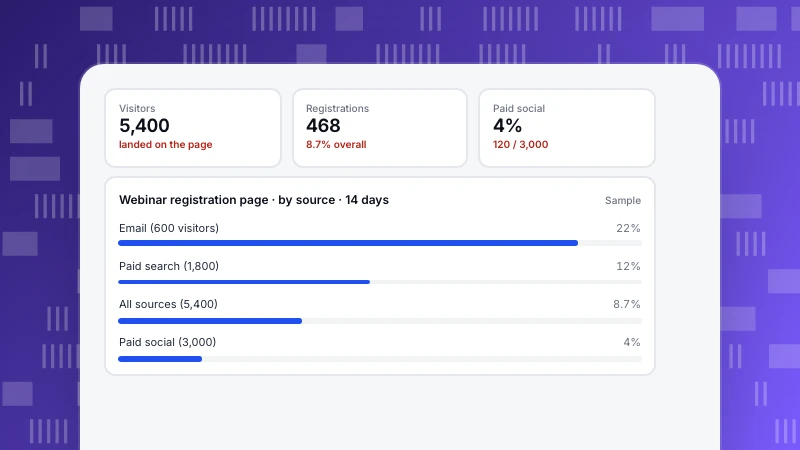
Landing Page Conversion Rate: Calculate It per Source, Then Improve It
Landing page conversion rate is the share of visitors to a landing page who complete its goal. How to calculate it, why one page has a different rate for each traffic source, and a checklist ordered by what usually moves it most.
Read more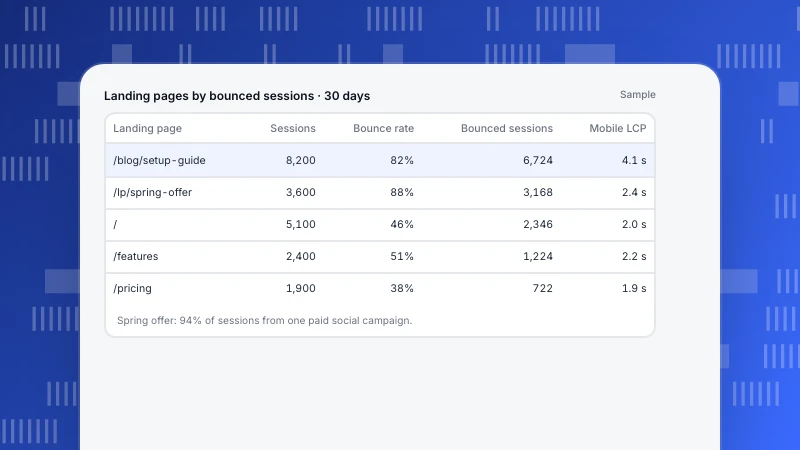
How to Reduce Bounce Rate: Find the Pages That Matter, Then Fix the Cause
Reducing bounce rate starts with knowing what your tool counts as a bounce and which pages lose the most visitors. How to rank landing pages, diagnose the cause by source and device, and apply the fix that matches it.
Read more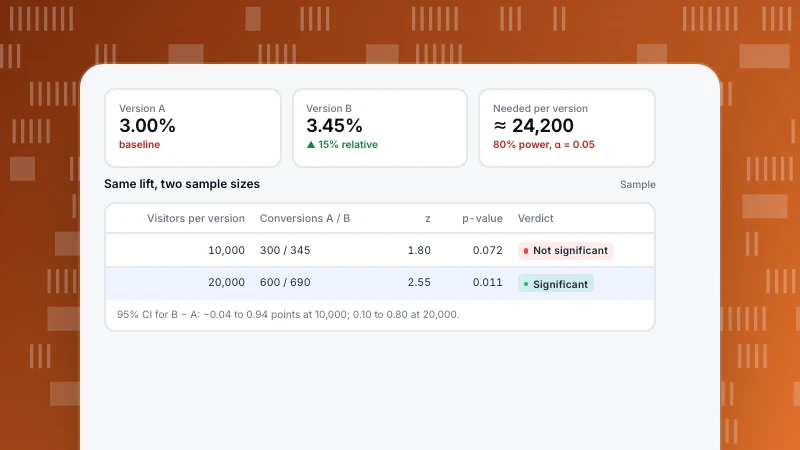
How to Calculate Statistical Significance for an A/B Test
Statistical significance tells you whether a difference between two conversion rates is bigger than chance would usually produce. The five steps of a two-proportion test, a worked example by hand and in code, and how to size the test before you start.
Read more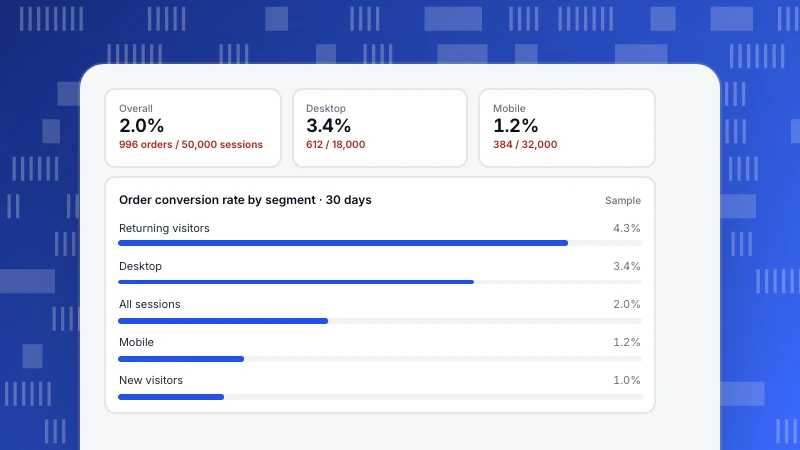
What Is a Good Conversion Rate? How to Judge Yours
A good conversion rate depends on what you count as a conversion, what you divide by, and who your visitors are. Rough ranges by conversion type, the two denominators that change the number, and how to judge your own rate by splitting it.
Read more
Type 1 vs Type 2 Error: What They Mean for Your A/B Tests
A type 1 error is a false positive: you call a winner that is not real. A type 2 error is a false negative: you miss an effect that is real. A worked set of 100 A/B tests shows how many winners are wrong, and why low power makes it worse.
Read more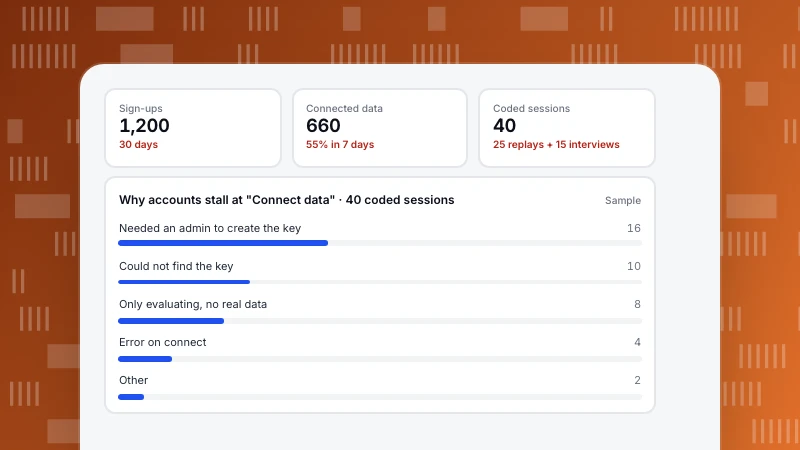
Qualitative vs Quantitative Data: What Each Tells You, and How to Use Both
Quantitative data counts and measures: how many, how often, how much. Qualitative data describes: why, how it felt, what people expected. A comparison table and a product example where numbers find a drop and interviews explain it.
Read more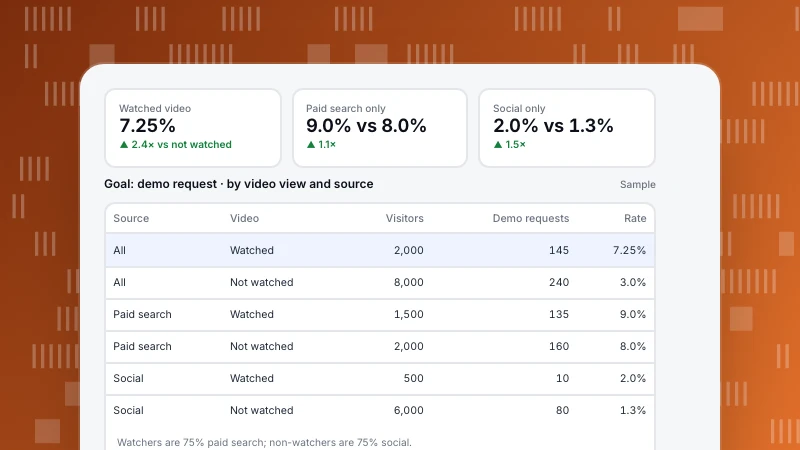
Correlation vs Causation: How to Tell Them Apart in Your Analytics
Correlation means two numbers move together; causation means one makes the other happen. A worked analytics example where a "video triples conversions" claim mostly comes from traffic source, four checks to run on any correlation, and how to test for cause.
Read more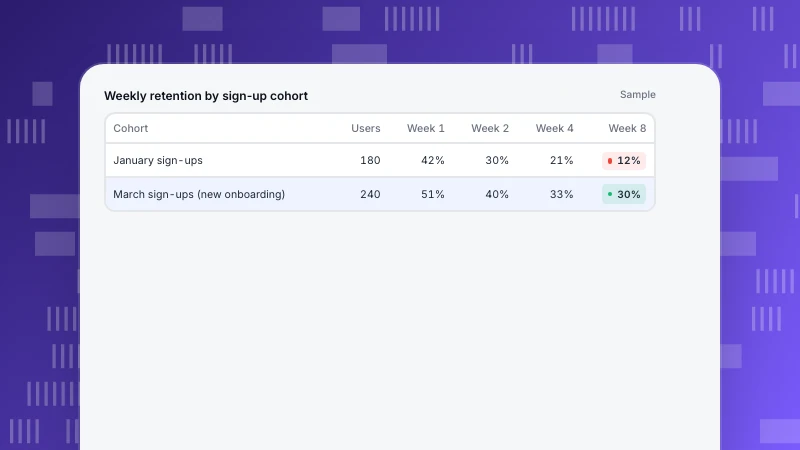
Startup Metrics by Stage: What to Measure Before and After Product-Market Fit
The right startup metrics depend on stage. What to measure before product-market fit, in early traction and in growth, the question each metric answers, the few events to instrument, and why a flattening retention curve matters more than any total.
Read more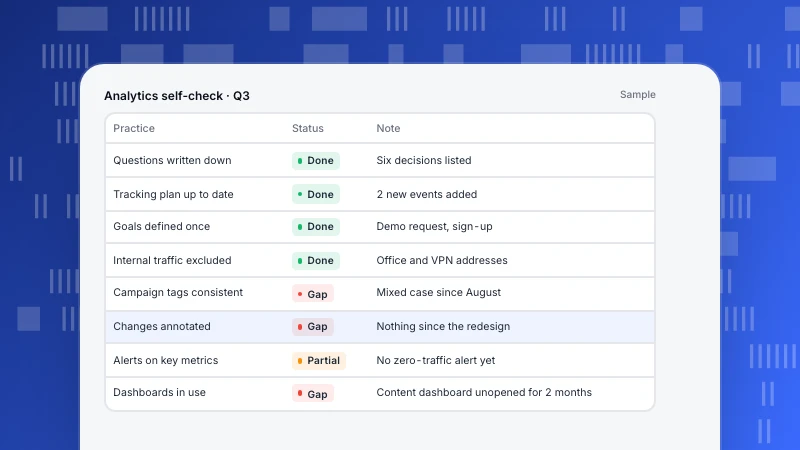
Web Analytics Best Practices: 12 Habits That Keep Data Trustworthy
Twelve web analytics best practices in four groups, plan, collect, read and act, each with a quick way to check you are following it. The habits that keep numbers trustworthy and make sure someone actually uses them.
Read more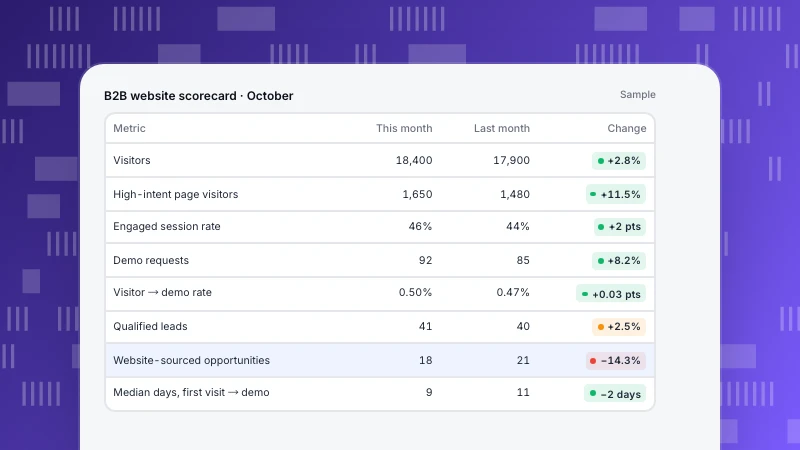
B2B Website Metrics: What to Track From First Visit to Pipeline
B2B buyers research anonymously, in groups, over weeks. The website metrics that reflect that, from high-intent page visits to lead-to-opportunity rate and time to convert, with formulas and a sample monthly scorecard.
Read more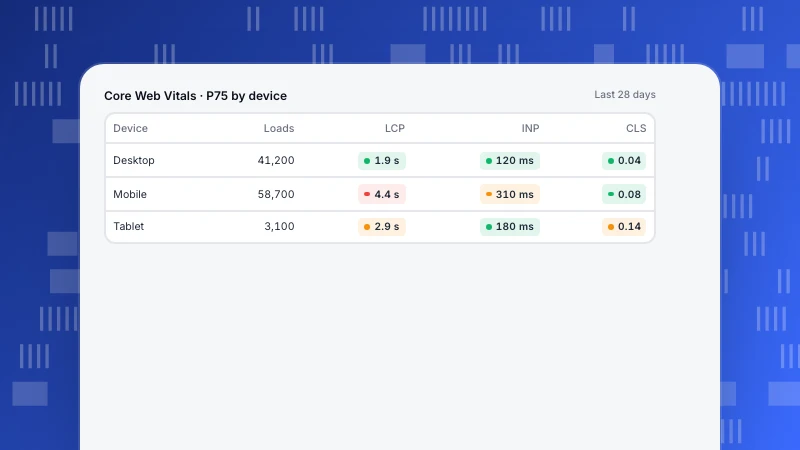
Real User Monitoring: How to Read Speed Data from Real Visits
Real user monitoring (RUM) measures speed in visitors' own browsers. How it differs from synthetic tests, why P75 by device is the default view, how small samples mislead, and how to turn a slow segment into a fix.
Read more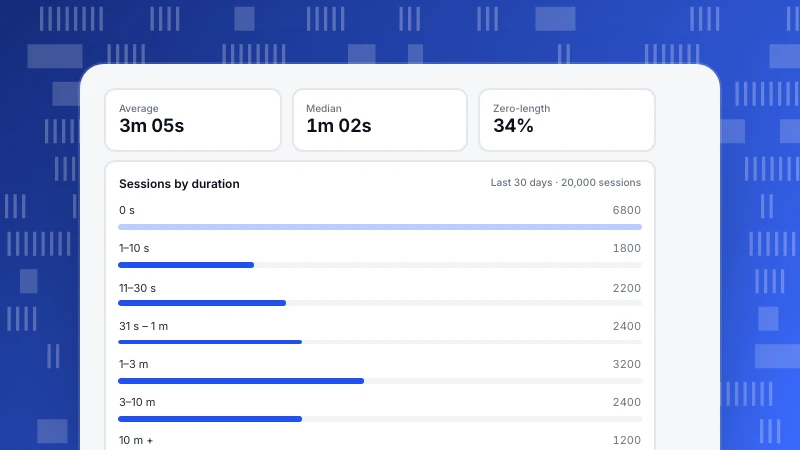
Average Session Duration: How It's Calculated and Why the Mean Misleads
Average session duration is the last event minus the first, averaged over sessions. Why one-page sessions often count as zero, how a few long sessions inflate the mean, and how to read it as a distribution instead.
Read more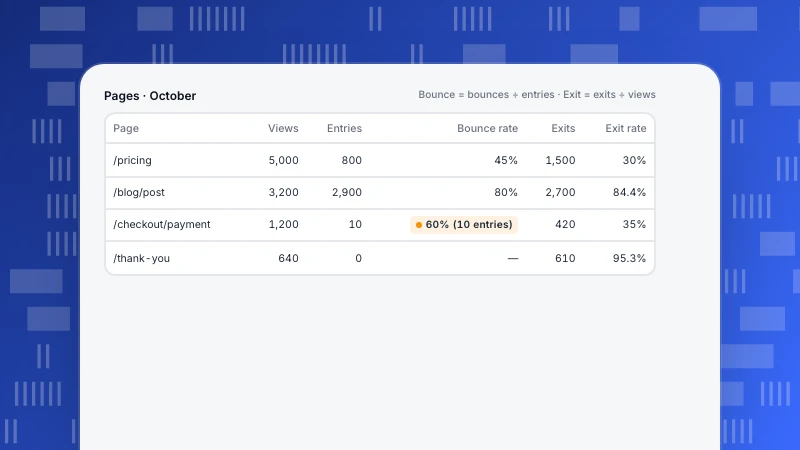
Bounce Rate vs Exit Rate: Different Denominators, Different Questions
Bounce rate divides single-page sessions by sessions that started on a page; exit rate divides exits by every view of that page. A worked table, which pages each one fits, and the mistakes to avoid.
Read more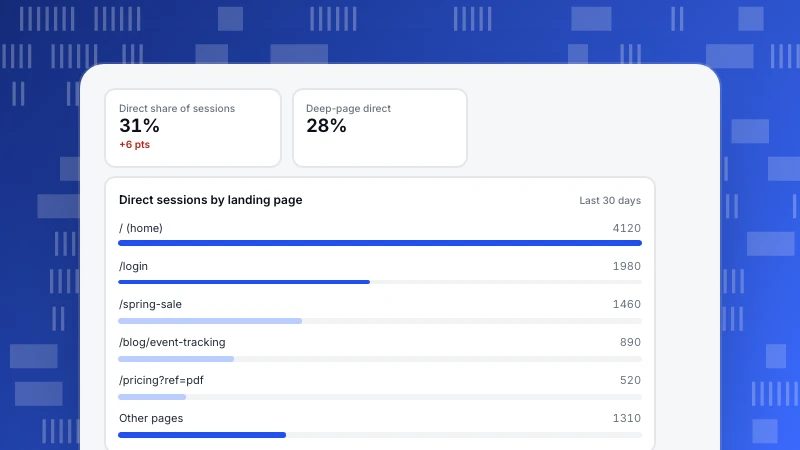
Direct Traffic: What Ends Up in It and How to Shrink It
Direct traffic is where visits land when the source is lost. Read the landing pages inside it to separate real direct visits from untagged email, apps and stripped referrers, then fix each cause.
Read more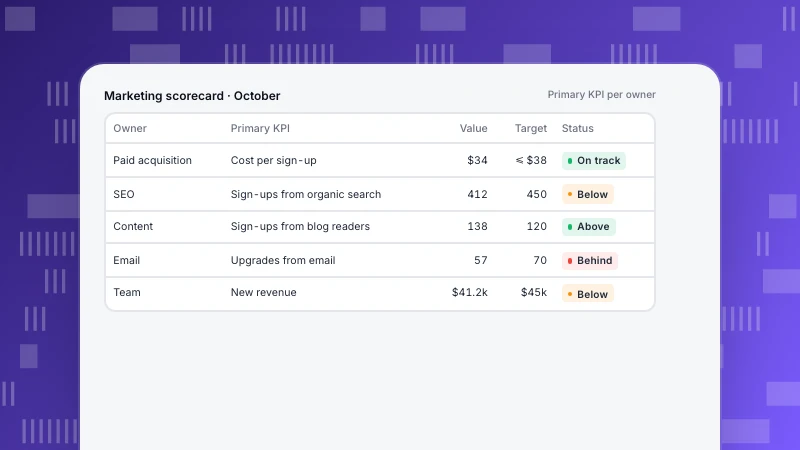
Marketing KPIs: Build a Tree from Revenue Down to Each Channel
Marketing KPIs organised as a tree from revenue down to channel inputs, with one primary KPI per channel owner, platform numbers kept apart from outcomes measured on your site, and a review cadence.
Read more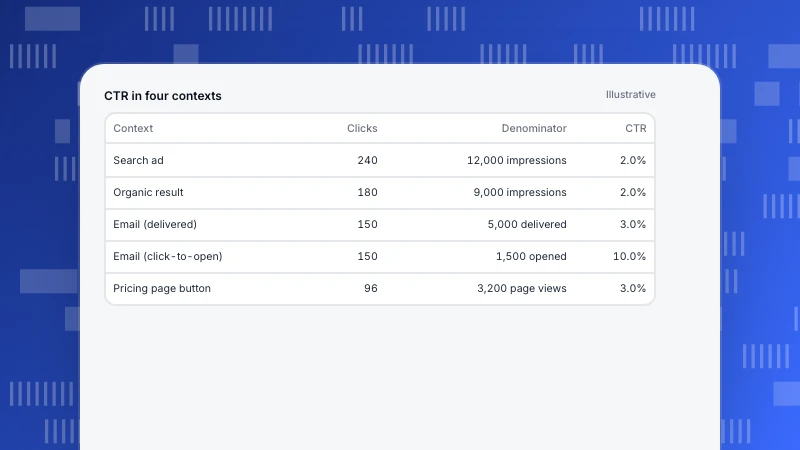
How to Calculate CTR: One Formula, Four Different Denominators
How to calculate click-through rate for ads, search results, emails and on-site buttons, with worked examples, the denominator each one uses, CTR vs conversion rate, and what inflates the number.
Read more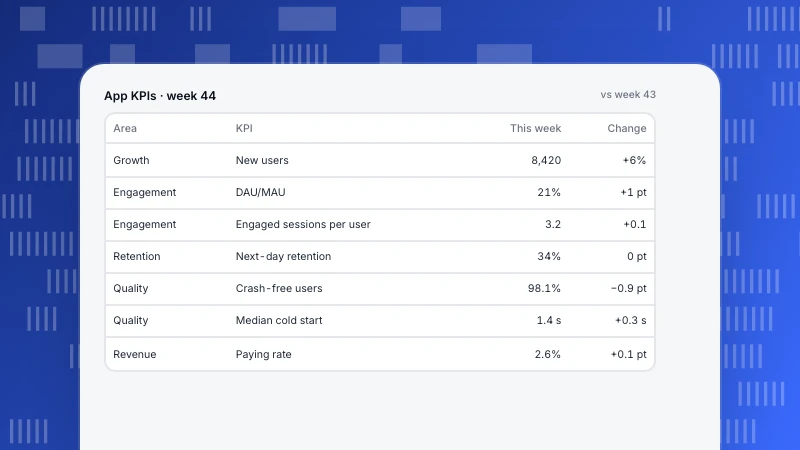
Mobile App KPIs: A Short List with Exact Counting Rules
Mobile app KPIs grouped into growth, engagement, retention, quality and revenue, with the counting rules that change the numbers and how to read them by app version and install channel.
Read more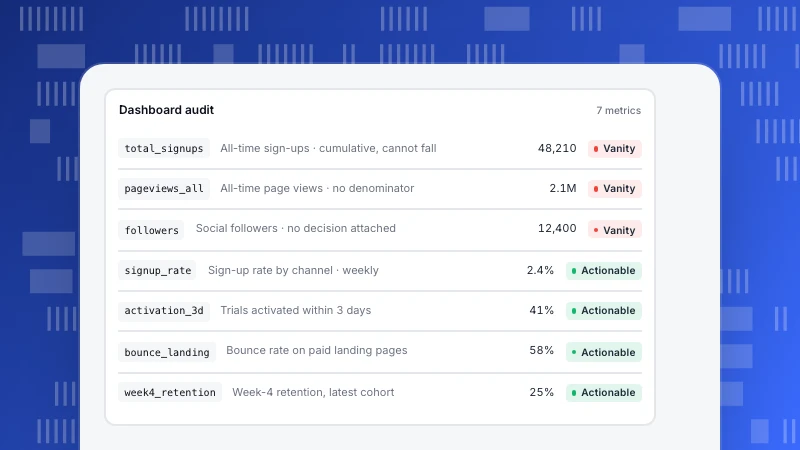
Actionable Metrics: A Test, Rewrites and Decision Rules
How to tell an actionable metric from a vanity metric with five questions, rewrites of common vanity metrics, and the decision-rule format that turns a dashboard number into an action.
Read more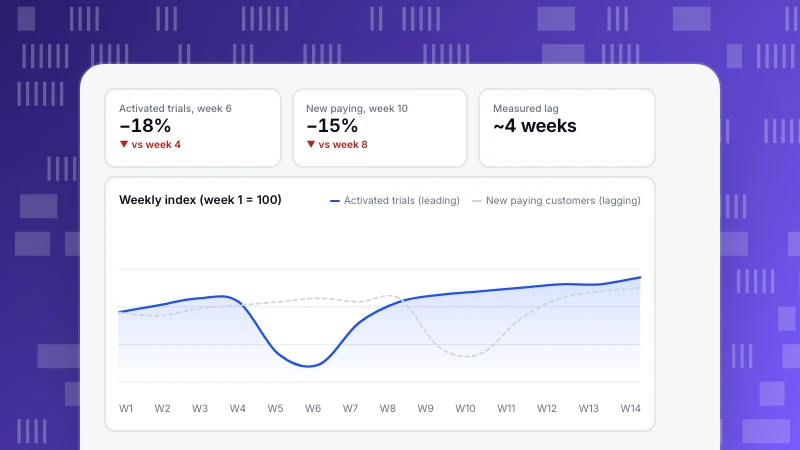
Leading vs Lagging Indicators for Product and Growth Teams
Leading vs lagging indicators with product and website examples by funnel stage, a method to find and validate a leading indicator in your own data, and how to alert on it.
Read more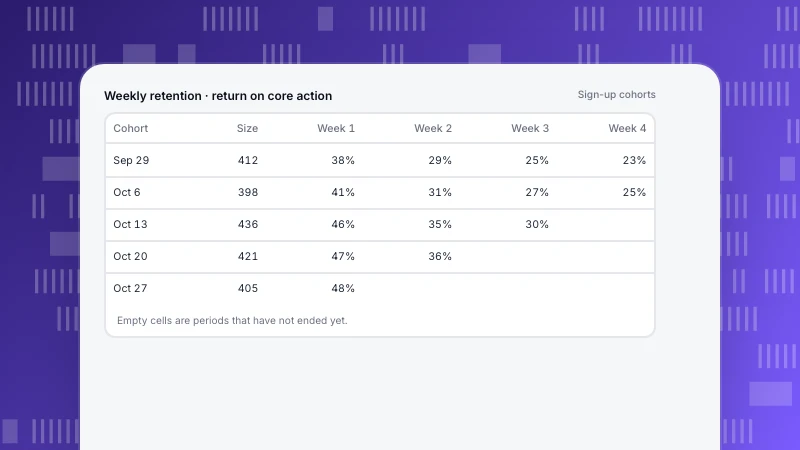
Retention Metrics: Which Rate to Use and How to Calculate It
The retention metrics that actually differ, how to calculate retention rate with a worked example, the counting choices that change the number, and which metric fits which business.
Read more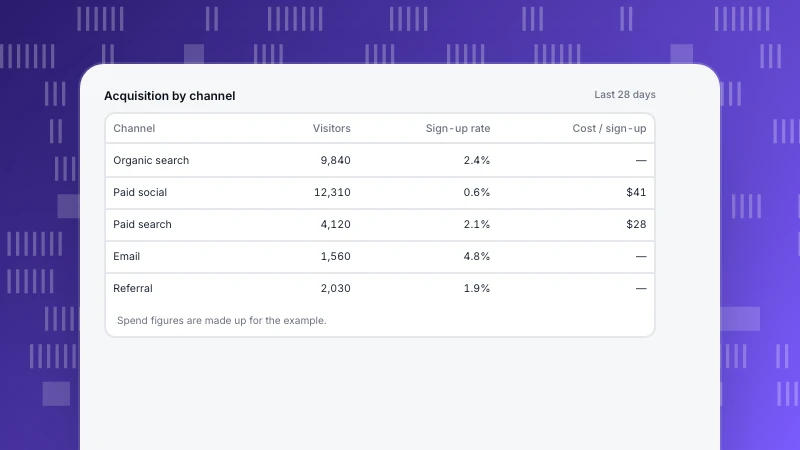
Acquisition Metrics: How to Measure Each Channel, Not Just Traffic
Acquisition metrics in three layers (volume, quality, cost), measured per channel and joined to sign-ups and revenue, plus why channel numbers never agree between tools.
Read more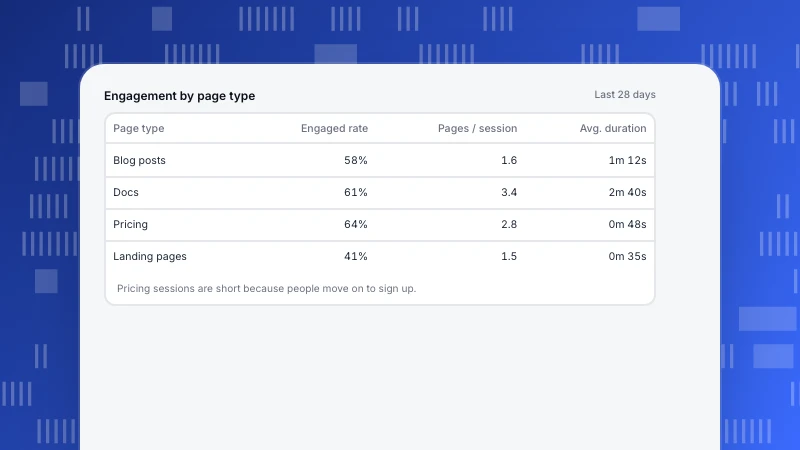
Engagement Metrics: What to Measure on a Site and in a Product
Engagement metrics for websites and products with formulas and blind spots, how engaged sessions are counted, and how to raise user engagement without gaming the number.
Read more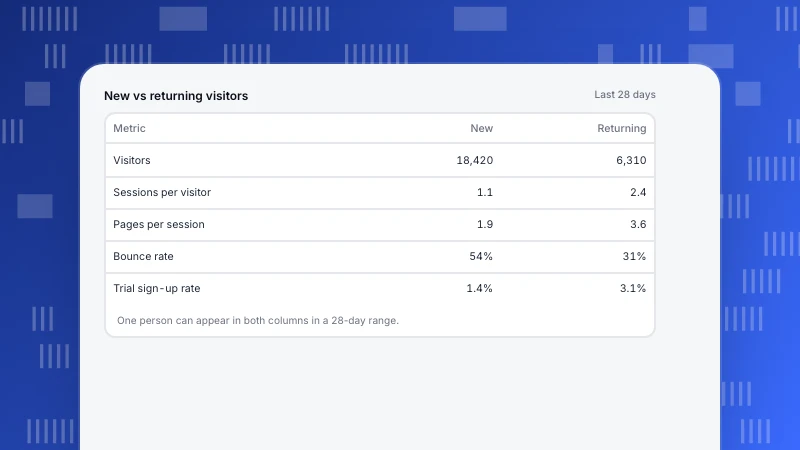
New vs Returning Users: What the Split Means and Why It Lies
How analytics tools decide whether a visitor is new or returning, why the two groups never add up to the total, what makes returning people look new, and how to use the split.
Read more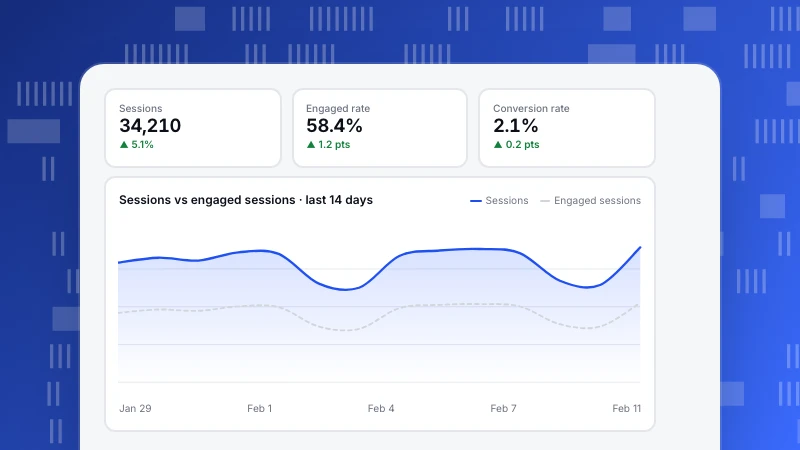
Analytics Metrics: 12 Website Metrics, Formulas and Traps
The 12 website analytics metrics worth reporting, grouped into traffic, engagement, conversion and quality, each with its formula, what it tells you and the trap that makes it misleading.
Read more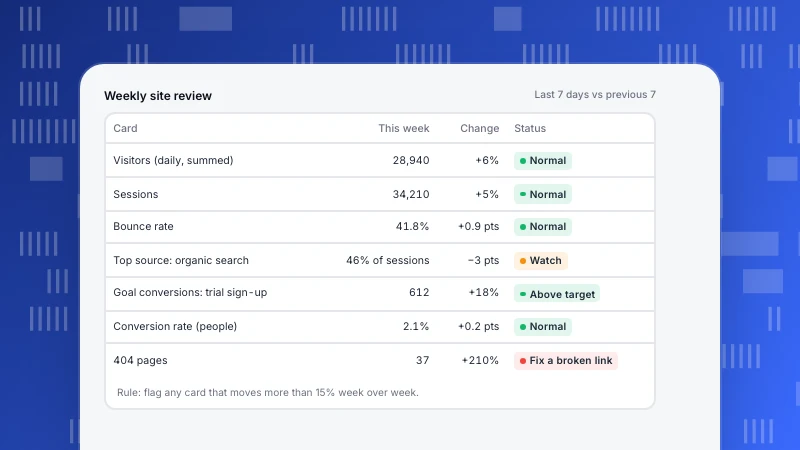
Analytics Dashboard: What to Put on It, by Role (Template)
An analytics dashboard should answer one person's recurring question on one screen. Layouts by role, a weekly website template, six build steps and the mistakes that make dashboards lie.
Read more