Try it on your own data
Every report in this article is in the free plan. One snippet for web and apps, up to 10 sites.
Start freeA QR code is just a link printed on something. To track it, you track the link: add UTM parameters that name the placement, and your analytics tool counts each scan that opens the page as a session from that campaign. From there you can follow scans through to sign-ups and orders. This guide shows the set-up, naming, and a sample comparing three placements.
What you will learn
- Put UTM parameters on the QR link, one code per placement
- Analytics counts scans that open the page; generator counts include scans that never load
- Compare placements by outcomes such as orders, not just by scans
How QR tracking works
A QR code holds a URL. When someone scans it, their phone opens that URL. If the URL carries UTM parameters, your analytics tool records the visit with the source, medium and campaign you chose. Without them, scans usually show up as direct traffic, because a camera app sends no referrer.
So "tracking QR codes" comes down to three things: tag the link, use a separate code per placement, and connect the visit to an outcome.
Step 1: Tag the link
Add UTM parameters to the landing URL before you generate the code. The table shows a naming scheme for three placements in one campaign. A few rules:
- One code per placement. A code on packaging and one on a poster need different
utm_sourceorutm_contentvalues, or you cannot tell them apart. - Keep
utm_medium=qrfor every printed code, so all scans group together. - Lowercase everything. Reports treat
Posterandposteras two rows.
The free UTM link builder normalises values and gives you a copy-ready link.
| Placement | utm_source | utm_medium | utm_campaign | utm_content |
|---|---|---|---|---|
| Product packaging | packaging | qr | spring-2026 | box-insert |
| Trade show stand | expo-berlin | qr | spring-2026 | stand-banner |
| Shop window poster | store-poster | qr | spring-2026 | window-a3 |
Lowercase everything; keep medium "qr" so all scans group together.
Step 2: Shorten if needed
Long URLs make dense codes that are harder to scan from a distance. You can point the QR code at a short link on your own domain that redirects to the tagged URL. Check that the redirect keeps the query string; some redirect setups drop it, and the visit becomes direct.
Step 3: Read scans in analytics
Open the UTM report and filter to utm_medium=qr. Each row is a placement, with visitors, sessions, bounce and duration. Because UTM parameters decide the channel before the referrer is looked at, tagged scans are counted under your campaign, not as direct.
Note the difference from scan counts in a QR generator: a generator counts every scan, including ones where the page never finished loading. Analytics counts visits that loaded the page. Expect analytics to be a little lower.
Step 4: Connect to outcomes
Set up a goal for what the code is meant to achieve: an order, a sign-up, a coupon claim. Then compare placements by goal completions, not scans. See conversion tracking.
A worked example
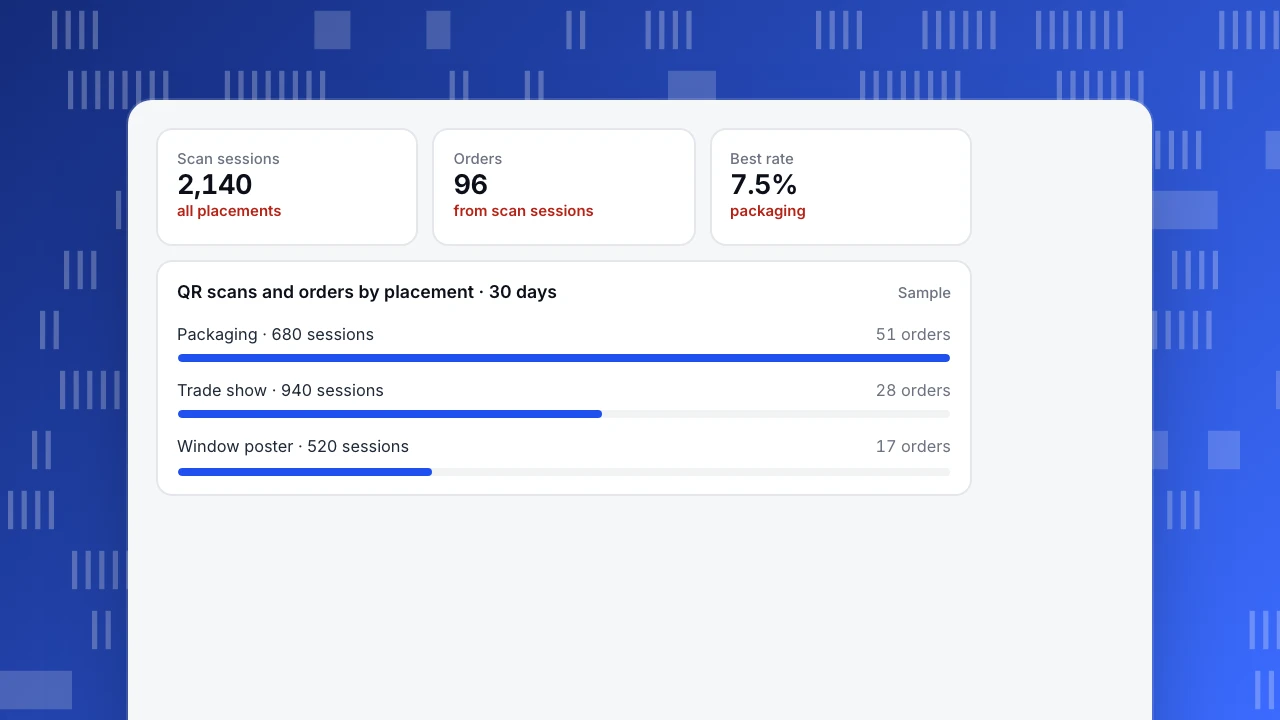
A coffee brand prints codes on packaging, a trade show banner and shop window posters. In 30 days, the trade show brings the most scan sessions (940) but only 28 orders. Packaging brings 680 sessions and 51 orders, a 7.5% order rate. The posters convert at about 3%.
The team keeps the packaging code, moves the trade show code to a discount offer that suits a first-time audience, and tests a different poster message.
Scan sessions
2,140
all placements
Orders
96
from scan sessions
Best rate
7.5%
packaging
QR scans and orders by placement · 30 days
SampleFAQ
Can Google Analytics or other tools track QR code scans?
Any analytics tool can, as long as the QR link carries UTM parameters. The tool counts visits that open the page.
Do I need a dynamic QR code?
Not for tracking. A dynamic code lets you change the destination after printing; tracking only needs a tagged URL.
Why are my QR scans showing as direct traffic?
The link has no UTM parameters, or a redirect dropped them.
Was this article helpful?
We use your answers to fix and expand this page.
Couldn’t send. Please try again in a minute.
Thanks for the feedback. We’ll use it to improve this page.You’ve already sent feedback on this page. Thanks.

Product Experience Specialist
Explores usability, user journeys, and feature adoption through practical examples of onboarding and everyday product use.