Try it on your own data
Every report in this article is in the free plan. One snippet for web and apps, up to 10 sites.
Start freeHealthcare analytics is the use of data to understand and improve care, operations and cost; for a provider's website and app it works in four layers: descriptive, diagnostic, predictive and prescriptive. The first two carry most of the value and most of the mistakes, and in health they must pass a privacy check first. This guide covers operational analytics, not patient records, and is not legal advice.
What you will learn
- Operational analytics in health means deciding what not to collect first, then measuring with aggregate counts
- Descriptive and diagnostic work (funnels, sources, errors) carries most of the value for a provider website
- An earlier funnel step usually gains more than a later one because every later step multiplies the gain
What is healthcare analytics, and which kind does this article cover?
Healthcare analytics is the use of data to understand and improve care, operations and cost. The phrase covers two quite different jobs. Clinical analytics works on patient records, claims and device data to support diagnosis, population health and outcomes research; it is run inside regulated systems by clinical and data teams. Operational analytics looks at how patients and visitors use a provider's website and app: which pages they read, where they leave a booking form, which channels bring them in.
This article is about the second job. It is for the marketing, web and product people at clinics, practices, telehealth services and health-tech companies who ask: "how do we measure our website and app without collecting what we should not?" It does not cover electronic health record (EHR) analysis, and nothing here is legal or clinical advice.
The idea to hold on to is that operational analytics in health has one extra step before the usual ones: decide what you will not collect, then measure with what is left. The rest of the article shows how to do both.
What are the four layers of healthcare analytics?
Analysts usually sort analytics into four layers that build on each other. The same four apply to a health website or app:
| Layer | Question | Website or app example | Typical output |
|---|---|---|---|
| Descriptive | What happened? | 5,000 visitors, 252 confirmed bookings last month | A dashboard or weekly report |
| Diagnostic | Why did it happen? | Bookings fell because step 3 of the form started failing on mobile | A breakdown by step, device or source |
| Predictive | What is likely next? | Expected bookings next month given seasonal traffic | A forecast with a stated error range |
| Prescriptive | What should we do? | Add a shorter mobile form and retest | A recommended change and a measurement plan |
For most provider websites, the first two layers are where the value and the mistakes are. Descriptive numbers are easy to collect but easy to misread (a rising visitor count that is mostly bots). Diagnostic work needs a defined breakdown (by step, device, source), and it is where privacy decisions bite, because a richer breakdown tempts teams to attach more personal detail to each event. Predictive and prescriptive layers need a stable history of clean data first; teams that jump to them without the first two usually forecast noise.
Which eight website and app metrics matter most for a health provider?
Pick a small set and define each one in writing. These eight cover a provider site:
| Metric | Definition | Why it matters |
|---|---|---|
| Booking conversion rate | Confirmed bookings ÷ visitors who started at the top of the booking path | The headline outcome |
| Step drop-off | Visitors lost between consecutive booking steps | Shows where to fix the form |
| Search-to-profile rate | Visitors who open a provider page ÷ visitors who ran a provider search | Tells whether search results help |
| Source mix | Share of visits by channel (search, referral, direct, email) | Tells where bookings come from |
| Mobile share | Share of visits on phones | Decides where to test first |
| Call-click rate | Clicks on the phone number ÷ visits to contact pages | Counts bookings that happen offline |
| Error rate | Error events ÷ page views on booking pages | Failures that look like abandonment |
| Page speed | Core Web Vitals on the pages that matter | Slow pages cost bookings |
Notice what is absent: any measure of who the visitor is or what condition they have. Every metric above can be computed from aggregate counts. That is not a limitation to work around; it is the design.
| Metric | Definition | Why it matters |
|---|---|---|
| Booking conversion rate | Confirmed bookings ÷ visitors who started at the top of the booking path | The headline outcome |
| Step drop-off | Visitors lost between consecutive booking steps | Shows where to fix the form |
| Search-to-profile rate | Visitors who open a provider page ÷ visitors who ran a provider search | Tells whether search results help |
| Source mix | Share of visits by channel | Tells where bookings come from |
| Mobile share | Share of visits on phones | Decides where to test first |
| Call-click rate | Phone-number clicks ÷ visits to contact pages | Counts bookings that happen offline |
| Error rate | Error events ÷ page views on booking pages | Failures that look like abandonment |
| Page speed | Core Web Vitals on key pages | Slow pages cost bookings |
None of the eight needs to know who the visitor is or what condition they have.
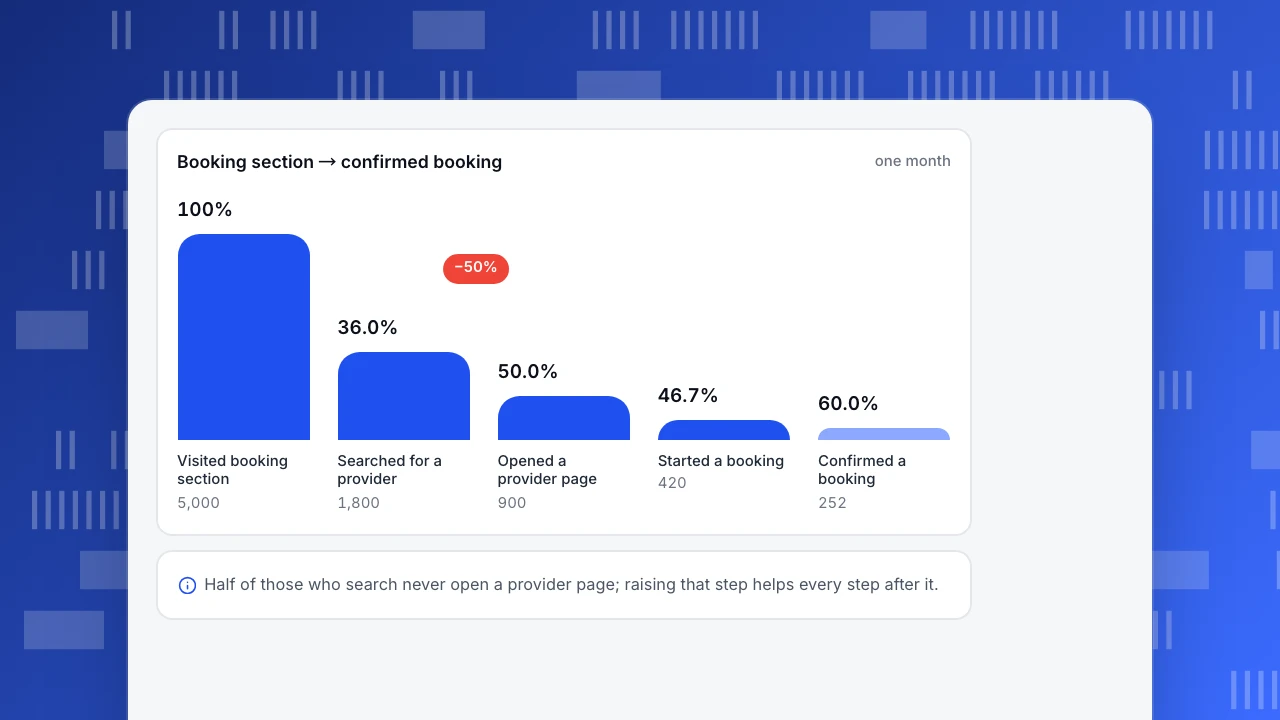
How do you calculate appointment conversion step by step?
Sample data: a clinic group tracks the booking path for one month.
| Step | Visitors | Step rate | Of all visitors |
|---|---|---|---|
| Visited the booking section | 5,000 | n/a | 100.0% |
| Searched for a provider | 1,800 | 36.0% | 36.0% |
| Opened a provider page | 900 | 50.0% | 18.0% |
| Started a booking | 420 | 46.7% | 8.4% |
| Confirmed a booking | 252 | 60.0% | 5.0% |
Each step rate is the visitors at this step ÷ visitors at the previous step: 1,800 ÷ 5,000 = 36.0%; 900 ÷ 1,800 = 50.0%; 420 ÷ 900 = 46.7%; 252 ÷ 420 = 60.0%. The overall rate is 252 ÷ 5,000 = 5.04%.
Now use the funnel to choose what to do. Two candidate changes, with the same size of improvement in points:
- Raise "started → confirmed" from 60% to 70%. 420 × 0.70 = 294 confirmed, which is 42 more (+16.7%).
- Raise "search → provider page" from 50% to 60%. 1,800 × 0.60 = 1,080 provider-page visitors; 1,080 × 46.7% = 504 booking starts; 504 × 60% = 302.4 confirmed, about 50 more (+20.0%).
The earlier step wins because every later step multiplies its gain. This is the kind of reasoning a diagnostic layer supports, and none of it needed to know who anyone was. For more ways to read a funnel, see conversion funnel optimization.
Booking section → confirmed booking
one monthVisited booking section
5,000
Searched for a provider
1,800
Opened a provider page
900
Started a booking
420
Confirmed a booking
252
What privacy line should operational analytics not cross?
In health, the sensitive part is rarely the visitor count; it is the pairing of an identifier with a health topic. Under US rules, the HIPAA de-identification standard lists IP address numbers, device identifiers, web URLs, email addresses, account numbers and dates among the 18 identifiers to remove (45 CFR 164.514(b)(2)). Under the EU's GDPR, data concerning health is a special category whose processing is prohibited unless a condition applies (Article 9), and personal data covers anything relating to an identifiable person, including online identifiers (Article 4).
Tracking on health sites has also been in front of courts. In June 2024 a federal court in Texas vacated one part of an HHS bulletin that had treated an IP address plus a visit to an unauthenticated public page about health conditions as protected information; tracking tools on authenticated pages such as patient portals stayed covered by the rest of that bulletin (summary by Holland & Knight). The takeaway is not a safe harbour; it is that the position has moved and depends on the page and the data. Ask your privacy officer, and use the rules in the next section to leave less to argue about.
What should you collect, and what should you leave out?
Apply data minimization before the first event is sent:
- Aggregate first. Use counts and rates wherever a question can be answered without individual-level data.
- Broad categories, not conditions. Record "primary care" or "specialist visit", not "oncology consult" or a diagnosis. A specialty can reveal a condition.
- Check page paths. A URL like
/conditions/fertility-treatmentcombined with an identifier says something about a person. Use neutral paths or exclude those pages from tracking. - No free text. Never send search boxes, form contents, symptom checkers or chat text into analytics properties.
- No identity on public pages. Reserve login-based identification for authenticated areas, if you use it at all.
- Skip replay and heatmaps on health pages. They capture what people see and do, and form fields are the risk.
- Set retention and a deletion path before launch, not after a complaint. See the data retention policy guide.
The same logic underlies GDPR-compliant analytics and privacy by design: start with the smallest dataset that answers the question.
What mistakes do health teams make with analytics?
- Tracking by default. Installing a tag manager with ad pixels on every page, including appointment and condition pages, sends data to third parties you may not have contracts with.
- Sending condition names as event properties. "service = HIV test" is health data attached to a device.
- Treating bots as patients. Crawlers inflate visitors and deflate conversion; separate them before judging a campaign.
- Reading a rate without its denominator. 252 confirmed from 420 starts is 60%; 252 from 5,000 visitors is 5.04%. Say which one you mean.
- Jumping to prediction. A forecast built on a funnel with unclear steps predicts your tracking, not your patients.
- Assuming the vendor's setting equals compliance. A privacy mode reduces data collected; whether your use is lawful depends on facts a tool cannot know.
- Mixing clinical and web data. Joining a booking-site visitor ID to a patient record turns web analytics into a PHI project. Keep them separate unless legal and clinical owners have approved the join. For the broader categories of analysis, see types of data analytics.
How would a health provider set this up in TapCub?
Take the clinic group above. It wants the booking funnel and the eight metrics, with no personal detail. TapCub is not a HIPAA-compliance product and makes no such claim; the setup below is about collecting less.
- Choose a collection tier. In Configuration › Privacy center, tier 1 is anonymous aggregate: no persistent ID is kept, and autocapture and identity operations are dropped. The default is tier 2. The default rule for the EEA and the UK needs consent, and pageviews and custom events are still stored when consent is missing.
- Define events in the tracking plan. In All-platform analytics › Data › Tracking plan, write the booking events (search, provider page, start, confirm) with the properties you intend to send. Keep the property list short and category-level.
- Govern properties. In All-platform analytics › Data › Property dictionary, mark each key as a direct identifier, indirect identifier or non-personal, and block keys you never want stored. Direct identifiers are masked by default.
- Read the funnel and the basics. Use All-platform analytics › Behavior › Behavior analysis for the funnel, Web analytics › Sources for the source mix, and Monitoring › Performance and Monitoring › Errors for speed and failures. Bots are counted separately in Web analytics › Bots, so they stay out of the denominators.
- Leave replay off. Session replay is off by default; keep it off on booking and condition pages.
TapCub does not run A/B tests, and it does not judge whether your configuration satisfies HIPAA or GDPR; it reports the funnel you define.
FAQ
What is healthcare analytics?
It is the use of health-related data to understand and improve care, operations and cost. It spans clinical analytics on patient records and operational analytics on websites, apps and services. This article covers the operational side.
What are the four types of healthcare analytics?
Descriptive (what happened), diagnostic (why), predictive (what is likely next) and prescriptive (what to do). Each builds on the previous one, and clean descriptive data is the base for the rest.
What is the difference between health analytics and healthcare analytics?
In practice the terms are used interchangeably. Some teams use "health analytics" for population and public-health data and "healthcare analytics" for delivery and operations, but there is no standard split, so define your scope in writing.
Can a healthcare website use analytics without collecting personal data?
Yes, for most operational questions. Aggregate counts, broad categories, no free text and no identity on public pages answer funnel, source and performance questions. Whether a given setup is allowed under HIPAA or GDPR is a question for your privacy officer.
Does analytics on a health site count as PHI?
It depends on what is collected and who the site belongs to. An IP address or device identifier paired with health-related page visits can be sensitive. Keep health topics out of properties and ask counsel about your specific tags.
Sources
- Cornell Legal Information Institute, 45 CFR 164.514, De-identification — the 18 identifiers in paragraph (b)(2)(i). Verified 2026-11-18.
- GDPR, Article 4, Definitions and Article 9, Special categories. Verified 2026-11-18.
- Holland & Knight, American Hospital Assn. v. Becerra: Are Tracking Tools OK Again?, June 2024 — law-firm summary of the 20 June 2024 ruling. Verified 2026-11-18.
Was this article helpful?
We use your answers to fix and expand this page.
Couldn’t send. Please try again in a minute.
Thanks for the feedback. We’ll use it to improve this page.You’ve already sent feedback on this page. Thanks.

Data Analyst
Explores traffic sources, conversion funnels, and retention, using clear metric definitions and concrete examples to explain what the numbers mean.