Try it on your own data
Every report in this article is in the free plan. One snippet for web and apps, up to 10 sites.
Start freeEcommerce analytics tools are best chosen by the question you need answered: where shoppers come from, where they drop out, whether ads paid back, or who buys again. Each question points to a different type of tool, so a feature count tells you little. Below: five tool types, five yes/no criteria, a counted funnel, a channel return check and the smallest stack for a store.
What you will learn
- Name the question costing money first: traffic, funnel drop-off, ad return or repeat buying
- Require ecommerce events, server-side purchase, bot separation, spend import and data export
- Judge channels on margin, not revenue: at a 40% margin, break-even return on ad spend is 2.5
What kinds of ecommerce analytics tools are there?
Ecommerce analytics tools are not one category. They are four kinds of tool, each built to answer one question. Choosing "the one with the most features" usually buys three answers you did not need and misses the one you did.
| Question | Tool type | What it measures | Typical data source |
|---|---|---|---|
| Where do shoppers come from, and what do they do on the site? | Web analytics | Visitors, sources, landing pages, goal conversion | A script on the store |
| Where do shoppers drop out between product page and payment? | Funnel and event analytics | Step-by-step conversion, cart abandonment, drop-off by segment | Product, cart, checkout and purchase events |
| Why do they leave, in practice? | Session behaviour tools | Heatmaps, scroll depth, session replay | The same script, sampled per page |
| Did the money spent on ads come back? | Marketing and attribution | Cost per click, cost per order, return on ad spend by channel | Ad spend plus orders |
| Who buys again? | Customer and retention analytics | Repeat rate, lifetime value, recency-frequency-monetary groups | Order history by person |
Most storefront platforms also ship built-in sales reports. They are accurate for orders and revenue but say little about visitors who did not buy, which is why a separate tool for the first three rows is common.
The common thread is the question. A tool is good for you if it answers the question that is costing money right now, not if it answers all five.
| Question | Tool type | What it measures |
|---|---|---|
| Where do shoppers come from? | Web analytics | Visitors, sources, landing pages, goals |
| Where do they drop out? | Funnel and event analytics | Step conversion, cart abandonment |
| Why do they leave? | Session behaviour tools | Heatmaps, scroll depth, replay |
| Did ads pay back? | Marketing and attribution | Cost per order, return on ad spend by channel |
| Who buys again? | Customer and retention analytics | Repeat rate, lifetime value, RFM groups |
One row usually decides your next tool; the rest can wait.
How do you choose with five criteria?
Score each candidate yes or no on these five. A tool that fails the first should not be on the shortlist.
- Does it track the ecommerce events you need? The recommended event names in Google's Analytics documentation are a useful checklist:
view_item,add_to_cart,begin_checkout,add_shipping_info,add_payment_infoandpurchase. If a tool cannot receive these steps, it cannot show you where the funnel leaks. - Can it send the purchase from the server? Browser tracking misses ad blockers and closed tabs on the payment page. A server-sent purchase with an order id counts each order once.
- Does it separate bots from people? Crawlers inflate visitors and deflate conversion rate. Look for a tool that counts them apart.
- Does it take ad spend? If you run paid campaigns, a tool that can import spend lets you see cost per order and return on ad spend beside the revenue.
- Can you leave? Raw export of your event data means you can move later without losing history.
How do you read a funnel with real numbers?
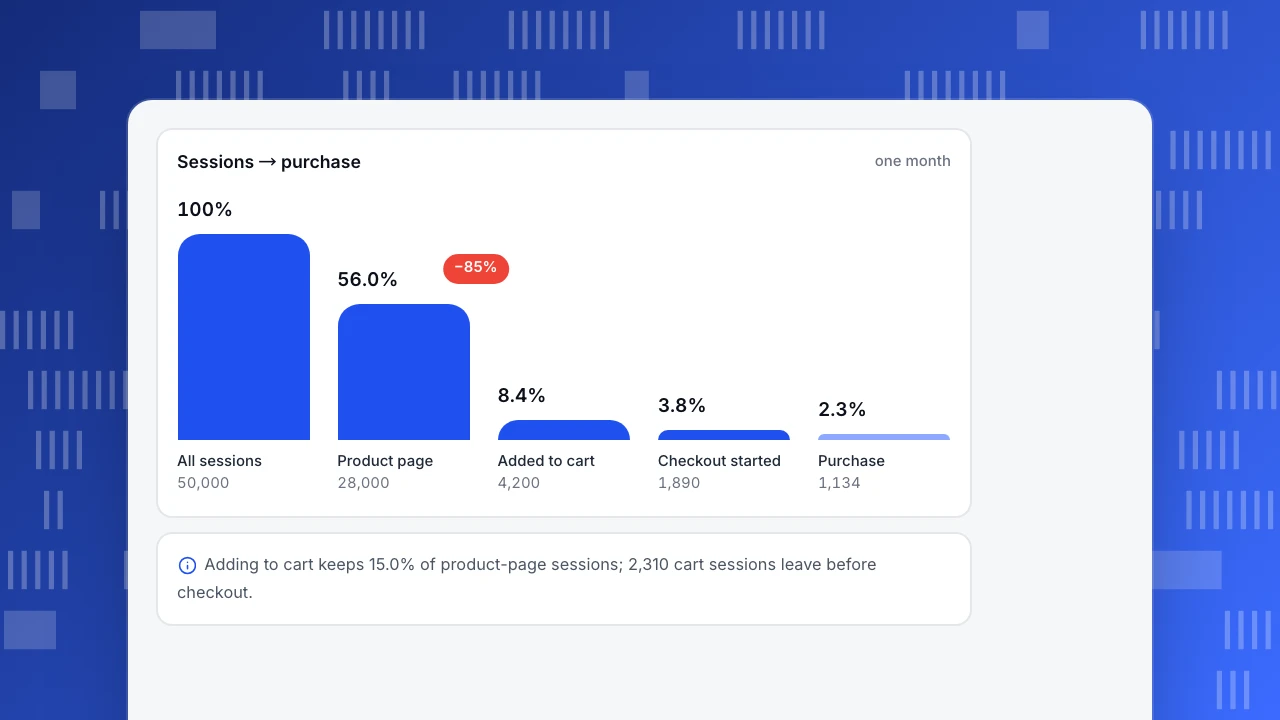
Sample data: a store records one month of sessions through each step.
| Step | Sessions | Rate vs previous step | Share of all sessions |
|---|---|---|---|
| All sessions | 50,000 | n/a | 100.0% |
| Product page viewed | 28,000 | 56.0% | 56.0% |
| Added to cart | 4,200 | 15.0% | 8.4% |
| Checkout started | 1,890 | 45.0% | 3.8% |
| Purchase | 1,134 | 60.0% | 2.27% |
Each rate is the step divided by the previous one: 28,000 ÷ 50,000 = 56.0%, 4,200 ÷ 28,000 = 15.0%, 1,890 ÷ 4,200 = 45.0%, 1,134 ÷ 1,890 = 60.0%. Overall conversion is 1,134 ÷ 50,000 = 2.27%. Cart abandonment, sessions with an add-to-cart and no purchase, is 1 − 1,134 ÷ 4,200 = 73.0%.
Two readings follow, and they point at different tools:
- The weakest step in relative terms is add to cart (15.0%). That is a product-page problem: price, photos, stock or sizing. A session behaviour tool or a split test is the next step.
- The biggest absolute loss after the cart is 2,310 sessions (4,200 − 1,890) leaving before checkout. That is a shipping-cost, account-wall or cart-page problem. Funnel analytics split by segment and device finds it.
Baymard Institute's tracker puts the average documented cart abandonment rate at 70.22% across 50 studies. Our sample's 73.0% looks close, but definitions differ between studies and between tools, so use the benchmark only as context. The comparison that matters is your own rate from last month.
Sessions → purchase
one monthAll sessions
50,000
Product page
28,000
Added to cart
4,200
Checkout started
1,890
Purchase
1,134
How do you compare ad channels without fooling yourself?
Return on ad spend is revenue ÷ spend. Sample data: two paid channels in the same month.
| Channel | Spend | Attributed revenue | Return on ad spend |
|---|---|---|---|
| Channel A | $4,000 | $10,400 | 2.60 |
| Channel B | $5,000 | $7,500 | 1.50 |
| Total | $9,000 | $17,900 | 1.99 |
A: 10,400 ÷ 4,000 = 2.60. B: 7,500 ÷ 5,000 = 1.50. Total: 17,900 ÷ 9,000 = 1.99. Channel B looks weak, but three checks come before cutting it:
- Revenue is not profit. At a 40% gross margin, break-even return on ad spend is 1 ÷ 0.40 = 2.5. Channel A at 2.60 earns 2.60 × 0.40 = $1.04 of margin per $1 spent; channel B at 1.50 earns 1.50 × 0.40 = $0.60, so it loses $0.40 per $1 before other costs. Judge channels on return on margin, not revenue.
- Last-touch hides assists. If channel B often starts journeys that channel A finishes, last-touch credits A. Compare attribution models side by side before moving budget.
- Time window matters. A channel that sells products people think about for two weeks looks poor on a seven-day window.
Which tool? One that takes spend by channel and shows orders beside it. A web-analytics tool without spend import cannot do this on its own.
Who comes back, and which tool shows it?
Repeat rate is people with two or more purchases ÷ all buyers. Sample data: in the last 12 months 1,020 people bought, and 204 of them bought at least twice, so repeat rate is 204 ÷ 1,020 = 20.0%.
A single repeat rate hides groups. Recency-frequency-monetary groups split buyers into champions, loyal, at-risk and sleeping segments from how recently, how often and how much they bought. A retention-oriented tool then lets you send different treatment to each group. The decision rule: if repeat rate is below your target and your ads are fine, the gap is retention, not traffic, and the next tool you add should be a customer and retention view, not another traffic report.
What is the smallest stack for a store?
For a store with no analyst:
- Your platform's own sales report for orders and revenue.
- One analytics tool that covers web analytics and funnels with ecommerce events, sends the purchase from the server and counts bots apart.
- Spend import or a spreadsheet for ad cost by channel, until paid traffic is big enough to justify more.
- Session behaviour tools only on the pages the funnel flags, not sitewide.
Add customer and retention analytics when repeat purchases become a real share of revenue. Rule: add a tool only for a question you have asked three times and could not answer.
What mistakes do stores make when choosing?
- Choosing by feature count. A long feature list is a tax: every feature needs setup that someone has to own.
- Tracking
purchasein the browser only. Payment redirects and ad blockers lose orders, so revenue never reconciles with the platform. Send it from the server with an order id. - Using revenue instead of margin when judging channels (see the example above).
- Adding a heatmap tool before the funnel. Without a funnel you do not know which page to look at.
- Ignoring bots. Bot traffic raises sessions and lowers conversion rate, and nobody notices because the trend looks like seasonality.
- Comparing your rate with a benchmark and stopping there. The benchmark cannot tell you which step leaks.
How does this work in TapCub?
Take the sample store above. Here is how its funnel and channel questions run in TapCub.
- Send orders. On payment success, send a
purchaseevent from your server with order id, amount and currency, and arefundwith the same order id. The order id deduplicates retries. - Read the funnel and cart abandonment. In All-platform analytics › Business › Commerce & revenue, the purchase funnel runs per session through view item, add to cart, checkout and purchase, with cart abandonment rate and left-behind value. Event names are editable in business settings. In All-platform analytics › Behavior › Behavior analysis, build the same funnel and split it by segment.
- Compare channels. In All-platform analytics › Business › Channel ROI, import spend by day, channel, source or campaign (CSV or one by one). The page shows cost per click (spend ÷ sessions), cost per acquisition (spend ÷ purchases in orders) and return on ad spend. The same report lets you select several attribution models at once, in columns, so a channel that mostly assists shows up. Return on ad spend uses revenue, so apply your margin yourself.
- Look at repeat buyers. The repeat rate (people with at least two purchases ÷ buyers) and the RFM score grid sit in the same Commerce & revenue area, and RFM groups can be turned into a segment in All-platform analytics › Users › Segments & tags.
- Look at the flagged page. All-platform analytics › Behavior › Heatmaps and Session replay exist; session replay is off by default.
TapCub does not run ads or bids, process payments, run split tests or manage customer lists and email; it measures. Bots are counted apart from people in Web analytics › Bots.
FAQ
What are ecommerce analytics tools?
Software that measures how shoppers find, browse and buy from an online store: traffic and sources, funnel steps from product to purchase, ad return, and repeat buying. Different tools answer different questions, so match the tool to the question you have.
Which ecommerce analytics tool should a small store start with?
Start with the platform's own sales report plus one analytics tool that tracks ecommerce events, sends the purchase from the server and separates bots. Add behaviour or retention tools later, when the funnel or repeat rate shows a specific gap.
What is a good cart abandonment rate?
Baymard Institute's tracker reports an average of about 70% across 50 studies, but definitions differ, so treat that as context. A good rate is one that is falling against your own previous months, with the leaking step identified.
What metrics should ecommerce analytics track?
Conversion rate by step, cart abandonment, average order value, return on ad spend by channel, repeat rate and refund rate. Your KPI list should be short enough to review weekly.
Do I need Google Analytics for ecommerce analytics?
No. Any tool that receives the recommended ecommerce events and shows funnel and channel results can serve. Check that it handles server-sent purchases and bot filtering, and that you can export your data.
Sources
- Google. Measure ecommerce (GA4). Recommended ecommerce event names such as view_item, add_to_cart, begin_checkout and purchase. Verified 2026-11-18.
- Baymard Institute. Cart Abandonment Rate Statistics. Average documented rate 70.22% across 50 studies. Verified 2026-11-18.
Was this article helpful?
We use your answers to fix and expand this page.
Couldn’t send. Please try again in a minute.
Thanks for the feedback. We’ll use it to improve this page.You’ve already sent feedback on this page. Thanks.

Product Experience Specialist
Writes about product experience, practical workflows, and growth, turning complex processes into clear steps for everyday decisions.