Try it on your own data
Every report in this article is in the free plan. One snippet for web and apps, up to 10 sites.
Start freeThe useful heat map examples are patterns, not pictures: one clear hotspot, scattered clicks, rage clicks, a scroll cliff, a good button few people reach, and a different map on mobile. Name the pattern first, then check what it usually means. A heat map shows what people did, not why.
What you will learn
- Learn six shapes: hotspot, scatter, rage cluster, scroll cliff, unreached element, device gap
- Judge a button by clicks divided by the visitors who reached it; in the sample 3.5% becomes 12.5%
- Always filter by device and check sessions or errors before redesigning
What a website heat map example should teach you
A heat map is a picture of where attention or clicks gather on a page, with colour running from cool to hot as density rises. Looking at one is easy; knowing what to do about it is the skill. Most pages that show "heat map examples" show pretty pictures. This article shows patterns, and for each one what it usually means, what to check next and what to change.
If you want the step-by-step method for reading any heat map, start with how to read a heatmap and the heatmap definition. Here the focus is on six shapes you will see again and again, so you can name them quickly.
One caution applies to every example: a heat map shows what people did, not why. It tells you where to look; it does not tell you the cause. Each pattern below ends with a way to test the explanation.
The three kinds of website heat map
Website heat maps come in three forms, and the patterns depend on which one you are looking at.
| Kind | What it shows | Best for |
|---|---|---|
| Click map | Where people click, by position on the page | Finding the controls people actually use |
| Scroll map | The share of visits that reached each depth | Finding where people stop reading |
| Element ranking | The most clicked buttons and links, with shares | Comparing controls on a crowded page |
Many tools add a fourth, a view of repeated rapid clicking on one spot, usually called rage clicks. It is the most direct signal that something looks interactive and does not respond.
Eye-tracking heat maps from research labs, and the colour grids used in other fields, are a different thing. The patterns here are about click and scroll data from real visits to your own site.
The six patterns, and what each usually means
| Pattern | What it looks like | Usually means | Check next |
|---|---|---|---|
| 1. One clear hotspot | Most clicks on a single button | The main action is visible and understood | Does the click lead to the goal? |
| 2. Scattered clicks across navigation | Many small hotspots in menus and links | Visitors are searching, not finding | Search terms, top exit pages |
| 3. Rage clicks | A tight cluster of rapid repeat clicks | A control looks clickable but does nothing, or is slow | Session replays, error logs |
| 4. Scroll cliff | Reach falls sharply at one depth | A false bottom, or the content stops being relevant | Layout at that depth, device |
| 5. Hot element nobody reaches | Good click rate among those who see it, but few reach it | Placement problem, not offer problem | Reach at the element's depth |
| 6. Pattern differs by device | Same page, different map on mobile | The mobile layout moves or hides things | Device filter, tap targets |
| Pattern | Usually means | Check next |
|---|---|---|
| One clear hotspot | Main action is visible and understood | Does the click lead to the goal? |
| Scattered clicks across navigation | Visitors are searching, not finding | Search terms, top exit pages |
| Rage clicks | A control looks clickable but does nothing, or is slow | Session replays, error logs |
| Scroll cliff | A false bottom, or content stops being relevant | Layout at that depth, device |
| Hot element nobody reaches | Placement problem, not offer problem | Reach at the element's depth |
| Different map on mobile | Mobile layout moves or hides things | Device filter, tap targets |
A heat map shows what people did; use sessions, errors and funnels to test why.
Pattern 1: one clear hotspot on the main action
What it looks like: one button, usually the primary call to action, is the hottest spot on the page; the element ranking puts it far above everything else.
What it usually means: the action is visible, the label is understood, and visitors want it. This is the healthy shape, and it does not need fixing.
What to check: a hot button is not a conversion. Follow the click to the next step. If the button gets 12% of visits but the page after it loses most of them, the problem is the next page, not the button. Also check that the hotspot is the action you want. A big "Learn more" link that outranks "Start trial" is a hotspot too, just not the right one.
What to change: usually nothing on this page. If the primary action is hot and the goal is not reached, turn to the funnel.
Pattern 2: clicks scattered across navigation
What it looks like: dozens of small hot spots across the menu, footer and body links, with no dominant control.
What it usually means: visitors do not see an obvious next step, so they search the page. On a pricing or product page this often reflects missing information. A menu that gets more clicks than the content is a sign of people looking for something the page did not give them.
What to check: look at the element ranking and ask which links are the most clicked. If "Pricing", "Contact" or "Docs" top the list on a page that should have answered those questions, the page is missing them. Cross-check with on-site search terms and top exit pages.
What to change: bring the missing answer onto the page, or move the single most important next step to where the eye lands. Remove links that compete with the goal rather than adding more.
Pattern 3: rage clicks on a control that does not respond
What it looks like: a small, very hot spot where visitors click repeatedly within a fraction of a second.
What it usually means: something looks interactive and is not, is slow, or is broken. Common culprits are a button that needs a second to respond, an element that looks like a link but is plain text, a submit button that fails silently or a menu that does not open on touch.
What to check: open the sessions that contain the rage clicks and watch what happened next. Look at the error log for the same page and time. A cluster of rage clicks on the payment button, together with errors on that page, is a conversion leak you can price in orders.
What to change: make the control respond immediately, show a loading state, fix the error, or remove the styling that makes non-clickable text look clickable.
Pattern 4: a scroll cliff
What it looks like: reach drops steeply at one depth, for example from 61% to 28% within a fifth of the page.
What it usually means: a false bottom. A full-width block, a row of logos or a big empty gap can look like the end of the page, so people stop. It can also be a point where the content stops being relevant.
What to check: compare the scroll map with the layout at that depth. Is there a wide band of colour, an image or white space exactly where reach falls? Check both desktop and mobile; a cliff on one device usually points to a layout issue on that device.
Nielsen Norman Group's eye-tracking research gives a useful reference: in its 2018 study of 120 participants, 57% of viewing time was spent above the fold, and 74% in the first two screenfuls. Attention fades with depth, so a gradual decline is normal; a sudden step is the signal.
What to change: remove or reshape the false bottom, add a visual cue that content continues, or move important elements above the cliff.
Pattern 5: a good element that few people reach
What it looks like: a call to action with a low total click count, placed low on the page, on a scroll map where reach at that depth is also low.
What it usually means: a placement problem, not an offer problem. The raw click count looks weak, but divided by the visitors who reached the button, it can be perfectly healthy.
A related case is banner blindness. Nielsen Norman Group found that people ignore content that looks like an ad, including useful content styled with a coloured box, animation or promotional layout; in one study the right rail got about 33 times less attention than its size warranted. A button that sits in a banner-like block can be invisible for that reason alone, whatever it says.
What to check: calculate clicks divided by reach, not clicks divided by visits (see the example below). Look at whether the element's design resembles an advertisement.
What to change: move the element to where reach is higher, or restyle it to look like part of the page.
Pattern 6: the same page, a different map on mobile
What it looks like: clicks spread evenly on desktop and gather at the top on mobile, or a button that is hot on desktop has no heat at all on mobile.
What it usually means: the mobile layout moves, stacks or hides things. Buttons can drop below a long image, menus collapse into a control people do not notice, or targets are too small to tap.
What to check: always filter by device before drawing a conclusion. For tap targets, WCAG 2.2 success criterion 2.5.8 sets a minimum of 24 by 24 CSS pixels, with a spacing exception. Rage clicks that cluster on small adjacent links on mobile often mean mis-taps.
What to change: fix the mobile layout on its own terms; do not assume what works on desktop translates.
Worked example: a call to action nobody reaches
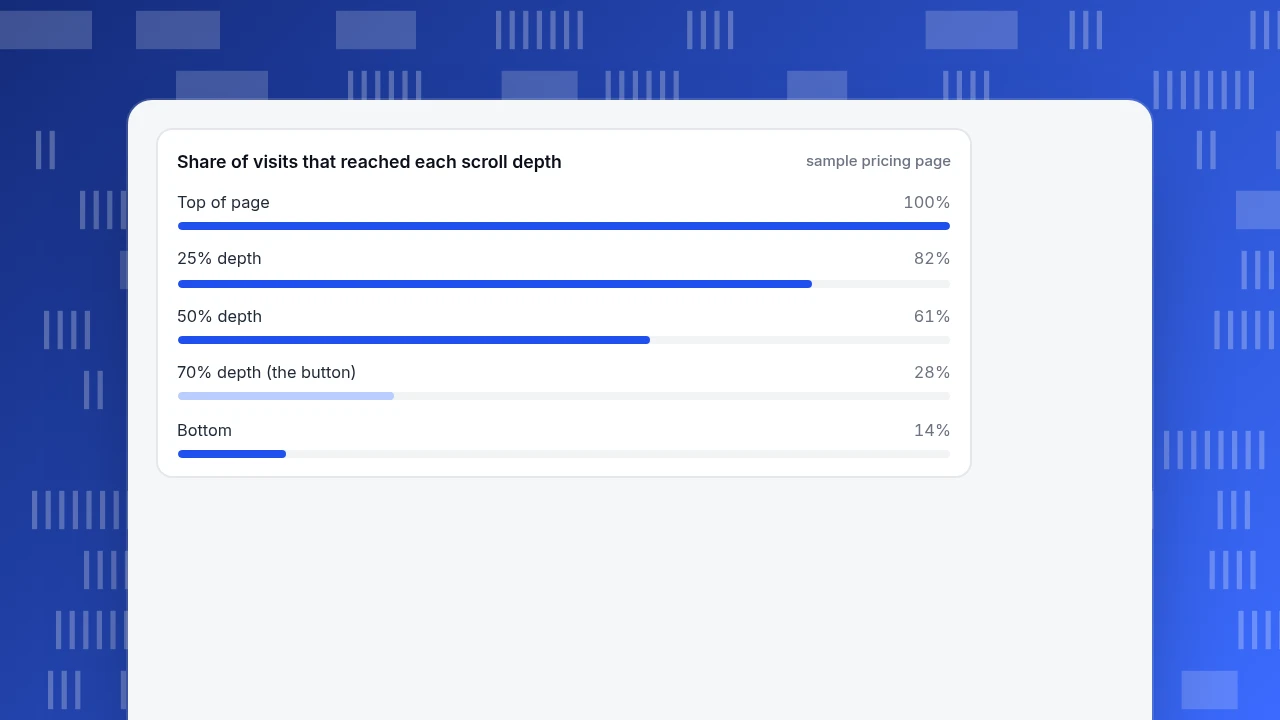
Sample data: a pricing page with 4,000 visits in the period. The call to action sits near the bottom, at about 70% of the page depth.
| Scroll depth | Share of visits that reached it |
|---|---|
| 0% (top) | 100% |
| 25% | 82% |
| 50% | 61% |
| 70% (the button) | 28% |
| 100% | 14% |
The button received 140 clicks. On total visits that is 140 ÷ 4,000 = 3.5%, which looks weak. But only 28% of visits reached it: 4,000 × 28% = 1,120 visits. Among those who saw it, the click rate is 140 ÷ 1,120 = 12.5%. The button works; it is simply too low.
Now suppose a layout change moves the button up to where reach is 60%. If the rate among viewers stays at 12.5%, clicks become 4,000 × 60% × 12.5% = 300, an increase of 160 clicks from the same traffic. That is a prediction to test, not a promise. The click rate among viewers may change when more casual readers see the button. Measure it after the change.
Without the reach figure you might have concluded that the button text was weak and spent a week rewriting it.
Share of visits that reached each scroll depth
sample pricing pageRules for reading any heat map
- If clicks are high but conversions are not, look at the page after the click.
- If clicks are low and reach is low, it is a placement problem.
- If clicks are low and reach is high, it is an offer or label problem.
- If rage clicks cluster, watch the sessions and check for errors before redesigning.
- If reach drops sharply at one depth, look for a false bottom.
- If mobile differs, fix mobile separately.
- Never act on one page's map alone. Check that it holds for a full period and enough visits.
Common mistakes
- Reading the colour as success. Hot means busy, not good. A page with scattered heat may be lost visitors.
- Dividing clicks by all visits instead of by those who reached the element.
- Ignoring device differences, which average two different pages together.
- Using too few visits. A map built from 50 visits is a story, not evidence.
- Redesigning from a single picture without checking sessions or errors for the cause.
- Forgetting dynamic content. Pages that change between visits blur into one map.
- Treating the heat map as the answer instead of a way to choose what to test.
In TapCub: read the six patterns on your own pages
Take the pricing page from the example. Here is how to find each pattern in TapCub.
- Turn on collection. Heat maps need autocapture, which needs the Pro plan or higher. Enable Scroll depth there; scroll reach stays empty until it is on. You can limit pages with path patterns such as
/product/*. - Open Heatmaps. In All-platform analytics › Behavior › Heatmaps, pick the page in the list and choose a device: all, desktop, mobile or tablet. Rows are merged by path template, and the date range goes up to 92 days.
- Use the four tabs. Clicks shows density (blue to red), Rage clicks shows rapid repeat clicks, Scroll reach shows the share of visits that reached each depth, and Elements ranks the most clicked controls with their share and visitors.
- Do the example calculation. Read the reach at the button's depth from Scroll reach, and the button's clicks from Elements; divide to get the click rate among viewers.
- Check a pattern with a session. For rage clicks, open All-platform analytics › Behavior › Session replay, filter the list to rage clicks, and watch the session. Replay is off by default and must be turned on in its settings with input masking kept on. Add a date annotation under Configuration › Annotations when you ship a layout change.
Two limits to know: collection records clickable elements only, so a click on plain text or a picture that is not a link does not appear on the click map; session replay is the way to see that behaviour. And the heat map has no compare period, so compare two date ranges yourself. For scroll data in the glossary, see scroll depth.
FAQ
What are some examples of website heat maps?
The common ones are click maps, scroll maps, element rankings and rage-click maps. In practice they show recurring shapes: one clear hotspot on the main button, scattered clicks across menus, rage clicks on a control that does not respond, a sudden drop in scroll reach, and different patterns on mobile.
How do you read a heat map?
Start with the question, such as where people stop or what they click. Then name the pattern: hotspot, scatter, rage cluster, scroll cliff, unreached element or device difference. Check what that pattern usually means, test the explanation with sessions or errors, and compare clicks with reach rather than total visits.
What does a lot of red on a heat map mean?
It means many clicks or much attention at that spot, not that it is working. A hot call to action is good only if the next step converts. Red on a menu link may mean visitors are searching for something the page did not give them.
Are heat maps useful for mobile pages?
Yes, but read them separately from desktop. Layouts move, stack and hide elements on mobile, so the same page produces a different map. Check tap-target size too: WCAG 2.2 sets a 24 by 24 CSS pixel minimum for pointer targets, with a spacing exception.
How many visits does a heat map need?
There is no magic number, but a map built from a few dozen visits is unreliable. Use a full period and enough visits that the pattern holds when you split by device. If the picture changes a lot as visits accumulate, wait before acting.
Sources
- Nielsen Norman Group, Scrolling and Attention (2018 study: 57% of viewing time above the fold, 74% in the first two screenfuls; 120 participants). Checked 2026-11-19.
- Nielsen Norman Group, Banner Blindness: Old and New Findings (ad-like content is ignored; right rail about 33 times less attention than its size warranted in one study). Checked 2026-11-19.
- W3C, Understanding SC 2.5.8: Target Size (Minimum), WCAG 2.2 (24 by 24 CSS pixels, spacing exception). Checked 2026-11-19.
Was this article helpful?
We use your answers to fix and expand this page.
Couldn’t send. Please try again in a minute.
Thanks for the feedback. We’ll use it to improve this page.You’ve already sent feedback on this page. Thanks.

Customer Experience Consultant
Writes about live chat, visitor conversations, and self-service, sharing practical ways to make customer communication clearer and more effective.