Try it on your own data
Every report in this article is in the free plan. One snippet for web and apps, up to 10 sites.
Start freeAI brand visibility software tells you how often AI assistants mention or cite your brand, but the scores depend on how the tool samples: runs per prompt, which prompts, which model surface and where. Check the method before the dashboard. Below: the three kinds of tool, why a 35% can really be 18% to 57%, questions to put to a vendor, a worked comparison of two reports and what TapCub can and cannot show.
What you will learn
- Prompt-sampling scores are estimates; ask how many runs sit behind a number, because 7 of 20 runs gives 18.1% to 56.7% while 35 of 100 gives 26.4% to 44.7%
- Ask for the prompt list, the model surfaces, the mention definition and the raw answers before comparing any two tools
- What AI systems do on your own site (crawler reads, referred visits) is observable and needs no sampling
What does AI brand visibility software measure?
AI brand visibility software reports how often, and in what way, AI assistants mention or cite your brand. Most products do this by running a fixed list of prompts against one or more models, many times, and counting what comes back: how often your brand is named, whether your site is cited, where in the answer it appears and whether the tone is positive. A smaller group measures something different and observable: which AI crawlers read your site and how many visitors AI assistants send back.
These are three different kinds of tool, and comparing them as if they were one is the first mistake buyers make.
| Kind | What it measures | Where the data comes from | Typical output |
|---|---|---|---|
| Prompt-sampling tracker | What models say about you for chosen prompts | Prompts the vendor runs against models, repeatedly | Mention rate, citation rate, position, sentiment |
| Site-side analytics | What AI systems do on your own site | Your traffic and server logs | Crawler reads, AI-referred visits, cited pages |
| Content and PR tools | What to change so you are mentioned more | Analysis of pages and third-party sources | Recommendations, gap lists |
The rest of this guide is about how to judge the first kind, because that is where the numbers differ most, and where one line of method explains why. The wider question of what to do about AI visibility is in AI visibility, and a step-by-step review is in AI visibility audit.
Why the same brand gets different scores in different tools
Every prompt-sampling number is an estimate from a sample, and samples vary. Ask a model the same question twenty times and it will not give the same answer twenty times. Four things move the score before any real change in visibility:
- Runs per prompt. Fewer runs means a wider margin of error.
- The prompt list. Prompts that already contain your category or brand cues return you more often than neutral ones.
- The surface. A model reached through a developer interface can answer differently from the same model in its consumer app, with or without live web search.
- Location, time and model version. Answers shift by country, by week and when the model is updated.
The first factor can be quantified. For a mention rate p measured over n runs, a standard approximation of the 95% range is the Wilson interval. Sample data: the same brand is mentioned in 7 of 20 runs of a prompt, 35%.
| Runs | Mentions | Rate | 95% range |
|---|---|---|---|
| 20 | 7 | 35% | 18.1% to 56.7% |
| 100 | 35 | 35% | 26.4% to 44.7% |
| 200 | 70 | 35% | 28.7% to 41.8% |
The point estimate never changes; the range narrows from 38.6 points wide at 20 runs to 18.3 at 100 and 13.1 at 200. A vendor showing "35%" with no run count is showing you a number without telling you how much to trust it.
Questions to ask any AI visibility software vendor
Most of the quality of these tools is in the method, and the method is rarely on the pricing page. Ask these questions, and note whether the answers are specific.
| Question | What a specific answer sounds like | Why it matters |
|---|---|---|
| How many runs per prompt per refresh? | A number, with the interval shown | Sets the margin of error |
| Who writes the prompts? | You can see, edit and export the full list | Neutral prompts and brand-cued prompts give different scores |
| Which models and surfaces? | Named models, with and without search | Scores are not comparable across surfaces |
| Where are the runs made from? | A country or city setting | Answers vary by location |
| How is a mention defined? | Exact rules: name match, alias, link | "Mentioned" and "cited" are different numbers |
| Can I see the raw answers? | Yes, stored and exportable | Lets you check any score by hand |
| What happens when a model updates? | Version noted on the chart | Explains sudden jumps |
| Is history kept? | Months of trend with a stable method | A changed method breaks the trend |
A vendor who cannot say how many runs sit behind a number is selling a result without its error bar.
| Kind | What it measures | Typical output |
|---|---|---|
| Prompt-sampling tracker | What models say about you for chosen prompts | Mention rate, citation rate, position, sentiment |
| Site-side analytics | What AI systems do on your own site | Crawler reads, AI-referred visits, cited pages |
| Content and PR tools | What to change so you are mentioned more | Recommendations, gap lists |
Compare tools within a kind, never across kinds.
A worked example: two reports on the same brand
Sample data: Tool A reports that a brand is mentioned for a category prompt in 35% of answers. Tool B, for a similar prompt, reports 52%. A manager asks which is right.
The run counts are the first thing to check:
- Tool A: 7 mentions in 20 runs, so 7 ÷ 20 = 35%, with a 95% range of 18.1% to 56.7%.
- Tool B: 52 mentions in 100 runs, 52%, with a range of 42.3% to 61.5%.
The ranges overlap from 42.3% to 56.7%. On this evidence you cannot say the tools disagree, because Tool A's estimate is too imprecise to rule out Tool B's number. Next, check the method differences:
- Tool B's prompt includes the product category and a region; Tool A's is neutral.
- Tool B runs the model with web search on; Tool A does not.
- Tool A runs once a week; Tool B runs daily and averages.
Three method differences and an overlapping range explain the gap without anyone being wrong. The sensible decision is not to pick a winner but to fix one prompt list, one surface and at least 100 runs per prompt, and track the change in that one setting over time.
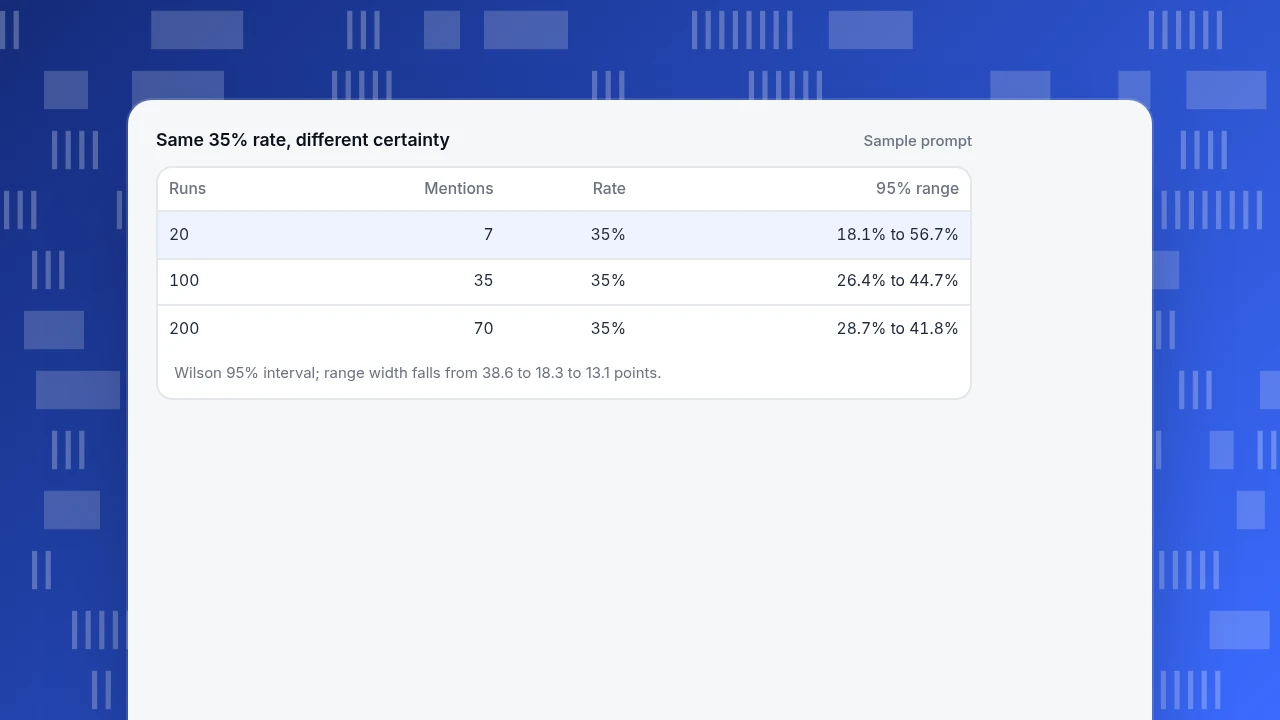
Same 35% rate, different certainty
Sample prompt| Runs | Mentions | Rate | 95% range |
|---|---|---|---|
| 20 | 7 | 35% | 18.1% to 56.7% |
| 100 | 35 | 35% | 26.4% to 44.7% |
| 200 | 70 | 35% | 28.7% to 41.8% |
Wilson 95% interval; range width falls from 38.6 to 18.3 to 13.1 points.
How to choose AI visibility software for the job
Decide what question you need answered, then apply the matching rule.
| If you need to know... | Look for | Check first |
|---|---|---|
| Whether models name you against competitors for your category prompts | A prompt-sampling tracker | Runs per prompt, prompt list, surfaces |
| Which AI crawlers read your site and which pages | Site-side analytics | Whether it sees bots that do not run JavaScript |
| Whether AI assistants send you visitors | Site-side analytics | Whether referrals are counted as human sessions |
| Which sources models cite instead of you | A tracker that stores cited URLs | Whether the raw citations are exportable |
| What content to change | A content or PR tool | Whether recommendations are tied to measured gaps |
Software that gives one blended "visibility score" is the hardest to assess, because the weights behind it are rarely explained. Prefer separate numbers you can define.
If a tool cannot show raw answers, treat its scores as directional, not as a measurement you can report upward. If it shows raw answers and a stated run count, you can verify it yourself, and that is worth more than a polished chart.
Which AI visibility software is the most accurate?
There is no independent accuracy benchmark that ranks vendors, so any claim of "most accurate" is the vendor's own. Accuracy here has two parts: how closely the sample represents what real people ask, and how precisely the rate is measured given the sample. The second part you can check with arithmetic, as above. The first depends on whether the prompts reflect your customers' real questions, which only you can judge. Ask for the method, test the tool against a hand-run sample of twenty prompts, and read the intervals.
Common mistakes when buying AI visibility software
- Comparing scores across tools. Different prompts, surfaces and run counts mean different numbers; compare changes inside one tool.
- Ignoring the margin of error. A move from 35% to 45% on 20 runs is inside the noise, since both ranges overlap.
- Treating a mention as a citation. One is the brand name in text; the other is a link to your page that can send a visitor.
- Trusting a blended score. If you cannot decompose it, you cannot act on it.
- Using only neutral prompts, or only brand prompts. Neutral prompts show discovery; brand prompts show reputation. Track both separately.
- Skipping your own traffic. What AI systems do on your site is observable, and no sampling error applies to it.
What TapCub shows about AI visibility
TapCub is not a prompt-sampling tracker. It does not ask AI models questions or compute mention rate or sentiment. It measures the part you can observe directly: what AI systems do on your site.
- See who is reading. In Web analytics › Bots, open AI & agents. The AI content ledger lists each operator's reads, with training crawlers and answer engines in separate columns, plus the human visitors they sent back and the ratio of reads to visitors.
- Check the loop. The AI visibility tab puts AI crawls, AI-referred visits and crawl-to-visit ratio in one place, with a By AI brand table.
- Find the pages being cited. Cited pages lists landing pages that received AI-referred visits. Web analytics › Sources has an AI sources tab that counts people, not crawlers.
- Pair it with a sampling tool. If a tracker says your brand is mentioned more often, check here whether visits from AI assistants rose too.
- Know the limit. With only the page script you see bots that run JavaScript; crawlers that do not need server events or a log import. Different AI operators use separate agents for search, training and user requests, so read the purpose column before concluding anything.
FAQ
What is AI brand visibility software?
Software that reports how often AI assistants mention or cite a brand. Most products run a fixed prompt list against models repeatedly and report mention rate, citations and sentiment; some measure AI crawler reads and AI-referred visits on your own site instead.
What is the most accurate AI visibility metrics software?
No independent benchmark ranks vendors, so "most accurate" is a vendor claim. Judge by method: runs per prompt, prompt list, surfaces covered, mention definition and whether raw answers are exportable. A rate based on 100 runs has about half the margin of error of one based on 20, for a sample rate of 35%.
How do you choose the best platform for AI visibility metrics?
Start with the question you need answered, not a feature list. Competitor comparison needs a prompt-sampling tracker with a stated run count; crawler reads and AI referrals need site-side analytics. Test any tool by comparing its output with twenty prompts you run by hand.
Can AI visibility be measured exactly?
No. Model answers vary between runs, locations and versions, so every figure is an estimate from a sample. Report it with a run count and an interval, and treat changes smaller than the interval as noise.
Sources
- Edwin B. Wilson. Probable Inference, the Law of Succession, and Statistical Inference. Journal of the American Statistical Association 22(158), 1927 — the interval used for the 95% ranges. Verified 2026-11-19 (DOI link returns 403 to scripts).
- OpenAI. Overview of OpenAI crawlers — separate agents for search (OAI-SearchBot), training (GPTBot) and user requests (ChatGPT-User). Verified 2026-11-19.
- Perplexity. Perplexity crawlers — PerplexityBot for search results and Perplexity-User for user-requested visits. Verified 2026-11-19.
Was this article helpful?
We use your answers to fix and expand this page.
Couldn’t send. Please try again in a minute.
Thanks for the feedback. We’ll use it to improve this page.You’ve already sent feedback on this page. Thanks.

Data Analyst
Explores traffic sources, conversion funnels, and retention, using clear metric definitions and concrete examples to explain what the numbers mean.